Rules Are Rules
Ever heard of that saying, “Rules are meant to be broken”? Whether or not it’s the right thing to do, rules apply to trading…and let me tell you, there are plenty of rules. We’re going to focus on one particular rule, and it’s one found in nature. In fact, it was formulated first by Galileo Galilei (yes, that Galileo) in the early 1600s. It was called the “Moment of Inertia”.
Rule #1
“The natural property of an object which forces it to remain in the same state and opposes the change in state is called Inertia.”
Some years later, another smart guy named Isaac Newton further refined it as his First Law of Inertia.
“An object at rest remains at rest, and an object in motion remains in motion at constant speed and in a straight line unless acted on by an unbalanced force.”
Newton’s Cradle

Back to the Future
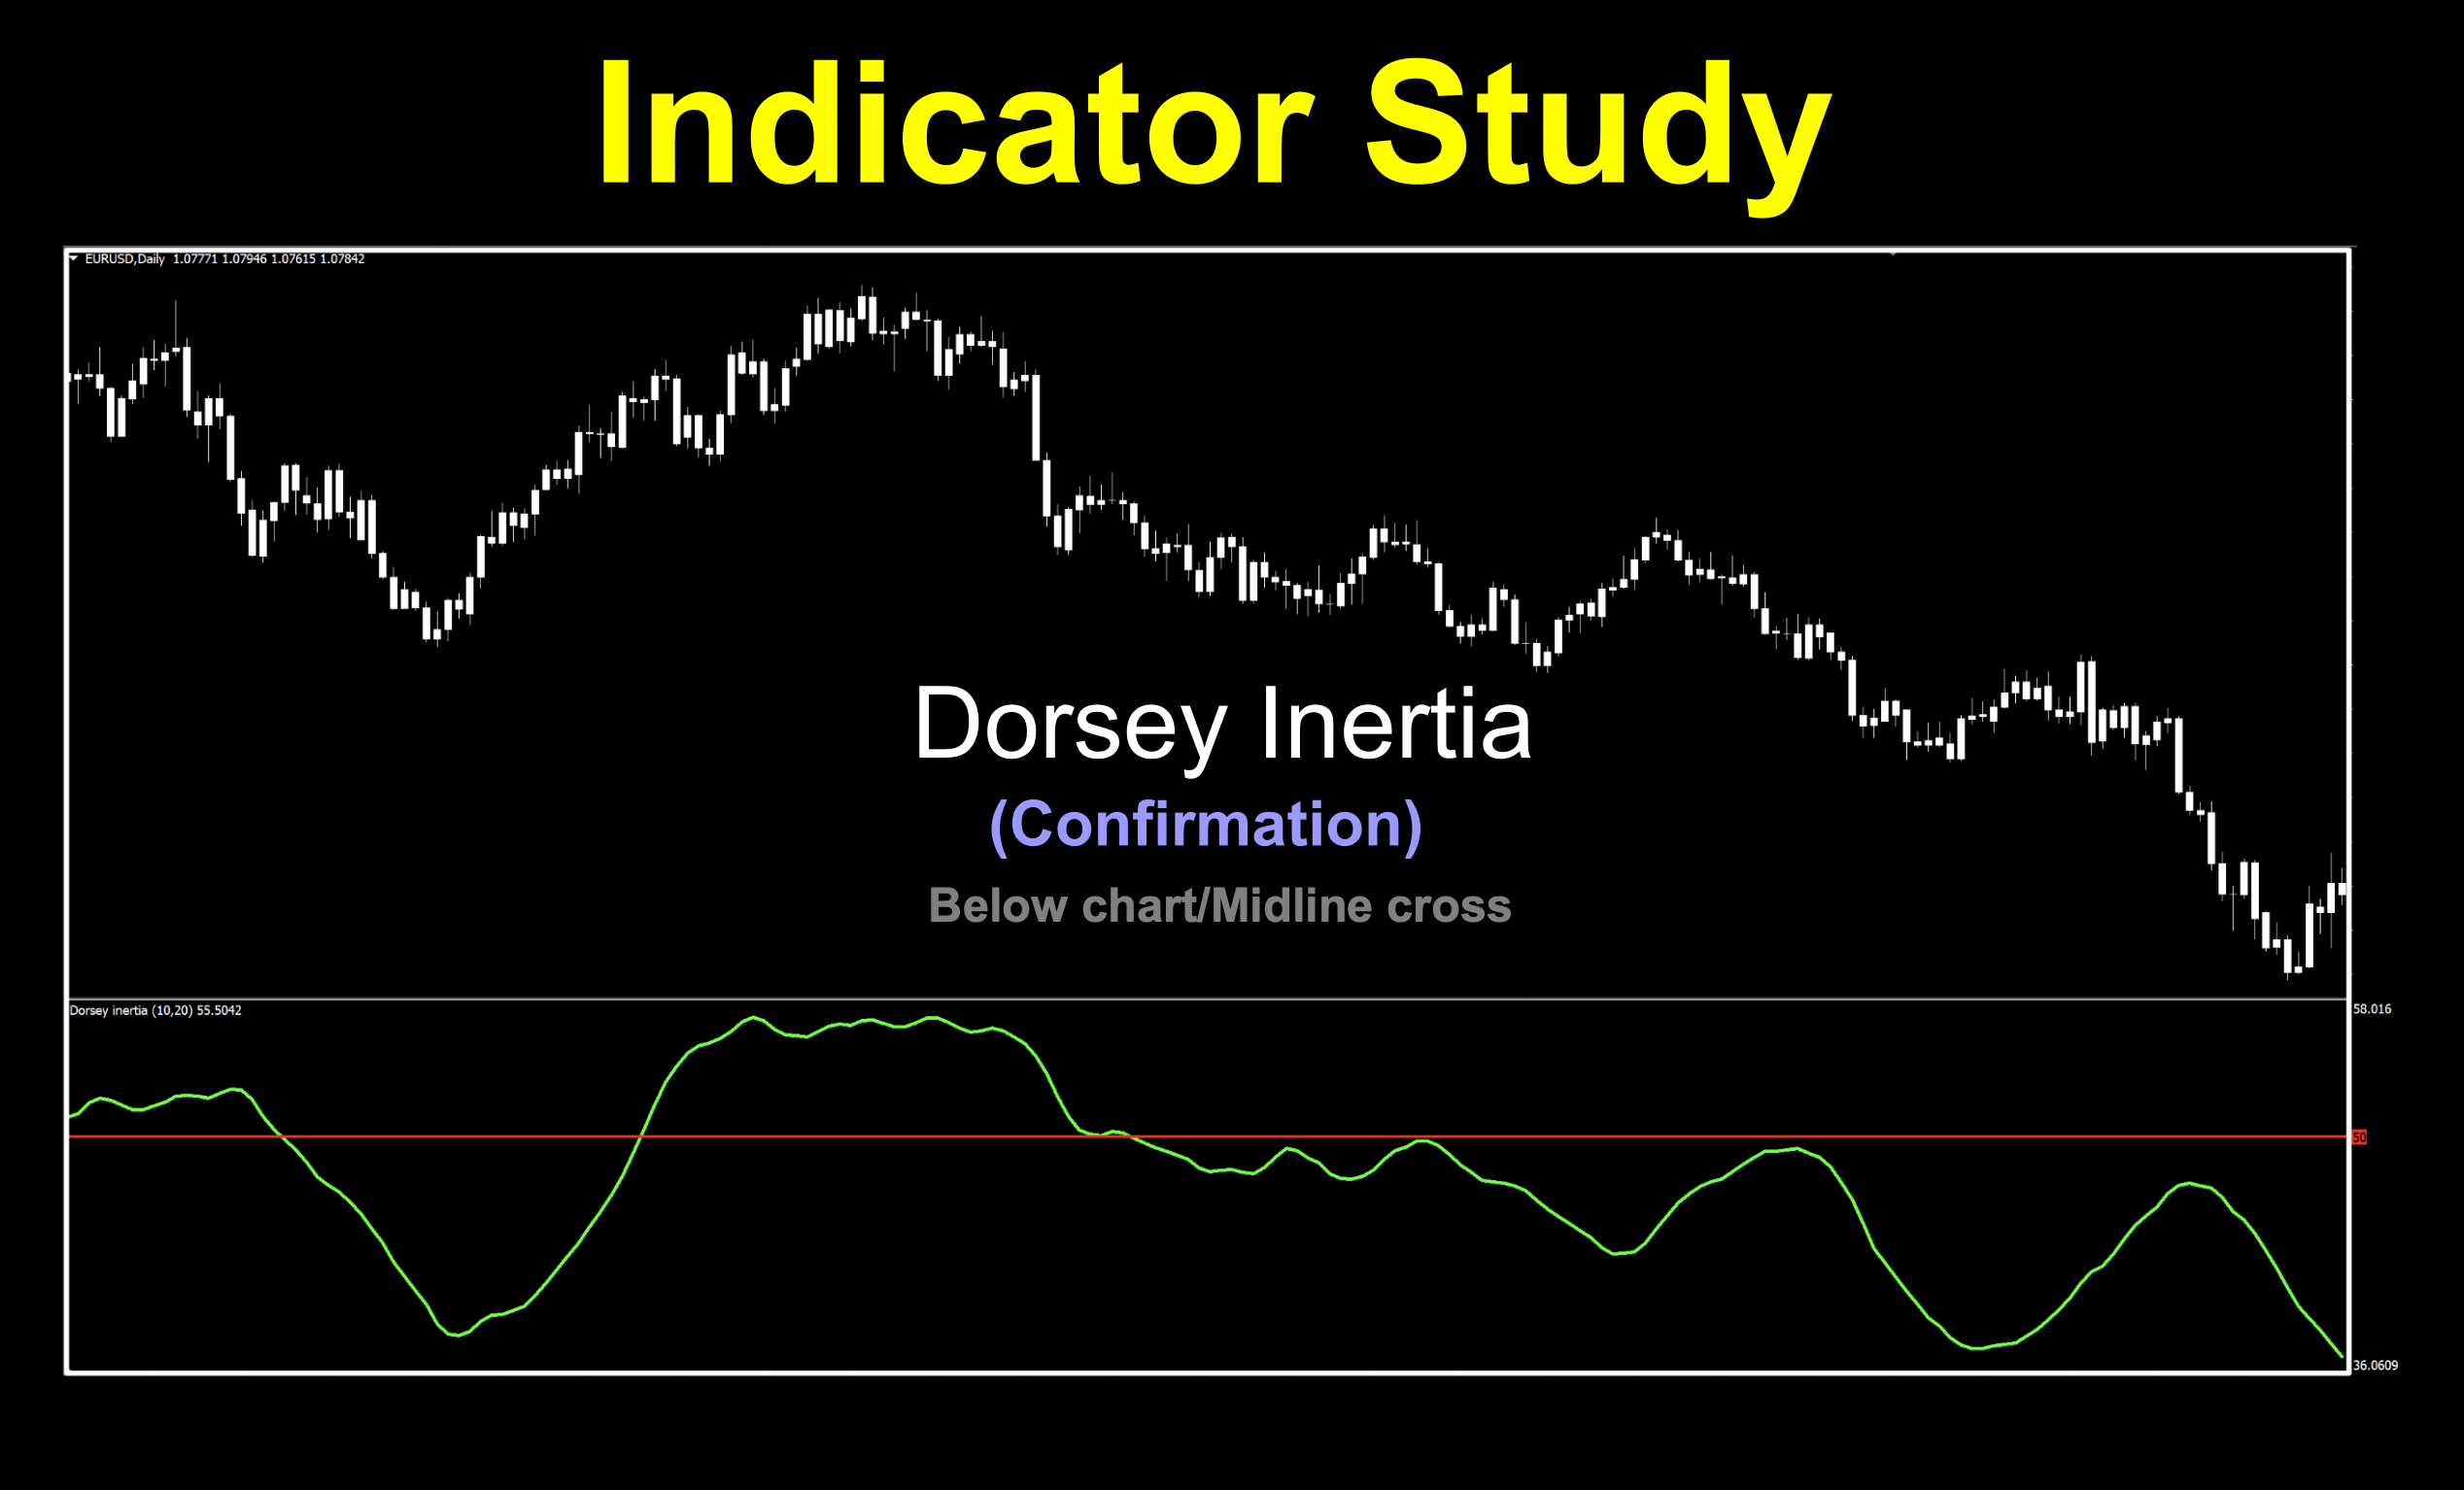
Let’s fast-forward even more, when a guy named Donald Dorsey took that idea of inertia and applied it to trading. He believed that inertia is a function of trend, and that it takes more energy to change (or reverse) a trend rather than let it continue in the same direction. That being the case, he came up with something called the Dorsey Inertia, which was introduced in the September 1995 article Stocks & Commodities magazine “Refining the Relative Volatility Index”. The indicator we’re using for our purposes was coded in 2019 for MT4.
Go Green
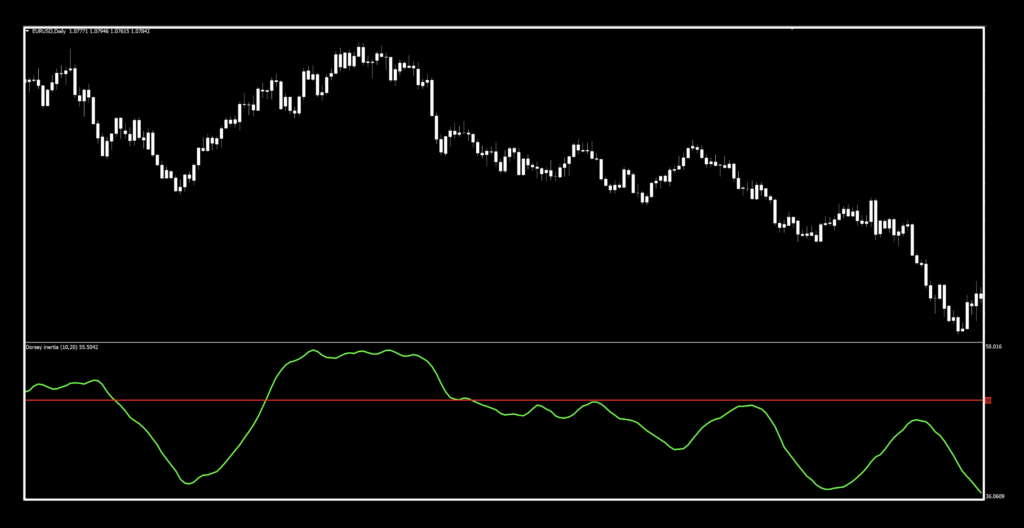
A simple midline cross, this C2 confirmation indicator has all the makings for a smooth and simple line. We just made it lime green, thickened it up and changed the mid-line to red for better visibility. Settings are on default and the candles were changed back to whitewall white for less distraction.
Settings
With three settings, you get pretty good control of the signal line.
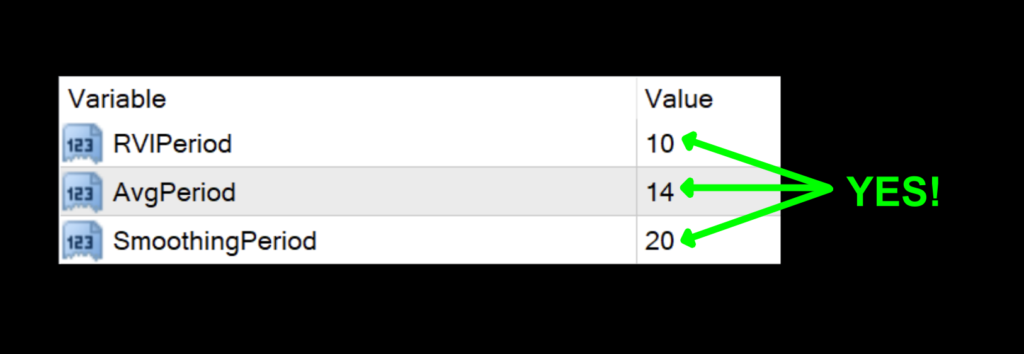
RVIPeriod: The look back length for the RVI smoothing function. The default value is 10.
AvgPeriod: This is the standard deviation length applied to the RVI. The default value is 14.
Smoothing Period: This is the “inertia” smoothing length. The default value is 20.
Advantages
* Decent degree of control through the three settings.
* Based on market price inertia, which represents volatility.
* Smooth signal line for a good C2 indicator.
How we use it.
One of three actions need to happen in the last 30 minutes prior to the close of the trading day. They are; opening, maintaining, or closing, a position. This is when you make your trading decisions, and not actually wait for the close at 1700 EST, because we trade on the daily time frame.
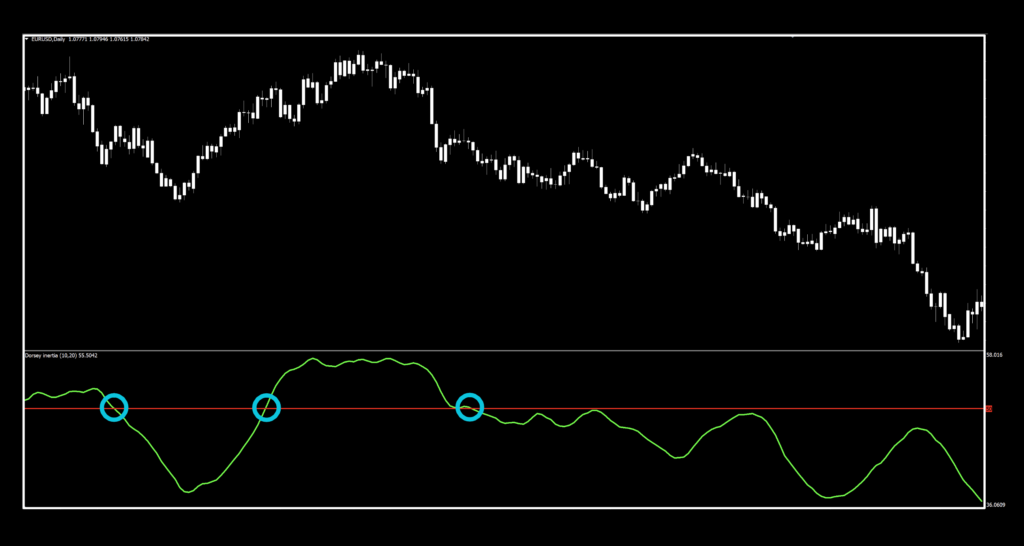
Long: Signal line crosses above the midline (50). Entry is in the last 30 minutes of the trading day.
Short: Signal line crosses below the midline (50). Entry is in the last 30 minutes of the trading day.
Easy Like Sunday Morning
The first thing that hits you right in the eyeballs is twofold. First being that it’s just so smooth, even on the default settings. The second is that there are very few signals. Of course, the entries, and exits are somewhat slow and a bit late. This confirmation indicator has the ability to keep you in a trade longer and weather excessive price volatility. Keep calm and trade on…
It’s all about the numbers
If you’re new to these studies, we recommend looking at some older blogs to understand how we conduct our testing.
For You, From Us
Below is the data from our testing.
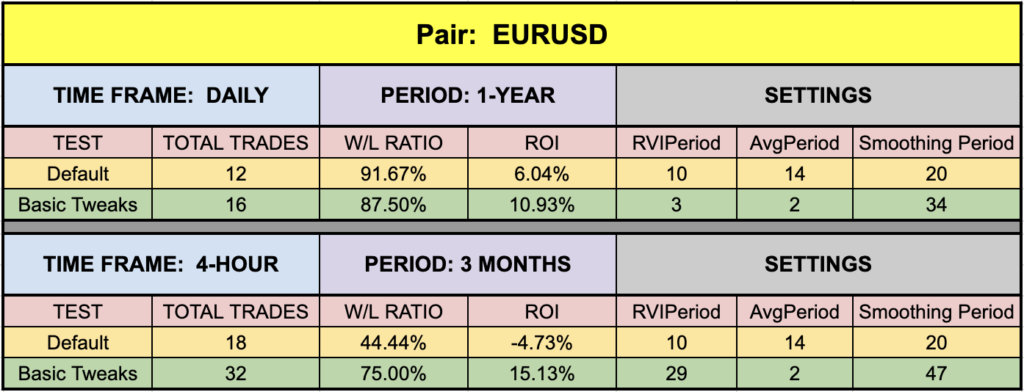
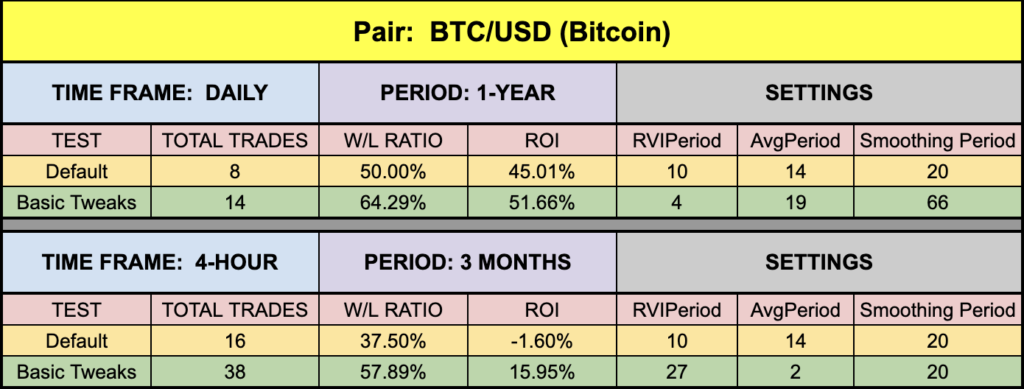
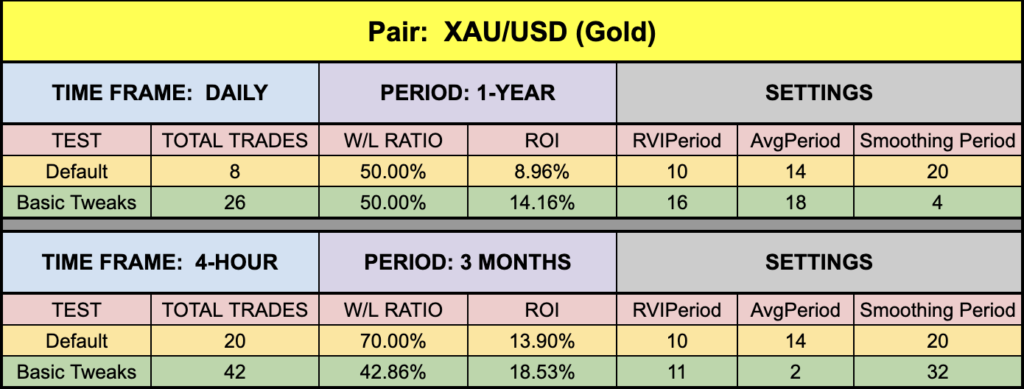
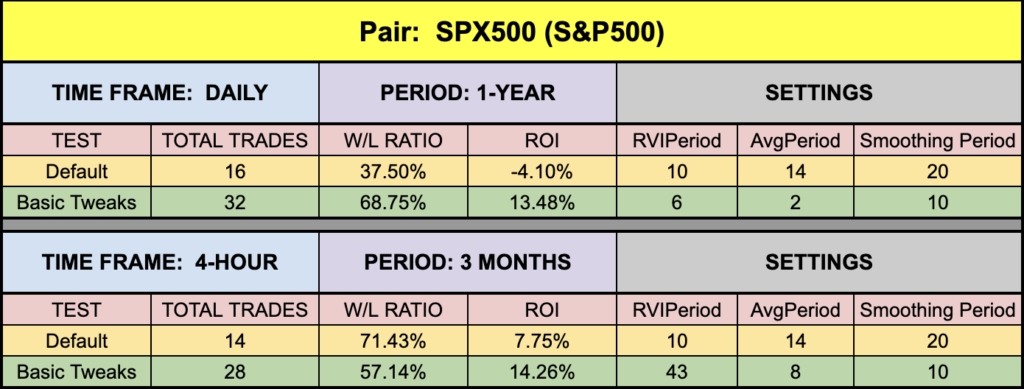
All in all, not bad numbers. We had some decent returns with default values, which is always a good thing. Testing this indicator with its three settings provides you with many opportunities for finding better results. We’re gonna address BTC’s crazy numbers next.
You So Crazy
The numbers we’ve been getting on XAU and BTC over the last few months have been a bit on the nutty side — specifically BTC. If you look at the past year, price was relatively range bound until late last October, when it took off and has created quite the power curve.
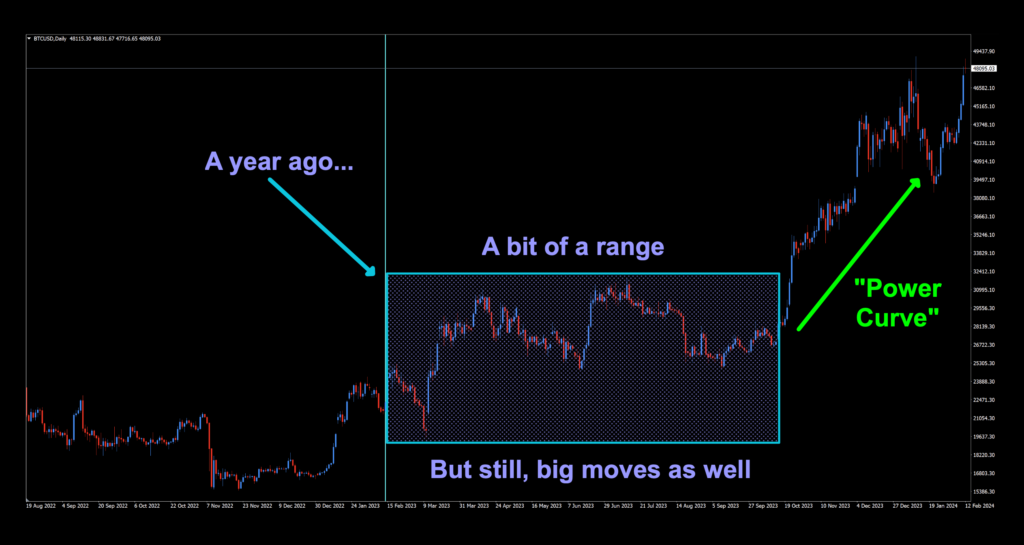
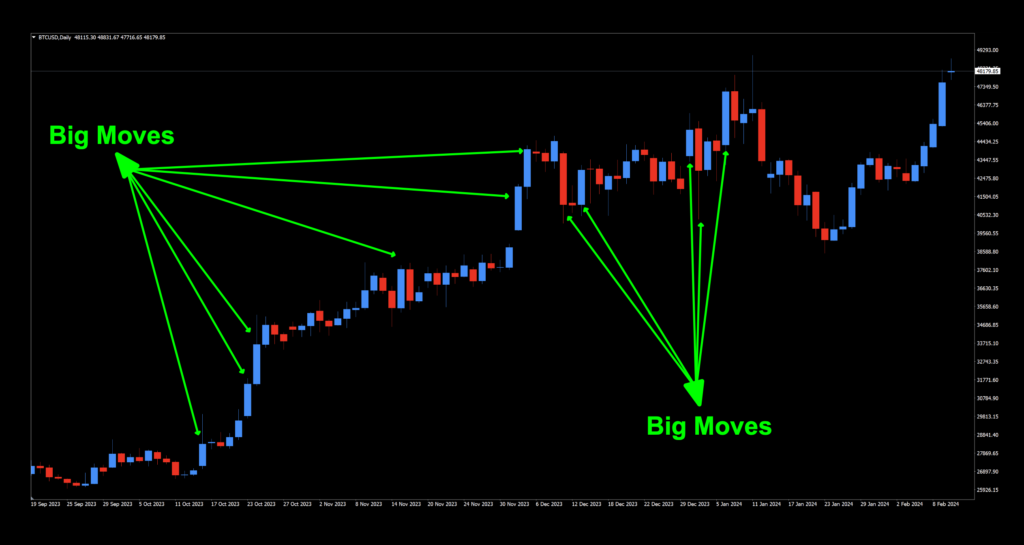
There were daily ranges of $2,200 to over $4,000, so what happens when we test it is that the most recent trades return massive profits, throwing the rest of the numbers a bit out of whack. Some trades had trailing stops amounting to many thousands of dollars. There’s nothing wrong with this, but just take a look at the chart below and note the price. It’s pretty self-explanatory.
Resources
You can find this indicator in the library for free. When you’re ready to get it, click HERE. Be sure to subscribe to the Stonehill Forex YouTube channel for the technical analysis videos. For the advanced course, click HERE.
Our only goal is to make you a better trader.
***Our published testing results are based on money management strategies employed by the NNFX system and depend on varying external factors, which may be different between individuals and their specific broker conditions. No guarantee, trading recommendations, or other market suggestions are implied. Your results and subsequent trading activities are solely your own responsibility.
BTW — Any information communicated by Stonehill Forex Limited is solely for educational purposes. The information contained within the courses and on the website neither constitutes investment advice nor a general recommendation on investments. It is not intended to be and should not be interpreted as investment advice or a general recommendation on investment. Any person who places trades, orders or makes other types of trades and investments etc. is responsible for their own investment decisions and does so at their own risk. It is recommended that any person taking investment decisions consults with an independent financial advisor. Stonehill Forex Limited training courses and blogs are for educational purposes only, not a financial advisory service, and does not give financial advice or make general recommendations on investment.