
If you’d like to follow along with the e-book version of the blog, click on the play button in the audio player below (at the bottom of the page).
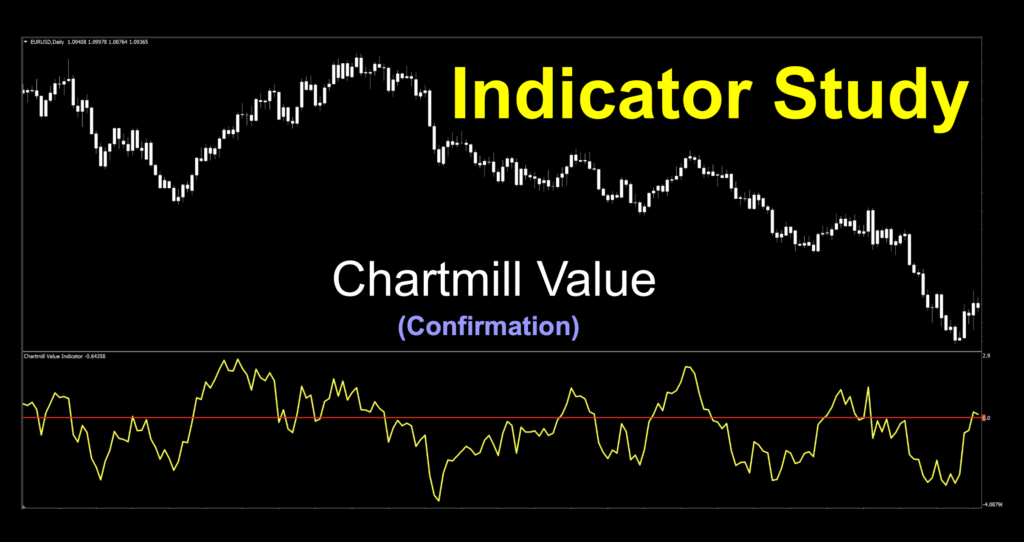
Chartmill Value
Don’t Confuse The Two
We’ve got an indicator this week which shares the same name as a stock screening service. Coincidentally, they involve the same guy. However, we’re bringing you just a single indicator and not a system from the site, although we suppose the indicator can be considered as a screener of sorts. After all, we’re all just filtering the market for buy and sell signals using math, rules, and zen…so enhance your calm, John Spartan.
Get Milling
There’s a guy named Dirk Vandycke, not to be confused with Dick Van Dyke from the Mary Poppins movie, although their last names are pronounced the same, and their first names are only a letter away from each other.

One guy holds multiple master’s degrees, writes market software focused on technical analysis, market dynamics, and behavioral finance and teaches at a Belgian University. The other guy is an actor who cleaned chimneys in a 1964 movie with a flying nanny.
Say Cheese
For the technical analysis video, we’ll load this one up on our trusty charts and see how it does. Since we’re still down under, somewhere in New Zealand, we’ll use the AUD/NZD chart again, because, why not? So, grab a Fosters or perhaps a Speight’s if you’re partial to a Kiwi brew, dim the lights, and relax for a few minutes.
The former guy mentioned developed an indicator called the Chartmill Value (Indicator) which was featured in a 2013 issue of Technical Analysis of Stocks & Commodities Magazine. It came to us as an MT4 tool in 2020, so thank you for that.
Do A Math
Surprisingly, the calculations are rather simple.
CVI = (Close-VC)/ATR
And This is Helpful, Why?
First off, it’s an oscillator. That means it cycles between two boundaries. Unlike many other oscillators, this uses a “statistical normalization procedure” which prevents it from getting stuck to the upper or lower boundaries for an extended amount of time. And, it isn’t subjected to lag like many indicators which depend on moving averages as part of their overall calculations. Yay.
Fairly Untouched
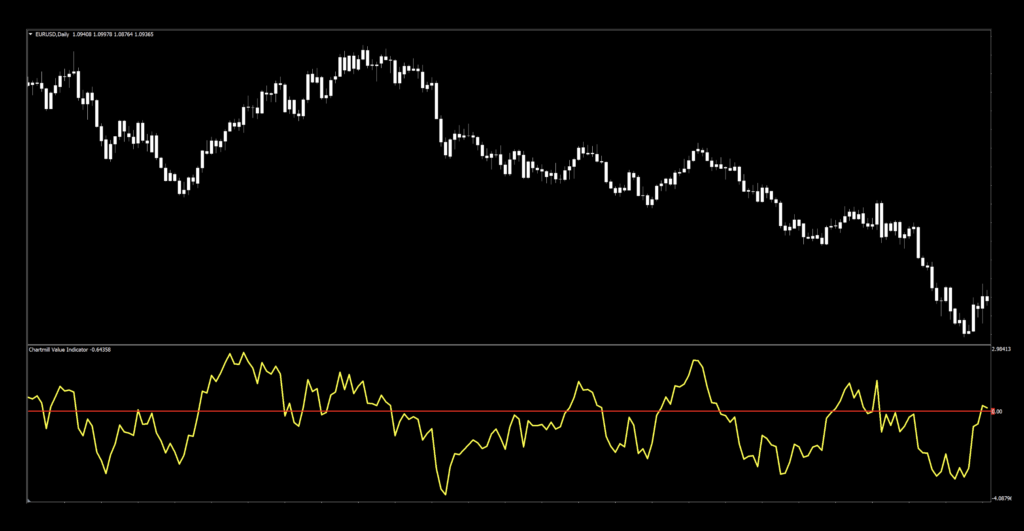
We only had to make minor changes to the stock image of the indicator. Just thickening up the signal line and adding the zero line. Candles were left a lighter shade of pale.
Additional Observation
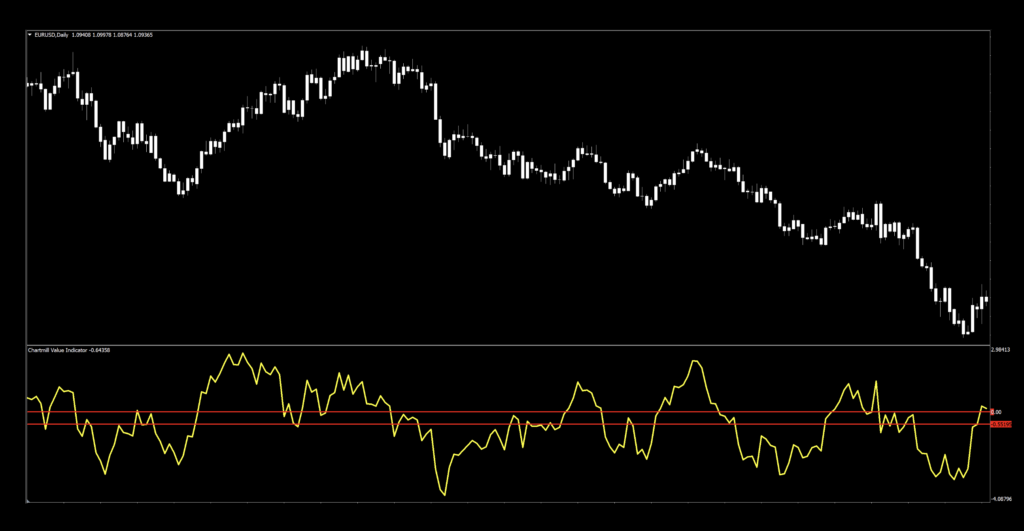
Many times we use mid-line or a zero-line interchangeably. What if there was a difference? One of the first things we noticed was that the boundary values changed over time. That means zero always remains the same, but the mid-line is actually the average of the two lines. If we were to use this indicator as a true mid-line cross, using the current boundary values, the mid-line is a bit under the zero line…like this.
Does it make a difference? It might…but, it gets a little “dirty” here. Because the boundaries change dynamically, you would need to update your mid-line every so often. So that being the case, we compared the mid-line value using the most current boundary values to those from the left side of the chart. Here’s what we came up with.
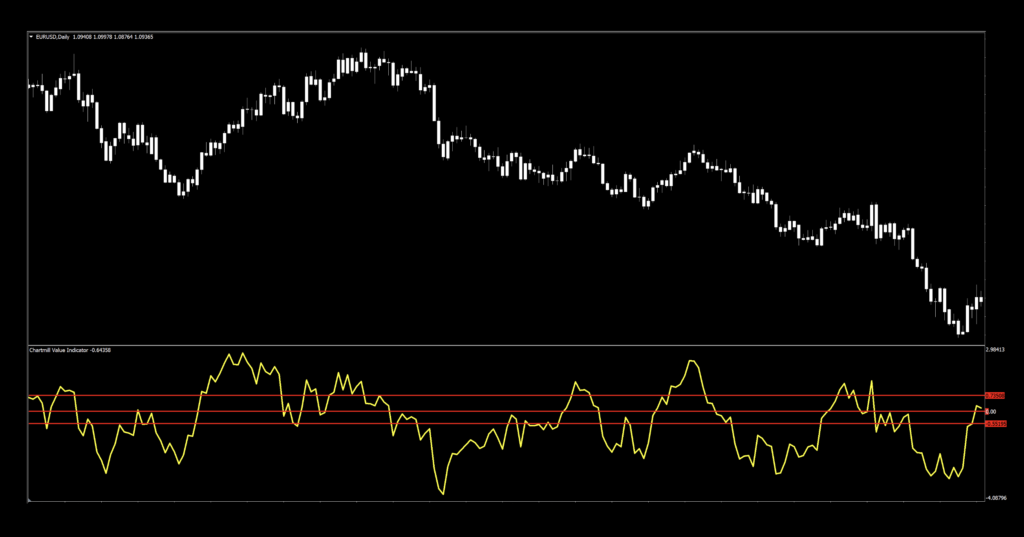
What do we see now? Yep, signals change. So, what should we do? That’s where our collective strengths are. Sure, you could use this indicator as the author intended as an overbought/oversold indicator by assigning the overbought and oversold levels, but we advocate thinking outside the box. Mark it up various ways. See what works best for YOU.
What?
You thought you wouldn’t have to put any work in? That’s the difference between us and “them”. There is no magic pill to become a successful trader. Why do you think the majority of those who get into this game, fail? Don’t be part of that majority. That’s what sets us apart.
Settings
There are a few settings that we really don’t need to concern ourselves with. There are only two which we actually need for the indicator.
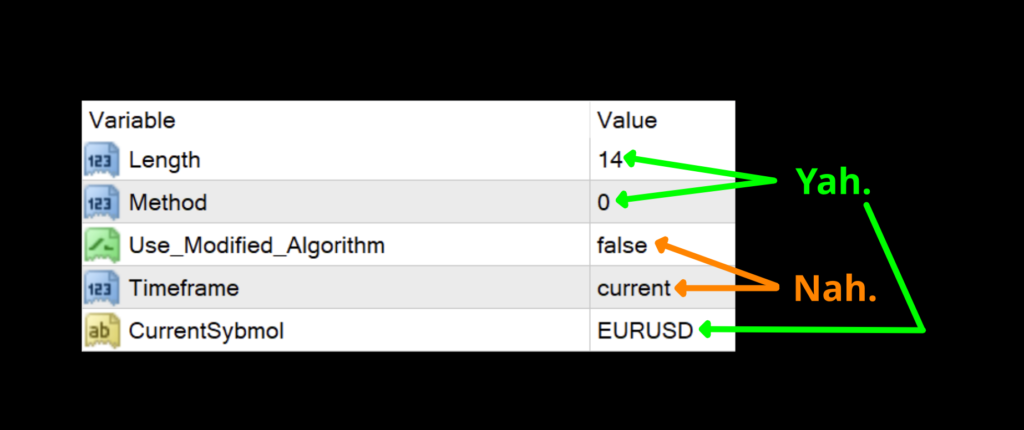
Length: Number of periods. The default value is 14.
Method: The type of moving average used where 0 = SMA, 1 = EMA, 2 = SMMA, and 3 = LWMA. The default value is 0 = SMA.
CurrentSybmol: The symbol of the chart you want to place the indicator. The default value is EURUSD, but you need to change it to whatever you’re looking at. Inconvenient, but necessary. Don’t blame us, blame the original coder.
Advantages
* Created by a guy who is actually in the business
* Doesn’t rely on moving average lag.
* Easy to test.
How we use it.
One of three actions need to happen in the last 30 minutes prior to the close of the trading day. They are; opening, maintaining, or closing, a position. This is when you make your trading decisions, and not actually wait for the close at 1700 EST, because we trade on the daily time frame.
Long: When price crosses above the mid-line/zero line. Entry is in the last 30 minutes of the trading day.
Short: When price crosses below the mid-line/zero line. Entry is in the last 30 minutes of the trading day.
Keeping it Simple
We’re going to keep things simple in the interest of time and just use it as a zero cross. But hey, don’t be bashful about trying it other ways. We applaud your efforts!
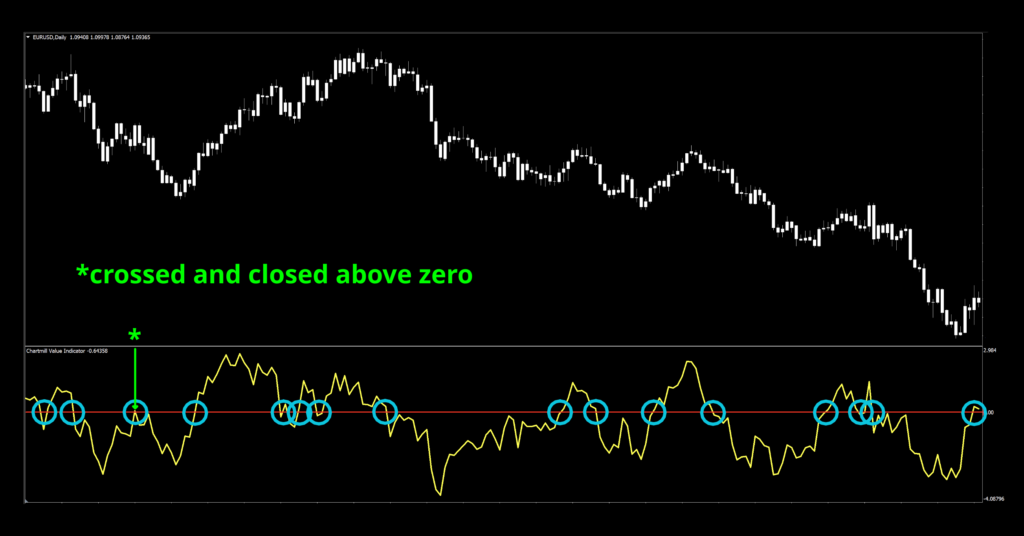
The first thing we noticed was how quick it was. The reactivity to price action might dictate this as a good C1 indicator and possibly an exit indicator as well. Naturally, you’ll want to tweak the settings to see how it does with the rest of your algo. Always be aware of multiple crossings. A good baseline and C2 would have kept you out of many of those mediocre signals.
Down With The Data
If you’re new to these studies, we recommend looking at some older blogs to understand how we conduct our testing. We’re going to be using our alternative numbers.
Number Number, So Good For Me
Below is the data from our testing.
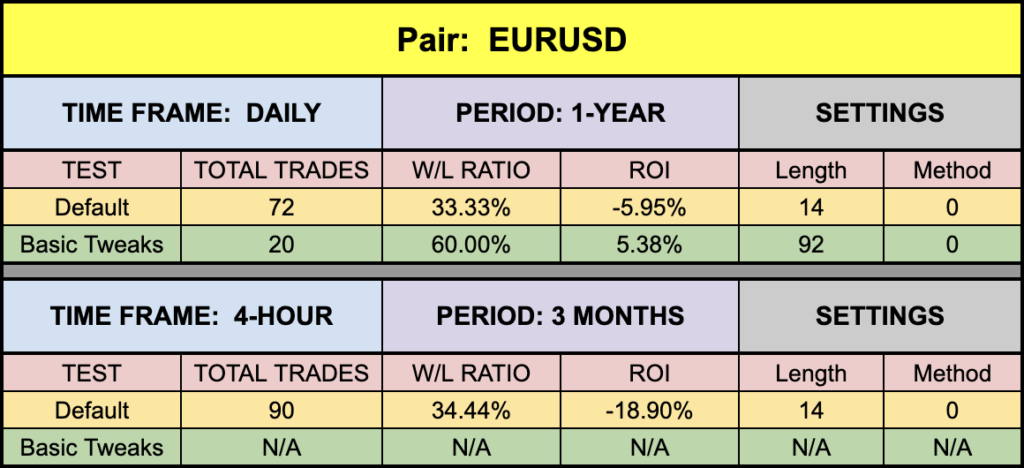
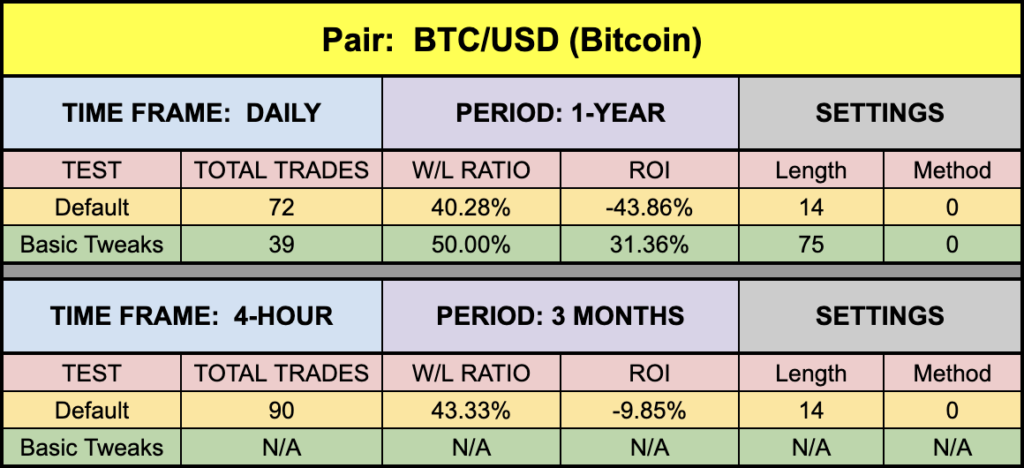
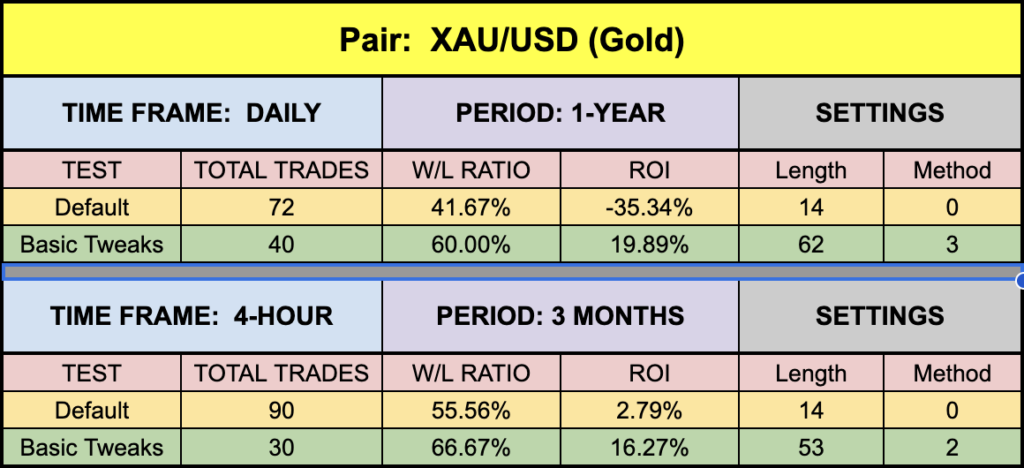
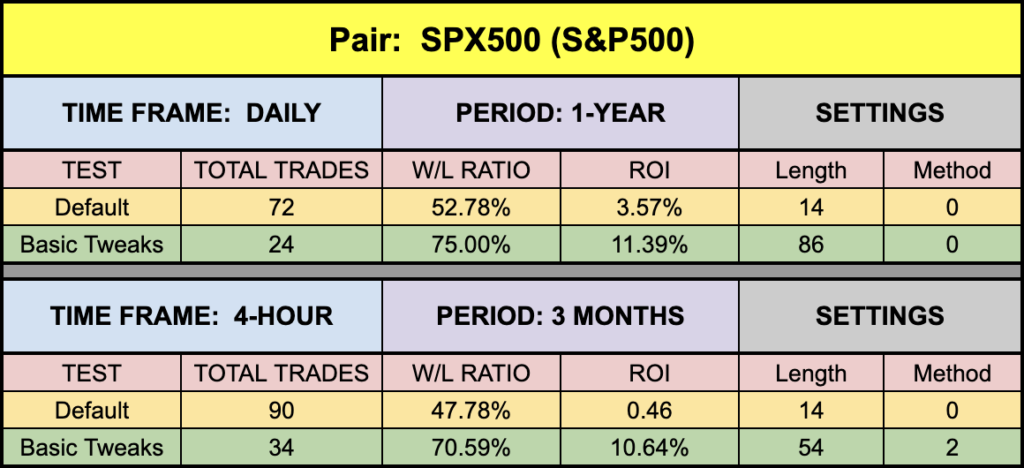
Very interesting numbers. 4-hour traders were out of luck on the EUR and BTC during the time span we tested, but the rest of the numbers were pretty good. Naturally, longer Length settings slowed the signals down, but you’ve got to be careful not to slow it down so much that you miss good signals. Daily XAU and BTC returned solid numbers, meaning that it is definitely worth your time to explore this indicator.
Resources
We’ve made this indicator available for download on our site from the indicator library, for free! When you’re ready to get it, click HERE. For the advanced course, click HERE.
Our only goal is to make you a better trader.
*Our published testing results are based on money management strategies employed by the NNFX system and depend on varying external factors, which may be different between individuals and their specific broker conditions. No guarantee, trading recommendations, or other market suggestions are implied. Your results and subsequent trading activities are solely your own responsibility.
BTW – Any information communicated by Stonehill Forex Limited is solely for educational purposes. The information contained within the courses and on the website neither constitutes investment advice nor a general recommendation on investments. It is not intended to be and should not be interpreted as investment advice or a general recommendation on investment. Any person who places trades, orders or makes other types of trades and investments etc. is responsible for their own investment decisions and does so at their own risk. It is recommended that any person taking investment decisions consults with an independent financial advisor. Stonehill Forex Limited training courses and blogs are for educational purposes only, not a financial advisory service, and does not give financial advice or make general recommendations on investment.