
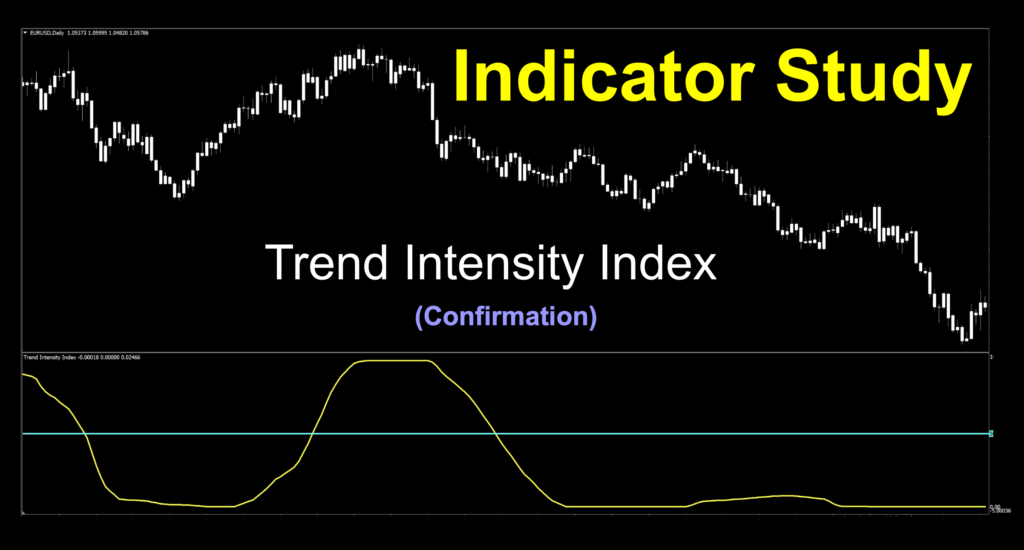
Trend Intensity Index
If you’d like to follow along with the e-book version of the blog, click on the play button in the audio player below (at the bottom of the page).
 So Intense
As a play on words, this week’s indicator has a title so profound, we cleared away our collective desks and engaged in a somewhat protracted conversation. Should we savor this one and save it for a holiday gift to the masses, or should we just roll it out now and bask in its light? While we do occasionally hold back a few things, we ultimately decided to get it out to you sooner than later. We were pretty excited to have brought it to the front of the line. We’re hoping you’ll feel the same way.
Enthusiastic Approach
When we found this indicator, we immediately set out to record the market before it closed for the weekend. In our haste, we neglected to make a change in the visuals, so we’ll be recording it at the open of the market Sunday afternoon. Ah, well…but, it would have worked, although we wanted to demonstrate it the way we use it. It might not be much by way of visual change, but it makes a difference to us. Any ways, sit back in your favorite chair, dim the lights and let us get the party started with the technical analysis video. We’ll see you after the show.
In Through the Out Door
We’ve got to hand it to you. Your continued support does not go unnoticed. We’ve got indicators, additional advice from our friend, Niels – and so much more. Keep on keeping on, we love it. Send your brilliant proposals to stonehillindicator@gmail.com, and as always, thank you.
Intensify Your Calm
Enough beating around the bush. We found an indicator called Trend Intensity Index, which was developed by someone whom we’ve highlighted before. That gentleman’s name is M. H. Pee. We looked at his indicator called the Trend Continuation in December 2022, so he’s no stranger to us. You can check out that confirmation indicator HERE. Who knows, these could be your C1 and C2 twins of terror. This week’s tool was developed and showcased in the June 2002 issue of Stocks and Commodities Magazine. We’ve got a little backstory information we’ll give you before getting into the rest of it.
What’s It All About
The overall premise is based on the notion that the stronger the trend, the more likely the market will continue moving in that direction, and is calculated on “major” and “minor” periods. The default 30 and 60 periods were simple moving averages in the original version, but we have some good news, which we’ll talk about in the settings.
More Explanations
Once the 60 period simple moving average was computed, the deviation between the closing price and the computed average for each of the last 30 periods was computed. Positive deviations are summed to give one value. Negative deviations are summed to give another value. Then, the index is calculated.
Mid-Line Raves
Now, originally this indicator started out as yet another overbought/oversold oscillator, but we don’t really like those. Too much ambiguity. We like definitive signals. So, we made this confirmation indicator into a mid-line cross, which you’ll soon see. For the slide rule gang, here are the calculations, courtesy of Mr. Pee.
Step 1: TII = 100 * (SDPOS) / (SDPOS + SDNEG)
Step 2: SDPOS = Sum of Up Deviations Over Minor Period (CL – MA)
Step 3: SDNEG = Sum of Down Deviations Over Minor Period (MA – CL)
The summed deviations represent the sum of the absolute differences between the price and the average price (over the major period). If price is higher than the average, it’s considered an up deviation and the signal line appears on the north side of the mid-line. If price is lower than the average, it’s considered a down deviation and the signal line appears on the south side of the mid-line. Easy-peasy, right?
Triple Distraction
We’re going to put up the chart with default settings, so you see what you’re going to get out of the box. We only made the lines thicker for better visibility because initially, it was difficult to see. Then, we’ll make our adjustments with a short explanation of what we did. Since this is a below chart indicator, we’ll make the candles a fetching vanilla white. So now, out of the box.
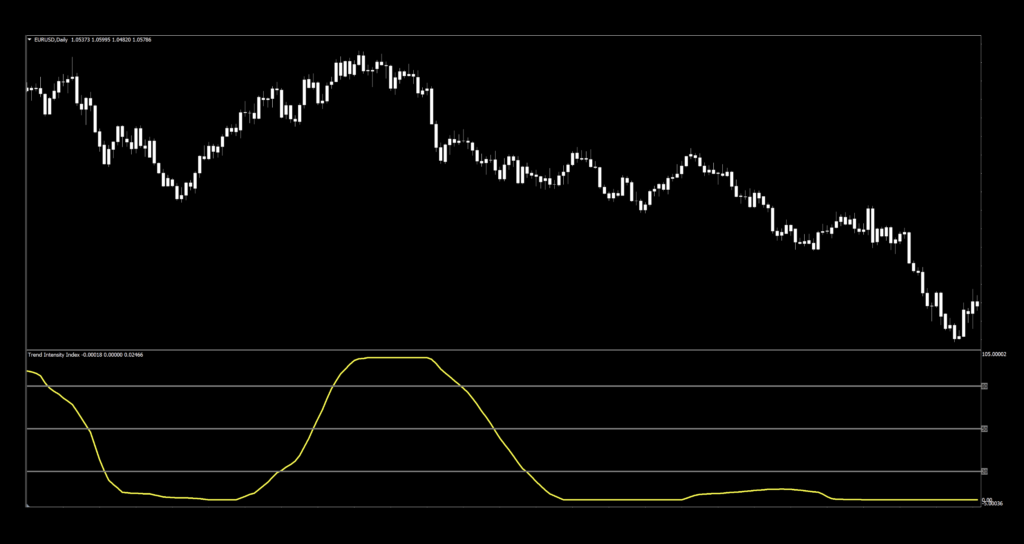
Lines, They Are A Changing
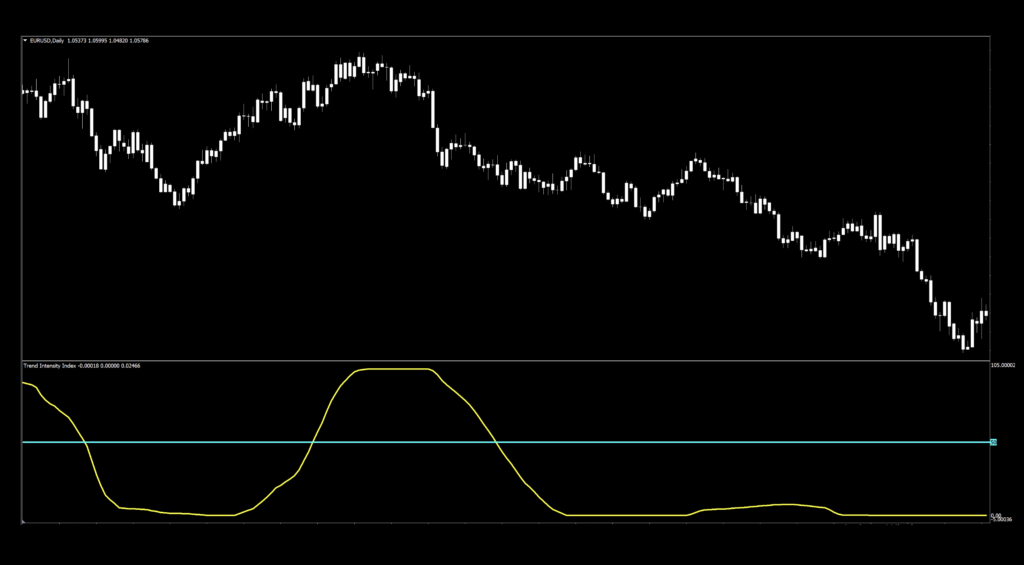
The first thing we’re going to do in the settings menu “Input tab” is change the OB/OS lines to 50.0, thicken the line from 1 to 3, and change the color from boring gray to exciting aqua.
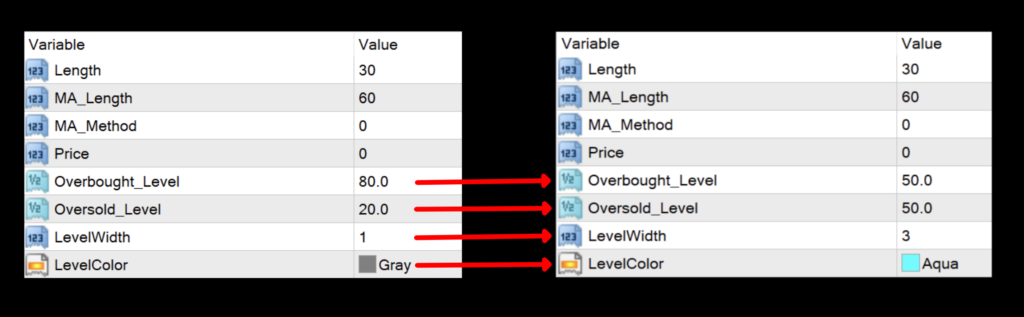
Then you can click the “Okay” tab to affect those changes. You could try deleting them from the levels menu, but we noticed they kept magically reappearing, so we just changed them. Now we’ve got something more appealing, simple to use and easier for signal identification. This is also how we’re going to record our video for the technical analysis portion of the blog.
Settings
Now, we’ll talk about the four settings we are keen to explore and explain.
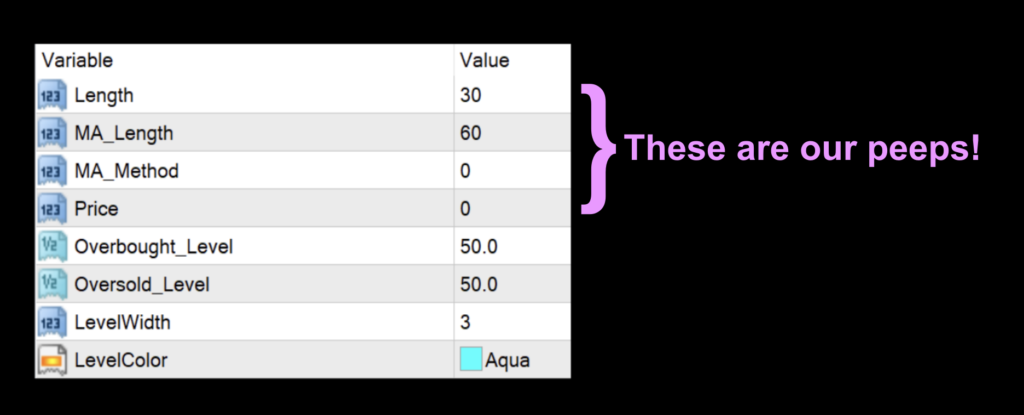
Length: The “minor” length for the internal calculations. The default value is 30.
MA_Length: The “major” moving average length. The default setting is 60.
MA_Method: These are the types of moving average lines. 0 – Simple, 1 – Exponential, 2 – Smoothed, and 3 – Linear Weighted. The default setting is 0 – Simple.
Price: These are the pricing data sets. 0 – Close, 1 – Open, 2 – High, 3 – Low, 4 – Median, 5 – Typical, and 6 – Weighted. The default setting is 0 – Close.
Not So Simple
When we explained how the indicator worked earlier in the blog, moving averages were of the simple kind, and we *assume* it uses closed prices, since this originally was applied on the daily chart back in the day when most prices were reported at the close of the trading day, hence the use of closed pricing data. You’ll notice that we now have three more sets of moving average calculations and six more sets of price data available to us for a plethora of possibilities. Awesome sauce!
Advantages
* Based on the work of a distinguished developer.
* Easy to identify signals.
* Plenty of variables for effective tweaks.
How we use it.
To clarify specific concepts relating to the NNFX system. There are three possible trade actions;
OPENING A TRADE
CLOSING A TRADE
MAINTAINING A TRADE
One of these three actions need to happen in the last 30 minutes prior to the close. This is when you make your trading decisions, and not actually wait for the close at 1700 EST, because we trade on the daily time frame.
Long signal: When the signal line crosses above the mid-line. Entry is in the last 30 minutes of the trading day.
Short signal: When the signal line crosses below the mid-line. Entry is in the last 30 minutes of the trading day.
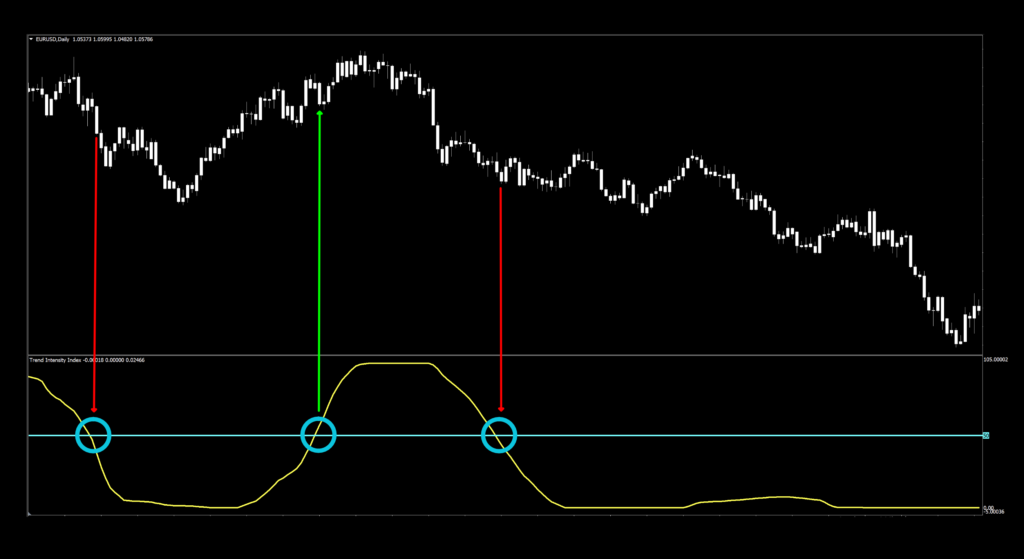
Looks…Boring
Initially, we were somewhat underwhelmed. However, 30 and 60 period moving averages are pretty long, no matter what time frame you’re looking at, which resulted in only three signals. Totally cool because at least two of them would have resulted in a heck of a trade. But wait, stay with us…it gets better. Let’s go testing, shall we?
Testing Fun & Games
If you’re new to these studies, we recommend looking at some of the older blogs to understand how we conduct our testing.
The six pairs we recommend testing are…
EUR/USD
AUD/NZD
EUR/GBP
AUD/CAD
CHF/JPY
CAD/SGD
The markets we test our indicators are the:
EUR/USD (Euro/US Dollar)
BTC/USD (Bitcoin/US Dollar)
XAU/USD (Gold/US Dollar)
SPX500 (S&P500 Index)
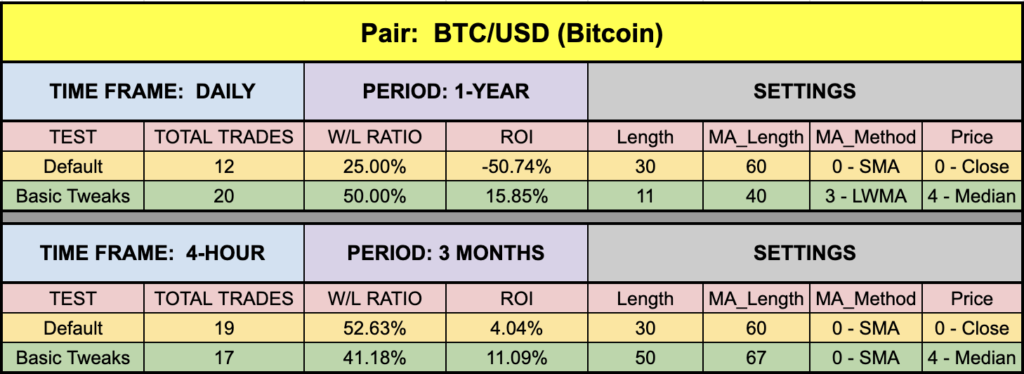
Timeframes and Results
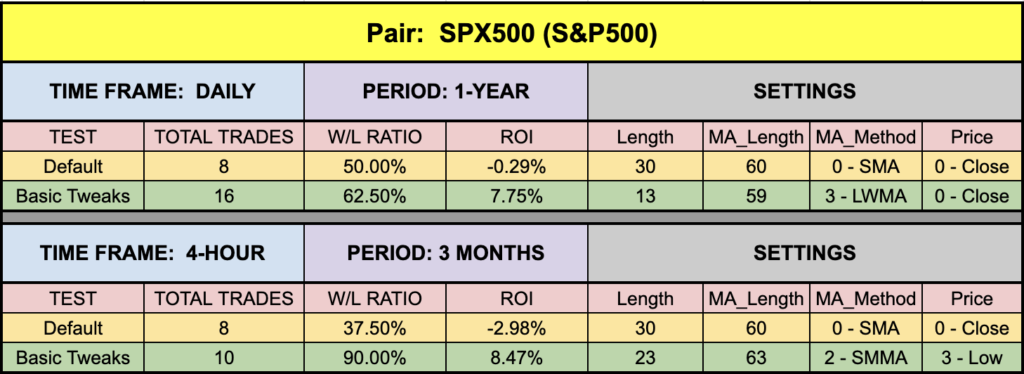
We’ll run the Trend Intensity Index indicator on the EUR/USD, BTC/USD, XAU/USD, and the SPX500 using the default and tweaked settings across the daily and 4-hour timeframes on the MT4 strategy tester.
We focus on three metrics;
Total trades
Win/Loss ratio
ROI (return on investment)
Results To Consider
Below are the results from our testing adventures.
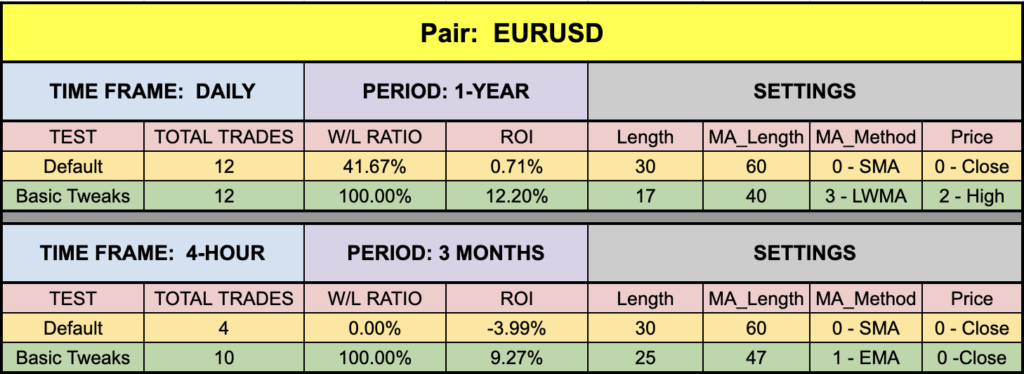
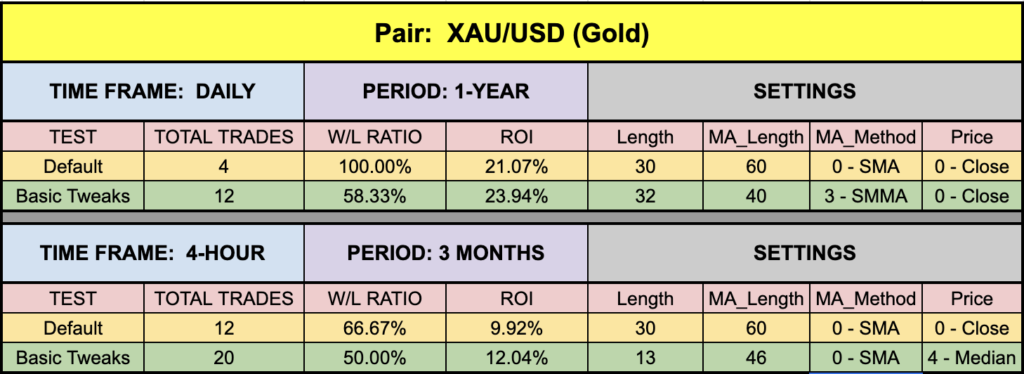
Pink Elephant
Okay, we’re with you. After glossing over these results, the EUR and XAU numbers are just a little difficult to believe. We’re skeptics by nature, so we tested this…many times. The numbers are the numbers. We don’t cherry-pick charts, trades, settings, or indicators. We test what we get, and we get what we test. Now, go forth and download this little gem and get busy with your own testing.
Money Management
Money management is based on the NNFX risk profile. That information can be learned in the Advanced Course.
Resources
We’ve made the Trend Intensity Index indicator available for download on our site from the indicator library, for free. When you’re ready to get it, click HERE.
We’re Here For You
Make sure you’re signed up for the latest digests. If you missed the last one, be sure to sign up on the website and email dan@stonehillforex.com with the title “Latest Digest Please” and we’ll send the most recent one off to you within 24 hours.
Other Resources
And you’ll want to subscribe to our YouTube channel for the technical analysis videos which pair well with these blogs…like chips and dip. Don’t forget Facebook and Quora, where we answer questions relating to Forex.
Our only goal is to make you a better trader.
BTW – Any information communicated by Stonehill Forex Limited is solely for educational purposes. The information contained within the courses and on the website neither constitutes investment advice nor a general recommendation on investments. It is not intended to be and should not be interpreted as investment advice or a general recommendation on investment. Any person who places trades, orders or makes other types of trades and investments etc. is responsible for their own investment decisions and does so at their own risk. It is recommended that any person taking investment decisions consults with an independent financial advisor. Stonehill Forex Limited training courses and blogs are for educational purposes only, not a financial advisory service, and does not give financial advice or make general recommendations on investment.