
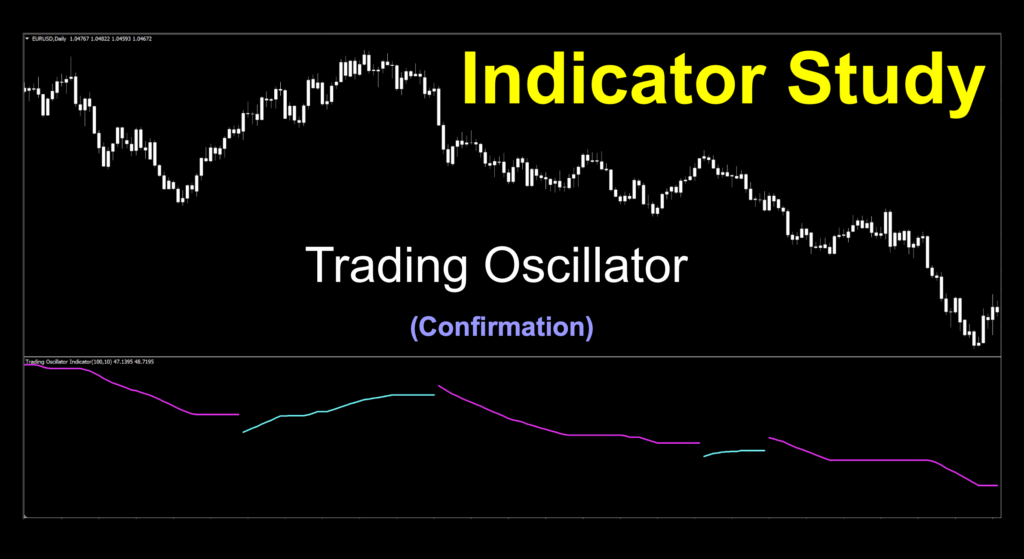
Trading Oscillator
If you’d like to follow along with the e-book version of the blog, click on the play button in the audio player below (at the bottom of the page).
It’s All in the Name
A name is something that can draw you in or push you away. During our adventures in indicator hunting, some names just don’t sound appealing, which can subconsciously bias us to even looking at what it can offer us. I mean, “Uj3-boogity” makes me wonder what kind of joker decided to put that indicator up, and if I should trust them. Granted, we go back and look at everything, but the ones which catch our eyes first contain certain words to let us know the coder was more interested in getting their work out, rather than coming up with a goofy name for it.
Something About Those Lines
We were pleased with this week’s recording. Everything worked, we got great signals, and the indicator itself was an easy one to watch. We did make a few small adjustments; which is par for the course, but we think you’ll fancy watching this one. Grab a drink, settle back and enjoy this. We think you’ll like it.
Wow, Lots Going On
Our inbox was crackling with quite a few emails this past week. We received indicators, questions, ideas and even a couple of compliments. Thank you all who took the time to share. It’s a testament to the willingness of those who have resources, also have a collaborative spirit, and that goes a long way. Many new and newer traders look for a place to learn, and we strive to provide that place. Your contributions help others find a safe and informative setting to learn. We appreciate that. Please continue to send your bountiful suggestions to stonehillindicator@gmail.com, and thanks for the effort.
Trading as a Way of Life
As we alluded in the title of this indicator, its name is Trading Oscillator. Simple, and to the point, meaning what it’s for and how it gets there, although the way we use it doesn’t really qualify it as an oscillator, but we’ll get to that shortly. There was very little information of this RSI derivative indicator created in 2020 by a coder; however, we definitely appreciate their efforts. After all, no matter how we get to the end goal of pocketing pips, we always value those who share their skills for the greater good.
Days of Yore
The RSI in its original form was developed back in 1978 by J. Welles Wilder Jr. and introduced in his book, New Concepts in Technical Trading Systems. It was defined as a momentum indicator and traders used it to try and predict overbought and oversold conditions, a concept which attempts to interpret the minds and hearts of what traders’ inclinations were. We, as technical traders, don’t swim in that pool, so we’ll just stick to what we see on the charts. There wasn’t a lot of tweaking available in the original version, and it ascribed a somewhat jagged line, leading to excessive signals. As in other profiled indicators, we found an updated version, and that’s great for us. Let’s explore.
Cool Beans
We put up the default view with a couple of minor adjustments. We’re going to remove one of the components we felt muddied the view, and we’ll get to that. The original signal lines were light blue and “tomato”, so we brightened them up with different versions of blue and red for better visibility. Candles were left a bonny winter white for centering your observation on the study material.
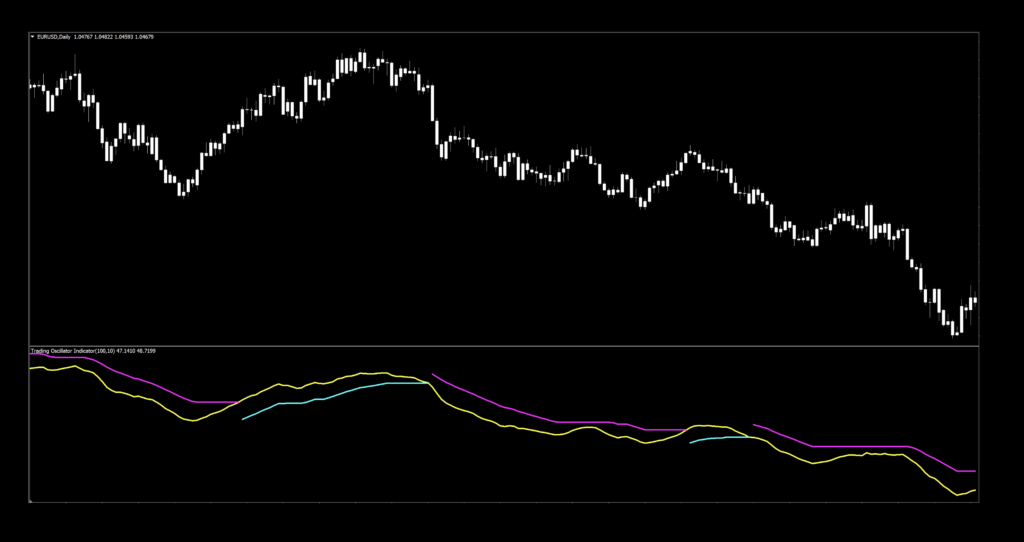
Tie a Yellow Ribbon
The only other adjustment we’re making to the display is removing the yellow line. We felt it was not helpful and just obstructed the view. A cleaner view, like this.
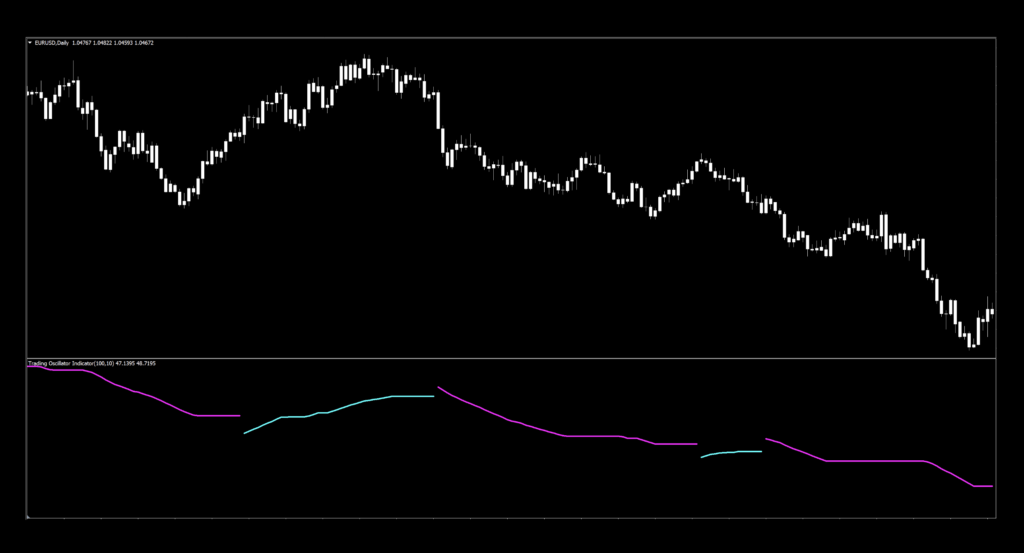
So now, it really becomes a color change confirmation indicator. No guessing.
Settings
This indicator has three settings, and they look like a band of brothers on the default setting.
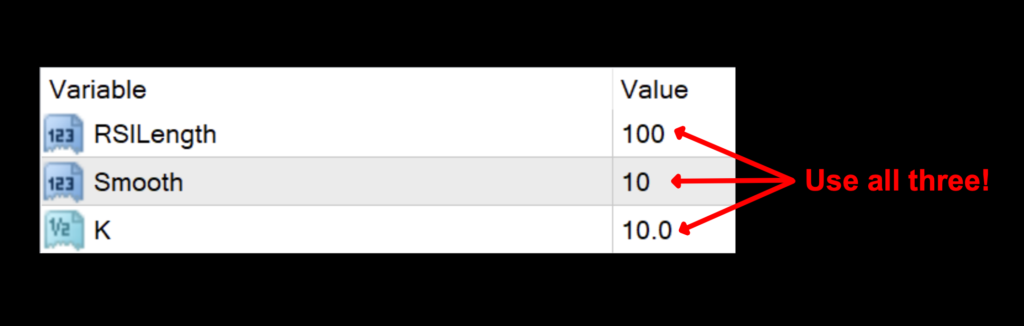
RSILength: The central number for the signal calculations. The default value is 100. Interestingly, the default value for old school RSI is 10.
Smooth: A smoothing filter to help remove some of the peaks and valleys. The higher value, the smoother the lines, and the default value is 10.
K: This setting appears to increase and decrease the sensitivity. More signals are generated with lower values, and the default value is 10.0.
Advantages
* Based on a well known indicator.
* Easy to identify signals.
* Enough variables for effective tweaks.
How we use it.
To clarify specific concepts relating to the NNFX system. There are three possible trade actions;
OPENING A TRADE
CLOSING A TRADE
MAINTAINING A TRADE
One of these three actions need to happen in the last 30 minutes prior to the close. This is when you make your trading decisions, and not actually wait for the close at 1700 EST, because we trade on the daily time frame.
Long signal: When the blue line appears. Entry is in the last 30 minutes of the trading day.
Short signal: When the red line appears. Entry is in the last 30 minutes of the trading day.
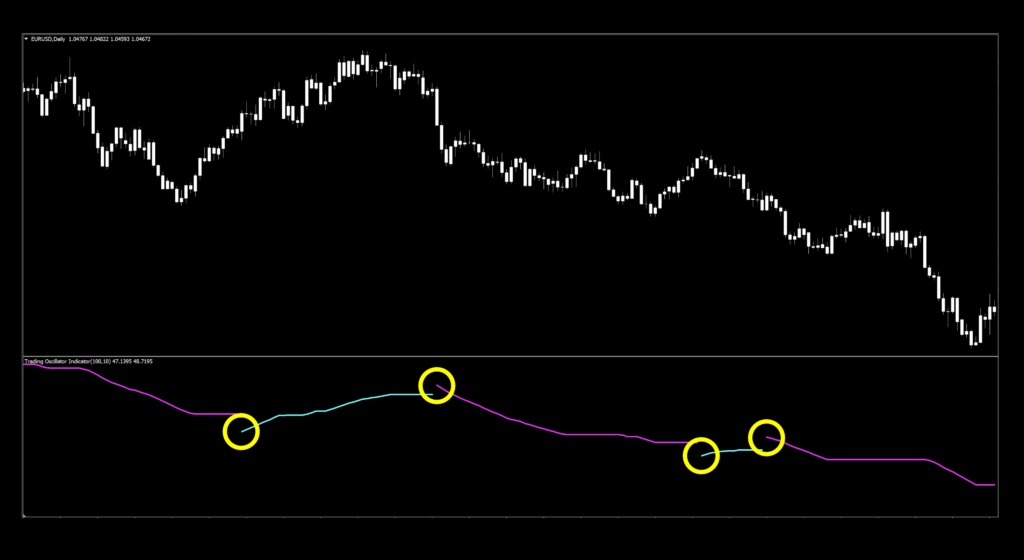
No Guesswork
It’s pretty darn obvious where the entries are. Naturally, we like easy. The default values aren’t the best, but three of those four signals would have resulted in wins, and that is definitely an acceptable win/loss rate.
Adventures in Testing
If you’re new to these studies, we recommend looking at some of the older blogs to understand how we conduct our testing.
The six pairs we recommend testing are…
EUR/USD
AUD/NZD
EUR/GBP
AUD/CAD
CHF/JPY
CAD/SGD
The markets we test our indicators are the:
EUR/USD (Euro/US Dollar)
BTC/USD (Bitcoin/US Dollar)
XAU/USD (Gold/US Dollar)
SPX500 (S&P500 Index)
Timeframes and Results
We’ll run the Trading Oscillator indicator on the EUR/USD, BTC/USD, XAU/USD, and the SPX500 using the default and tweaked settings across the daily and 4-hour timeframes on the MT4 strategy tester.
We focus on three metrics;
Total trades
Win/Loss ratio
ROI (return on investment)
Results For Review
Below are the results which came from our efforts.
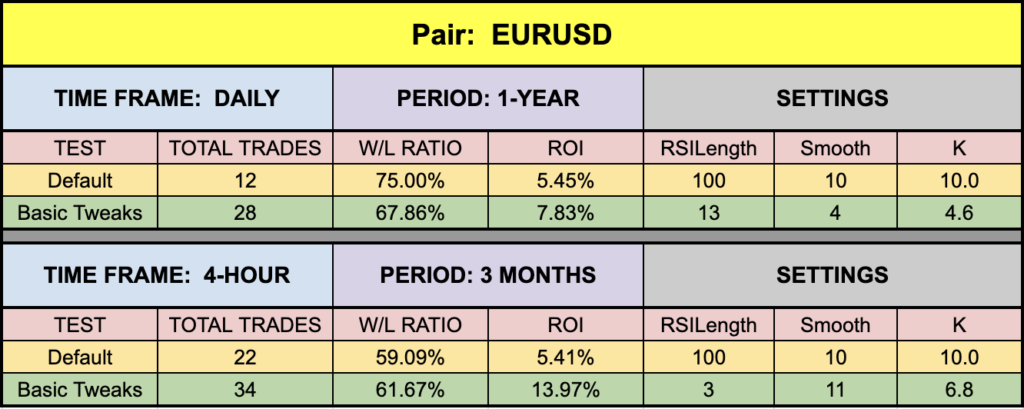
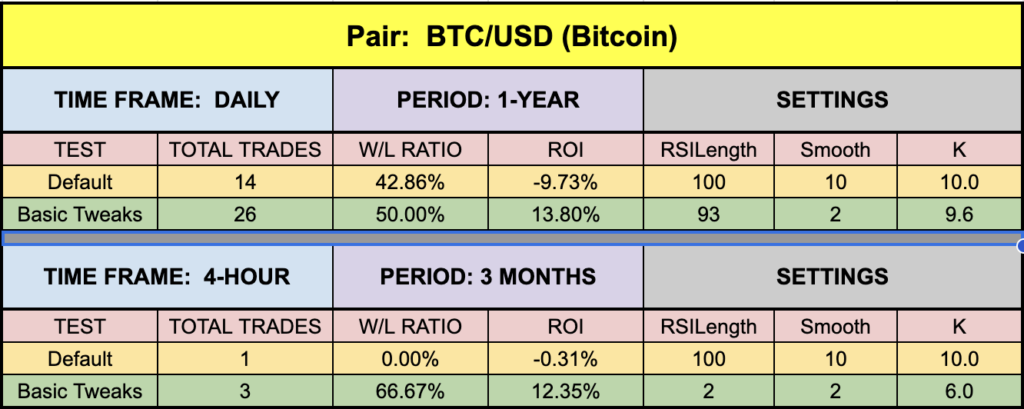
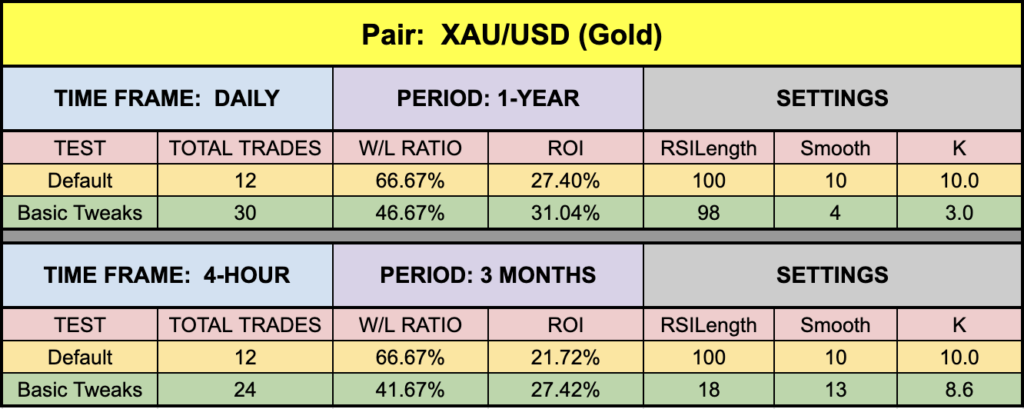
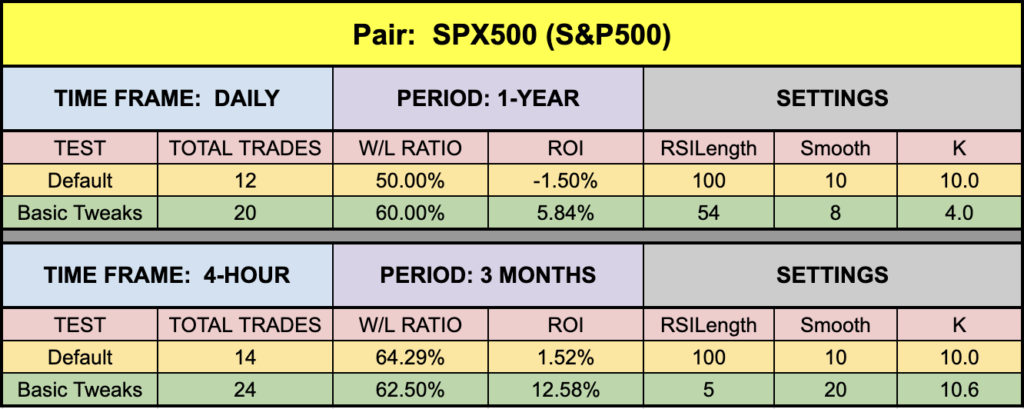
Mixed Bag
After looking through the numbers, it’s obvious that XAU is still the darling of the bunch. We were able to get good numbers with regard to the number of trades, if that’s your thing. EUR and SPX500 were a bit lower, but that’s just the market. These numbers literally change every day. Not by much, but they do change, so go do your thing and happy trading!
Money Management
Money management is based on the NNFX risk profile. That information can be learned in the Advanced Course.
Resources
We’ve made the Trading Oscillator indicator available for download on our site from the indicator library, for free. When you’re ready to get it, click HERE.
We’re Here For You
Make sure you’re signed up for the latest digests. We just put out the most recent digest a few days ago, so if you missed it, be sure to sign up on the website and email dan@stonehillforex.com with the title “Latest Digest Please” and we’ll send the most recent one off to you within 24 hours.
Other Resources
And you’ll want to subscribe to our YouTube channel for the technical analysis videos which pair well with these blogs. Don’t forget Facebook and Quora, where we answer questions relating to Forex.
Our only goal is to make you a better trader.
BTW – Any information communicated by Stonehill Forex Limited is solely for educational purposes. The information contained within the courses and on the website neither constitutes investment advice nor a general recommendation on investments. It is not intended to be and should not be interpreted as investment advice or a general recommendation on investment. Any person who places trades, orders or makes other types of trades and investments etc. is responsible for their own investment decisions and does so at their own risk. It is recommended that any person taking investment decisions consults with an independent financial advisor. Stonehill Forex Limited training courses and blogs are for educational purposes only, not a financial advisory service, and does not give financial advice or make general recommendations on investment.