Correlation Trend
If you’d like to follow along with the e-book version of the blog, click on the play button in the audio player below (at the bottom of the page).
Connections And Associations
Everybody loves to have connections. “I know a guy…” Hopefully, you have a guy, or girl, with connections; the newest nightclub, a window seat at a five-star restaurant, front row at a concert – you know what I’m talking about. What about traders? Should we have connections and associations? Sure, why not? Your connection might be a mentor, an experienced trader friend, even us at Stonehill Forex and of course, VP at NNFX might be considered a connection. We’ve got an indicator developed by “a guy” for all of us. You may have heard of him, and we’ve profiled some of his work in the past, so you know this is a quality connection.
Disconnected
A good connection when getting data is imperative. It doesn’t always happen. Ever have your computer suddenly decide to update a program? It just sits there, so proud of itself, meanwhile, our data stream now has a big white square in the middle with the statement, “We updated whatever minor program even though you were in the middle of something” with this emoji – 🤪. Annoying. So we try again, fingers crossed. The default settings weren’t bad with regard to visuals, but we brightened them up for better signal identification. After all, we always look for easier, for everybody. Enjoy this week’s analytical installment, then come right back for the rest of the narrative.
Why Ask Why
We received an email this past week from a community member asking about an indicator we blogged about some time ago. He inquired about the fact that it had no testing data. The reason is that was written before VP began creating his videos from the indicators we blogged about and given the indicator’s widespread use, it probably won’t get profiled on the NNFX channel. No big deal. One of our plans is to go back and provide some testing data when we can. It won’t happen today, tomorrow, or next week…but eventually we’ll backfill with those which were done BIFCC (Before Indicator Profile Channel Creation). Remember, patience is a virtue. Or, just start your own testing and don’t wait up for us. After all, you are in charge of you…but nevertheless, please continue to send us your magnanimous musing to stonehillindicator@gmail.com, and thanks for the effort.
A Friend in the Trend
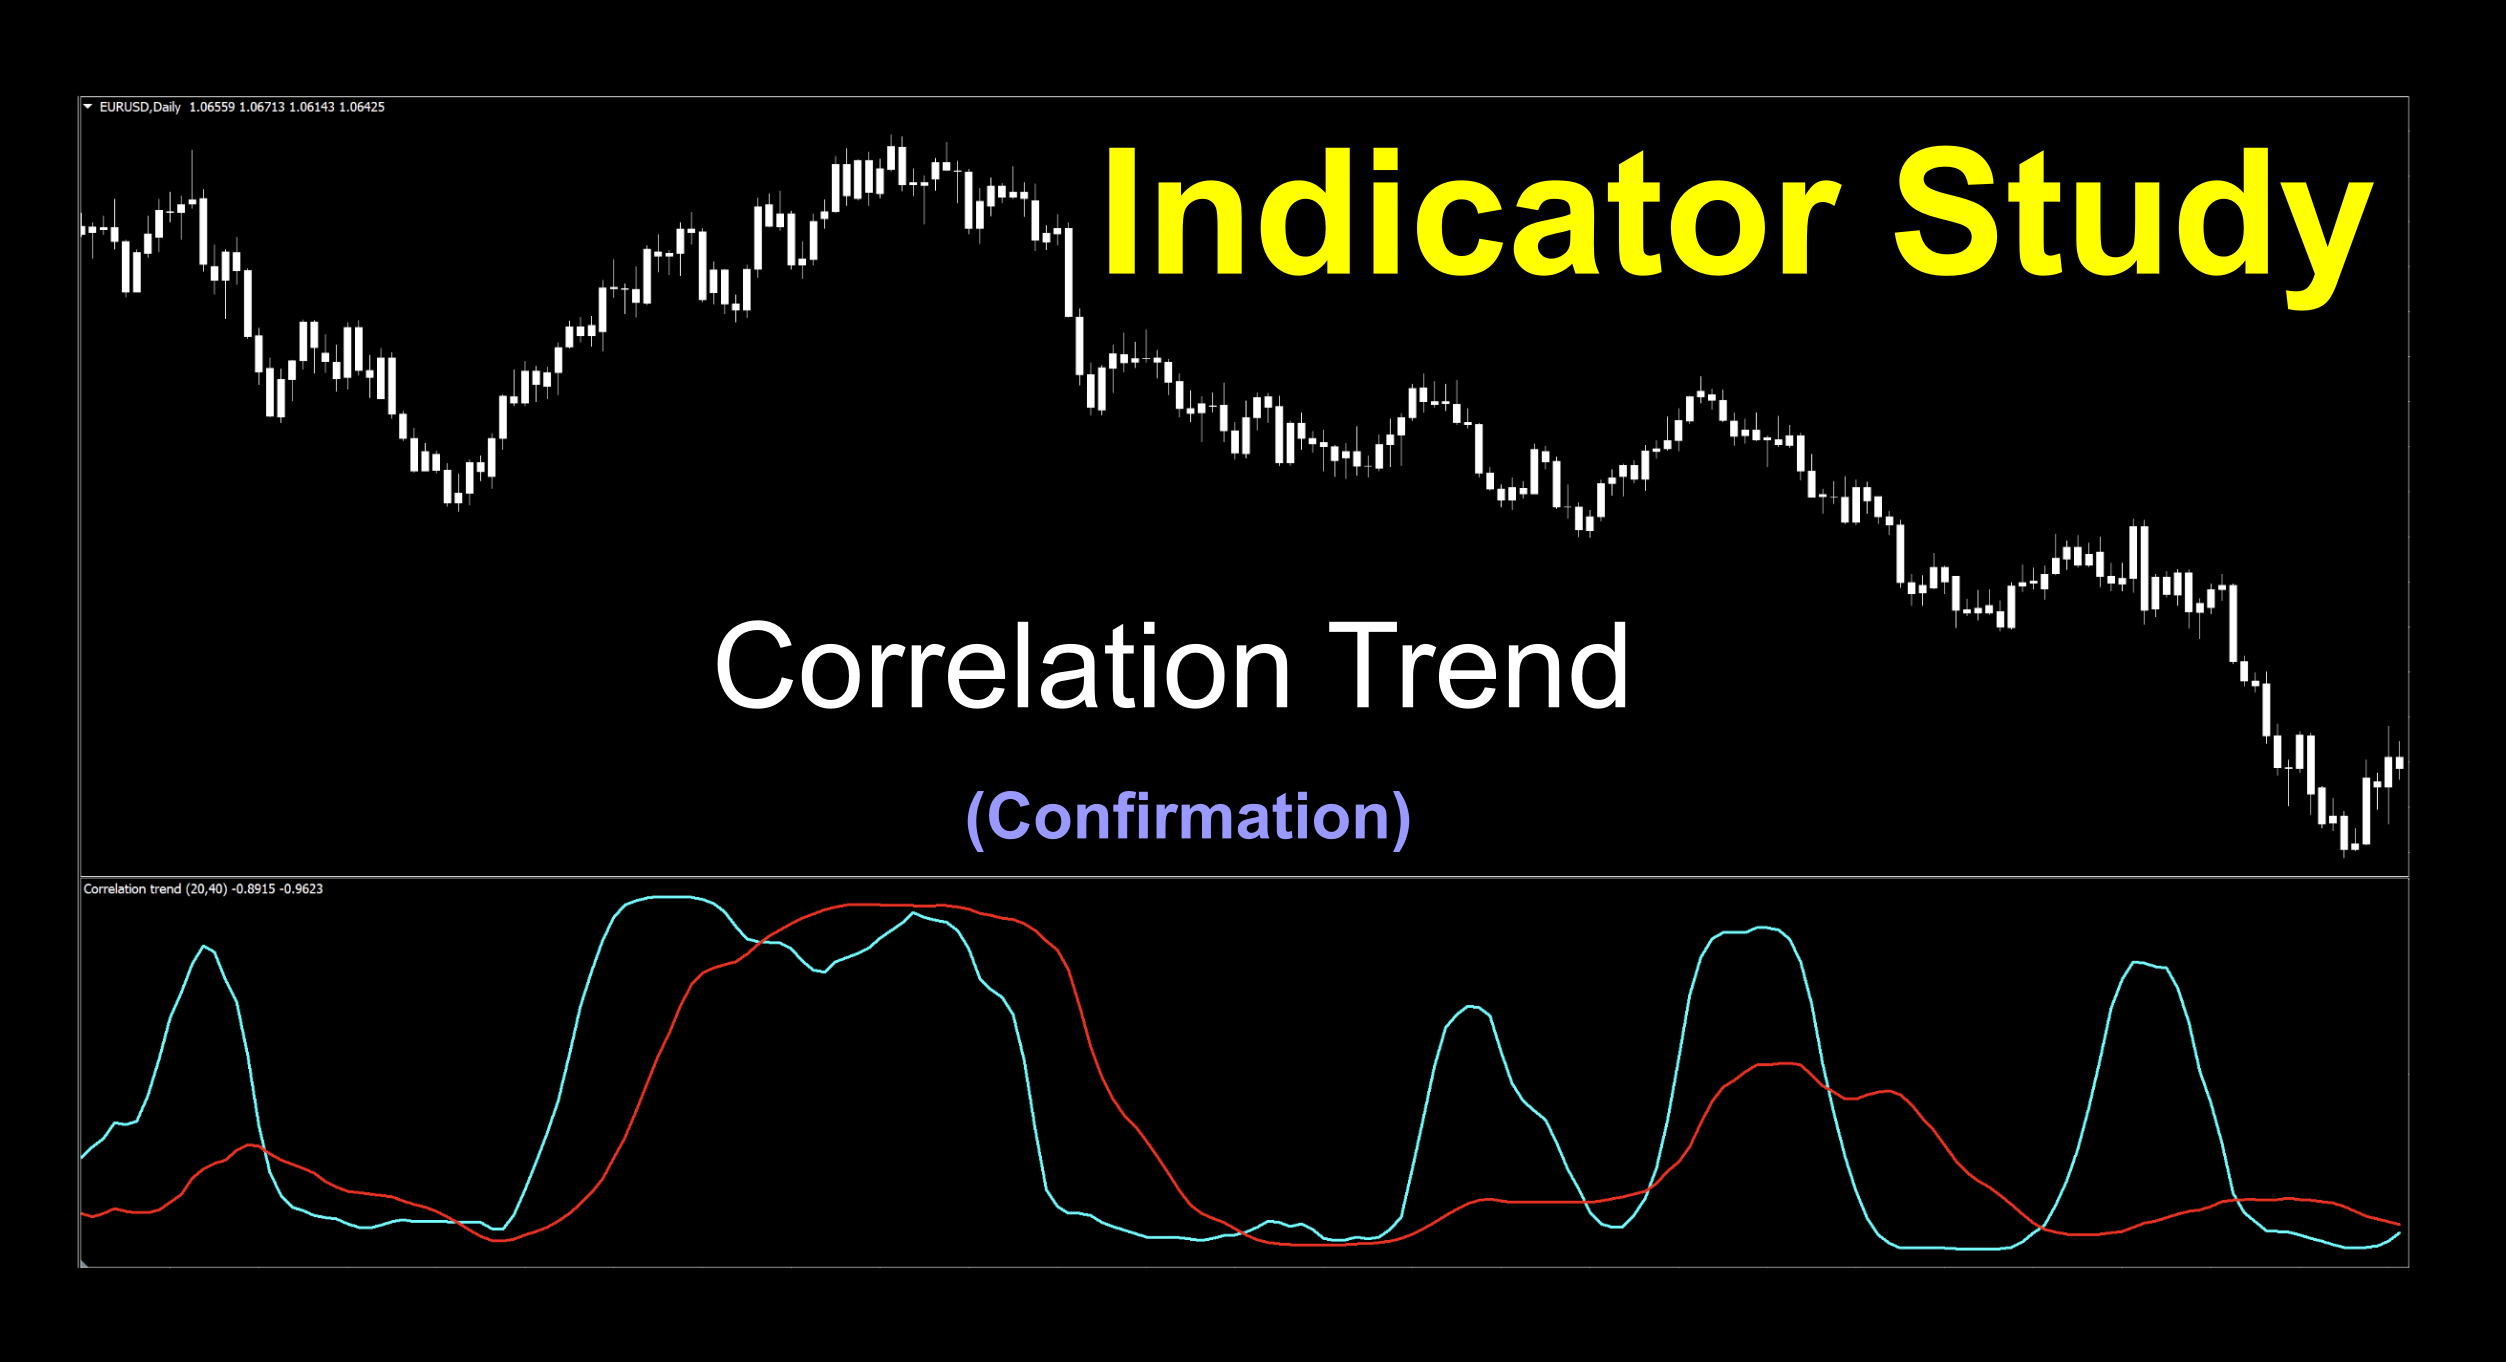
Our mystery connection is none other than one of the greats; John Ehlers. The Correlation Trend indicator was developed in 2020, a somewhat newer work from Mr. Ehlers. We’ve included the link to the PDF file HERE which takes you to the article featured in May 2020s Stocks & Commodities Magazine describing all the inner workings of the indicator. It was originally coded in “easylanguage”, and coded for MT4 the same year. This two lines cross confirmation indicator is built on the correlation, or relationship between a trend and the cyclic component, of the market.
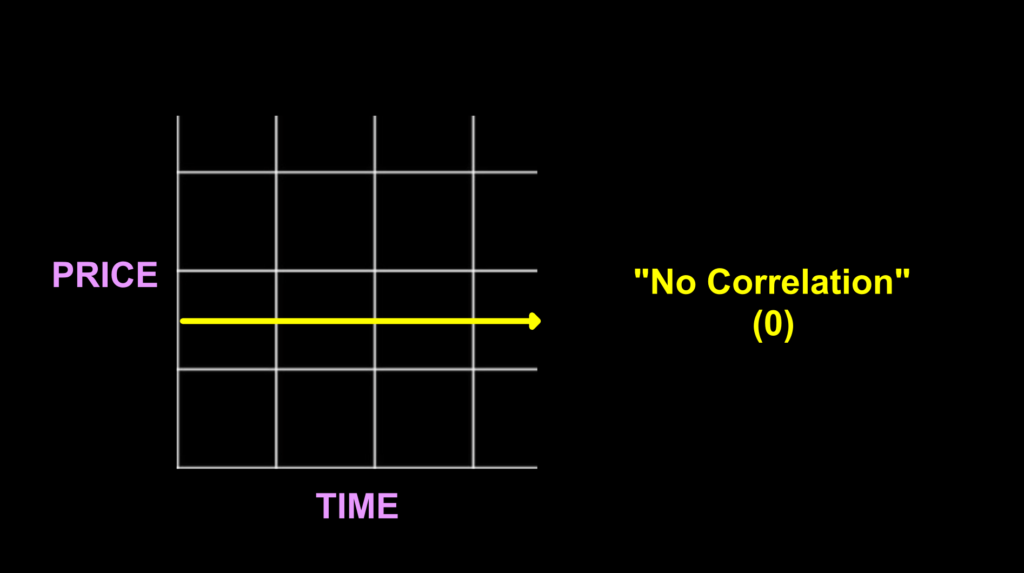
A Perfect World
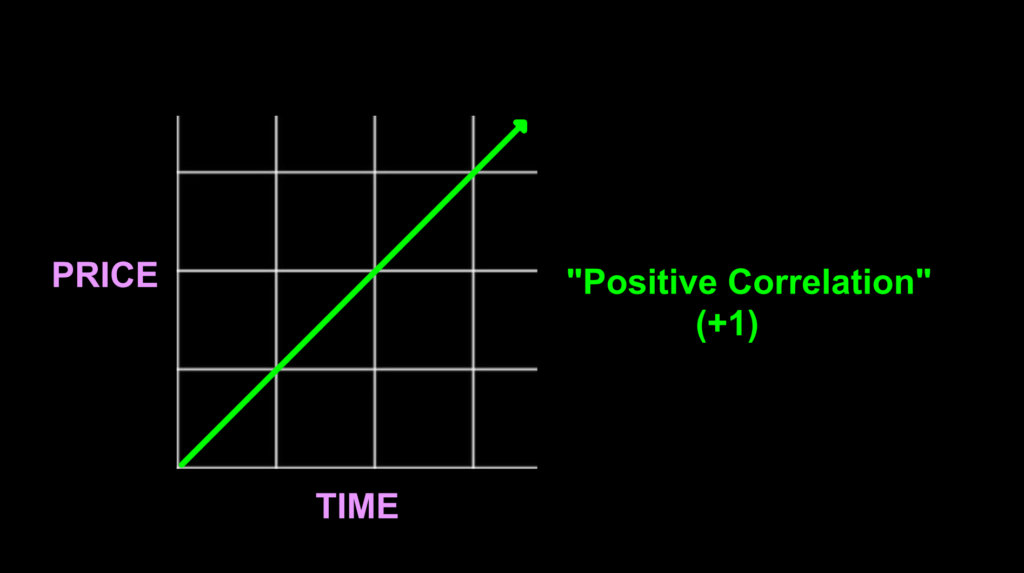
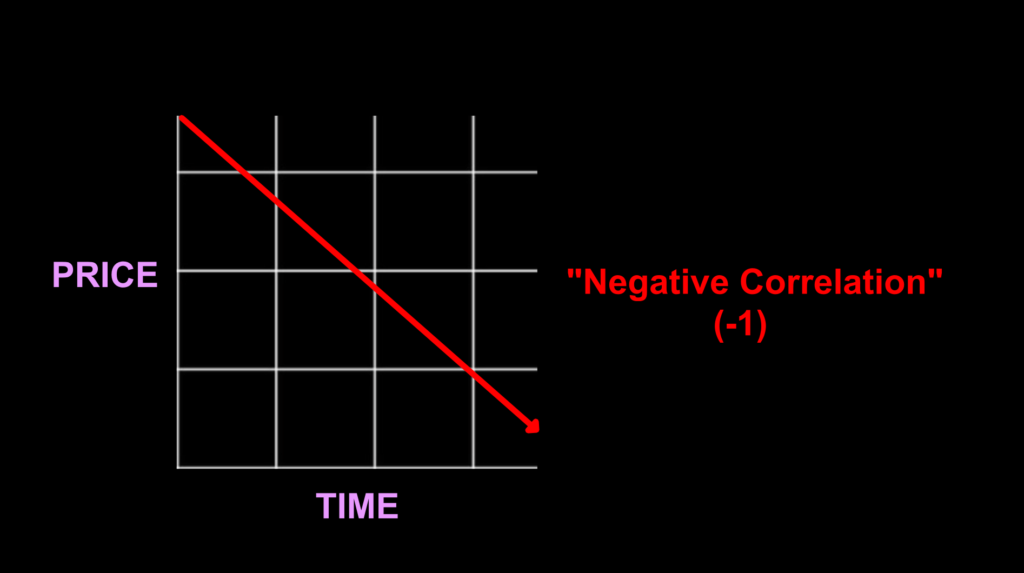
Mr. Ehlers equates this with comparing price if plotted as a straight line. Positive price (as a straight line) is a positive slope with a +1 correlation. If price is a negative slope, the correlation is -1. And, if price is sideways, then there is no correlation. In these conditions, an “ideal” trend indicator could be imagined. While we all long for the ideal trend indicator, we’d probably settle for a decent one. Any ways, if graphed, this is what Mr. Ehlers was referring to.
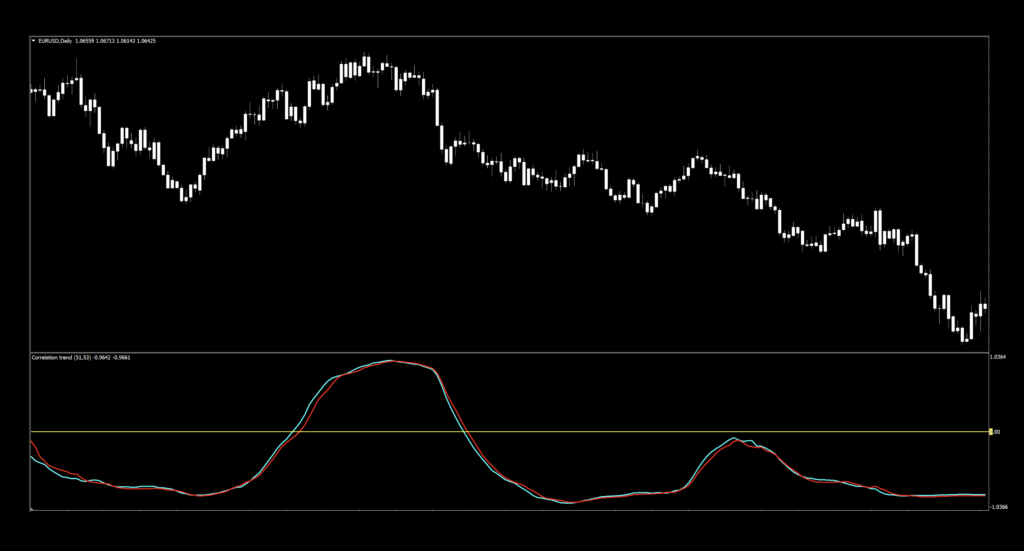
Clear Connection
The default view actually wasn’t too bad. But for our sharing purposes, we felt that it should get a little touch up by changing one of the signal lines from gray to blue. We also fattened them up a bit. But that’s really about it. Naturally, for this kind of indicator, we used the white candles to keep you focused on the indicator.
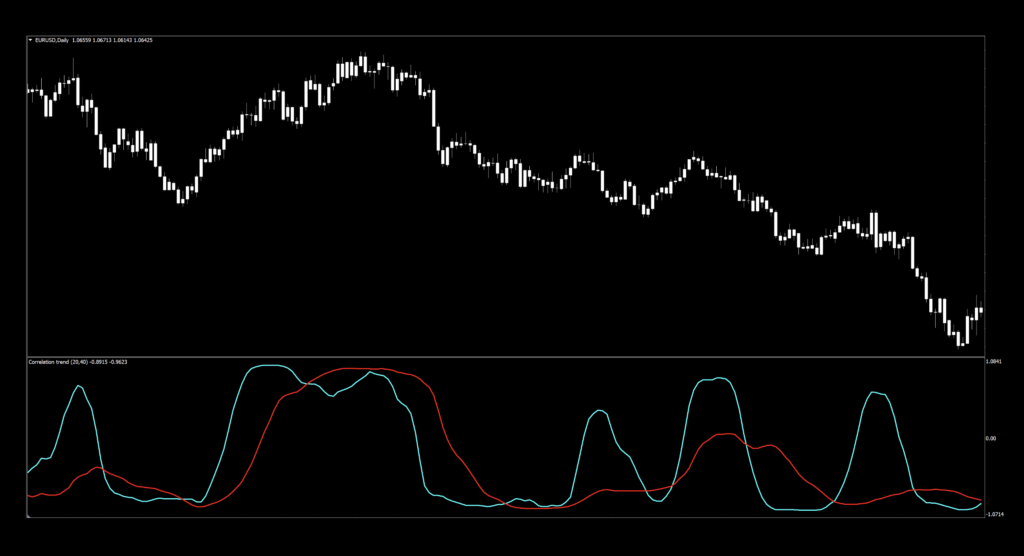
I See Zeros
Yes, you’re not wrong. There is a zero line (which we’ve not highlighted) in the image above. We did not test this as a zero line cross, but you certainly could use it as a zero line cross, if you choose to. There were some instances during our testing which created a different looking indicator where using it as a zero line cross may be easier, as observed in the image below.
The settings in this instance are not important, but just be aware that as you do test it, you may get difficult to decipher two line cross signals from time to time.
Settings
This indicator has three settings, and the third setting opens up a whole new world of choices.
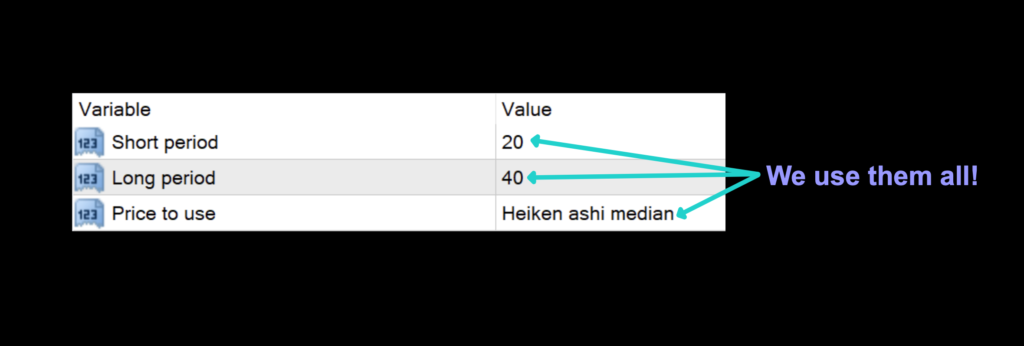
Short period: The short trend cycle’s length. The default setting is 20.
Long period: The long trend cycle’s length. The default setting is 40.
Price to use: The price data set used for the internal calculations. The default setting is 15 – Heiken ashi median. The below image identifies all 33 types of prices you can use.
![]()
Advantages
* Can be used as two types of indicators.
* Many test options with only three settings.
* Based on concepts by a known developer.
How we use it.
To clarify specific concepts relating to the NNFX system. There are three possible trade actions;
OPENING A TRADE
CLOSING A TRADE
MAINTAINING A TRADE
One of these three actions need to happen in the last 30 minutes prior to the close. This is when you make your trading decisions, and not actually wait for the close at 1700 EST, because we trade on the daily time frame.
Long signal: When the blue line crosses over the red line. Entry is in the last 30 minutes of the trading day.
Short signal: When the red line crosses over the blue line. Entry is in the last 30 minutes of the trading day.
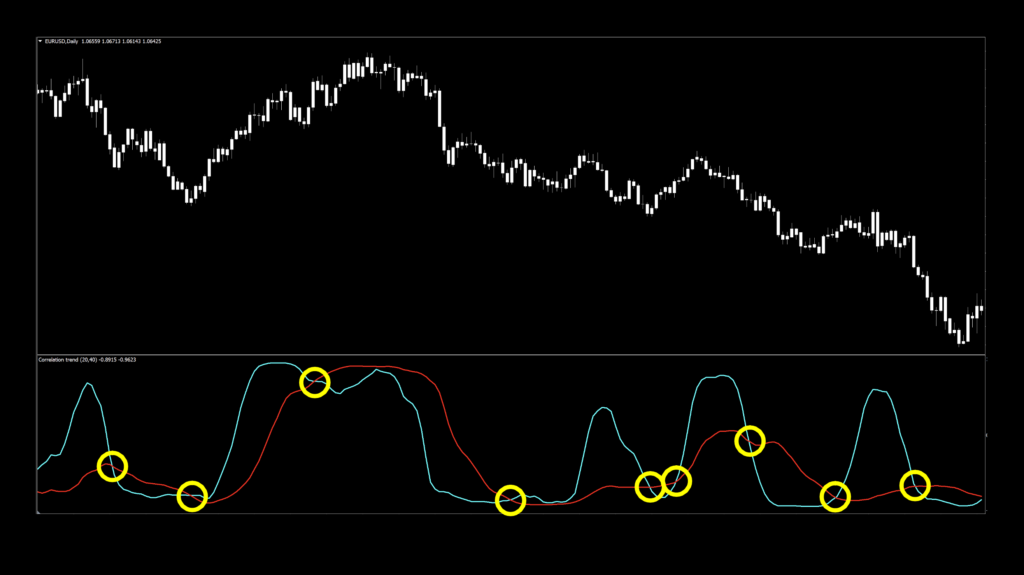
Pretty Clear Connection
At first blush, the signals were pretty darn clear in our marked up image. There was one obvious loser where signals were close together, but overall, we think Mr. Ehlers is onto something, and we’re glad we found it.
One Last Remark
We did read where someone suggested using the indicator as a combination indicator; that being both a two-lines cross and zero line cross. What that means is the following.
Use the zero line to decide that a trend exists.
Use the two lines cross as the short or long signal.
We offer you another marked up image based on this use of the indicator. Again, please note that we did not test it this way, so we have no data on its accuracy.
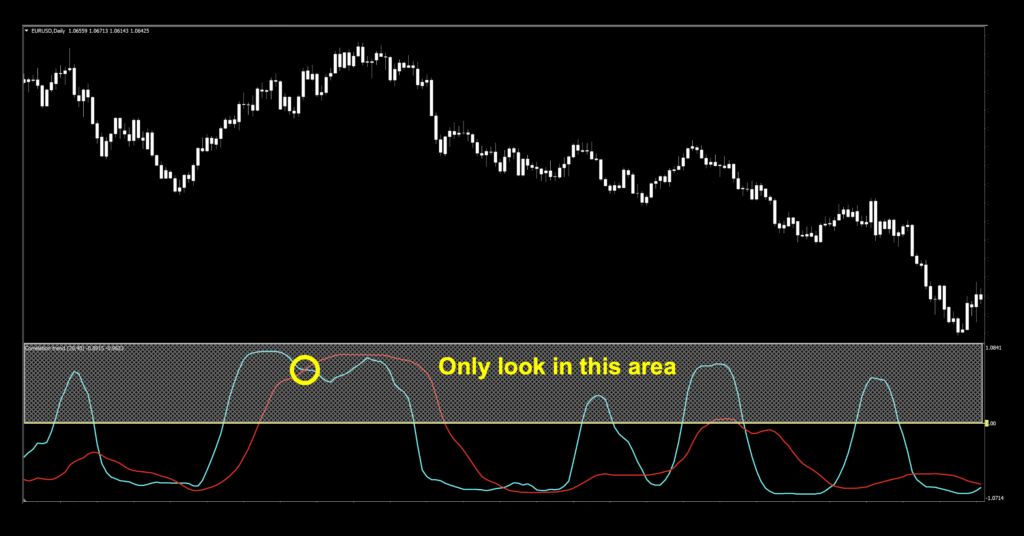
According to the same time period, there was only one occurrence where both criteria were present; above zero and a cross between the two lines.
Testing Connections
If you’re new to these studies, we recommend looking at some of the older blogs to understand how we conduct our testing.
The six pairs we recommend testing are…
EUR/USD
AUD/NZD
EUR/GBP
AUD/CAD
CHF/JPY
CAD/SGD
The markets we test our indicators are the:
EUR/USD (Euro/US Dollar)
BTC/USD (Bitcoin/US Dollar)
XAU/USD (Gold/US Dollar)
SPX500 (S&P500 Index)
Timeframes and Results
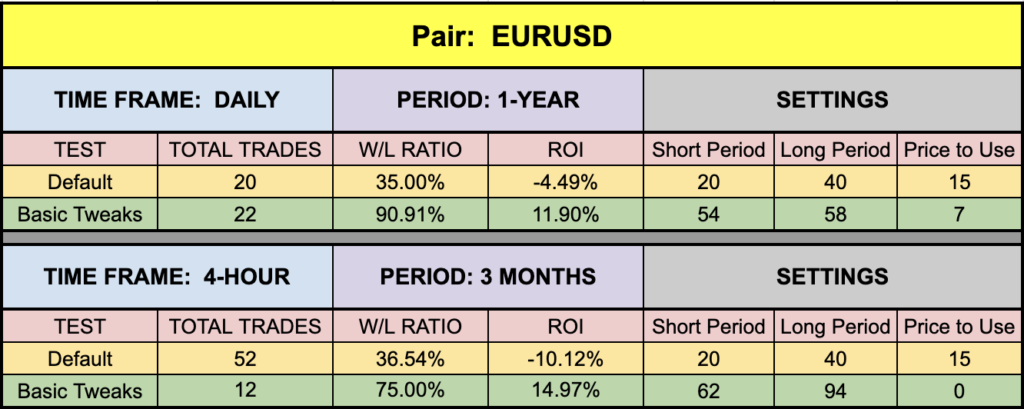
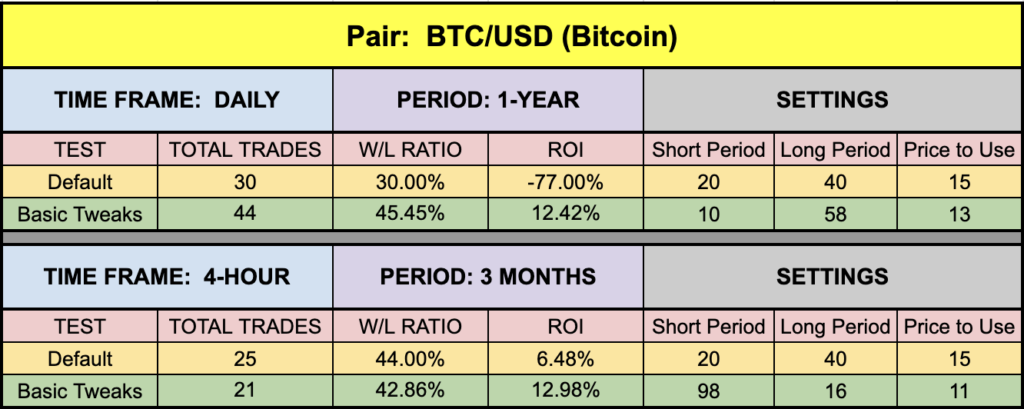
We’ll run the Correlation Trend indicator on the EUR/USD, BTC/USD, XAU/USD, and the SPX500 using the default and tweaked settings across the daily and 4-hour timeframes on the MT4 strategy tester.
We focus on three metrics;
Total trades
Win/Loss ratio
ROI (return on investment)
Results For Contemplation
Below are the results from our testing adventure.
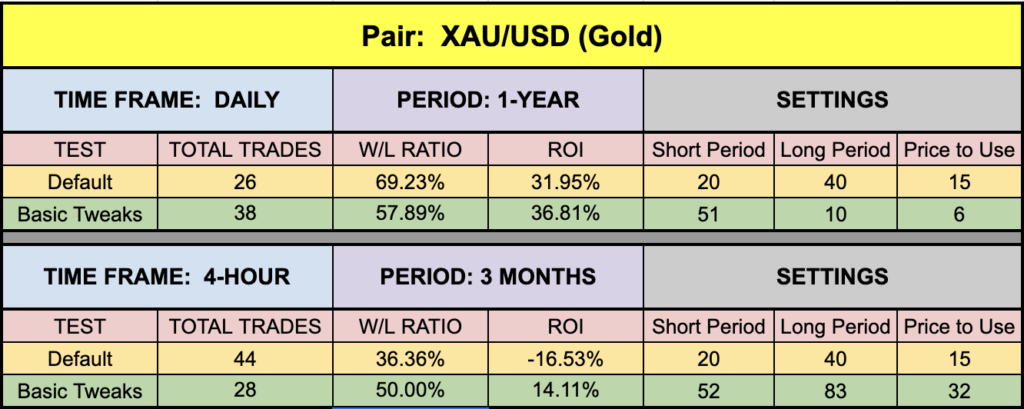

Clear or Static?
Overall, not too bad. The default numbers on BTC were incredibly poor, but we were able to find tweaked settings for redemption, so we were pleased about that. XAU was the clear winner here with stellar default values and even the EUR was able to swing pretty decent numbers, especially on that killer win/loss percentage. We think this indicator definitely deserves a little of your time, so head on over to the library and download a copy for yourself. Happy hunting!
Money Management
Money management is based on the NNFX risk profile. That information can be learned in the Advanced Course.
Resources
We’ve made the Correlation Trend indicator available for download on our site from the indicator library, for free. When you’re ready to get it, click HERE.
We’re Here For You
Make sure you’re signed up for the latest digests. We’re getting ready to put out the next digest pretty soon, so watch for that. If you haven’t signed up yet, be sure to do that and if you’d like to see what we discussed in last month’s digest, email dan@stonehillforex.com with the title “Latest Digest Please” and we’ll send it off to you within 24 hours.
Other Resources
And you’ll want to subscribe to our YouTube channel for the technical analysis videos which pair well with these blogs. Don’t forget Facebook and Quora, where we answer questions relating to Forex.
Our only goal is to make you a better trader.
BTW – Any information communicated by Stonehill Forex Limited is solely for educational purposes. The information contained within the courses and on the website neither constitutes investment advice nor a general recommendation on investments. It is not intended to be and should not be interpreted as investment advice or a general recommendation on investment. Any person who places trades, orders or makes other types of trades and investments etc. is responsible for their own investment decisions and does so at their own risk. It is recommended that any person taking investment decisions consults with an independent financial advisor. Stonehill Forex Limited training courses and blogs are for educational purposes only, not a financial advisory service, and does not give financial advice or make general recommendations on investment.