rithmic functions in their daily lives? I actually did for celestial navigation, gleaned from old tables. Fun times. Another story for another time. Before we go any further, watch the technical analysis of the indicator, then continue on.
The Choppiness Index was developed by Australian commodity trader Bill Dreiss and highlighted in his article, “The Fractal Wave Algorithm, Charts And Systems” published in the July/August 1992 edition of Commodity Traders Consumer Report. Even though it’s slightly older than our 1996 cutoff date, we think it still has merit and might make for an interesting indicator to include in your trader’s toolbox. The first instance we could find of this concept coded for MT4 was in 2011…and it can be found in a histogram version as well. We’ll stick with the single line for this blog.
One Way Street
We discovered it was used in more than one way. Some professed using it as a single line cross, and others swore it was better as a multi level oscillator. We chose to test it as a single line cross because the signals are more clear and easier to apply to the overall decision-making process. We’ll show both versions. Ultimately, how you use it is up to you.
Chop Suey
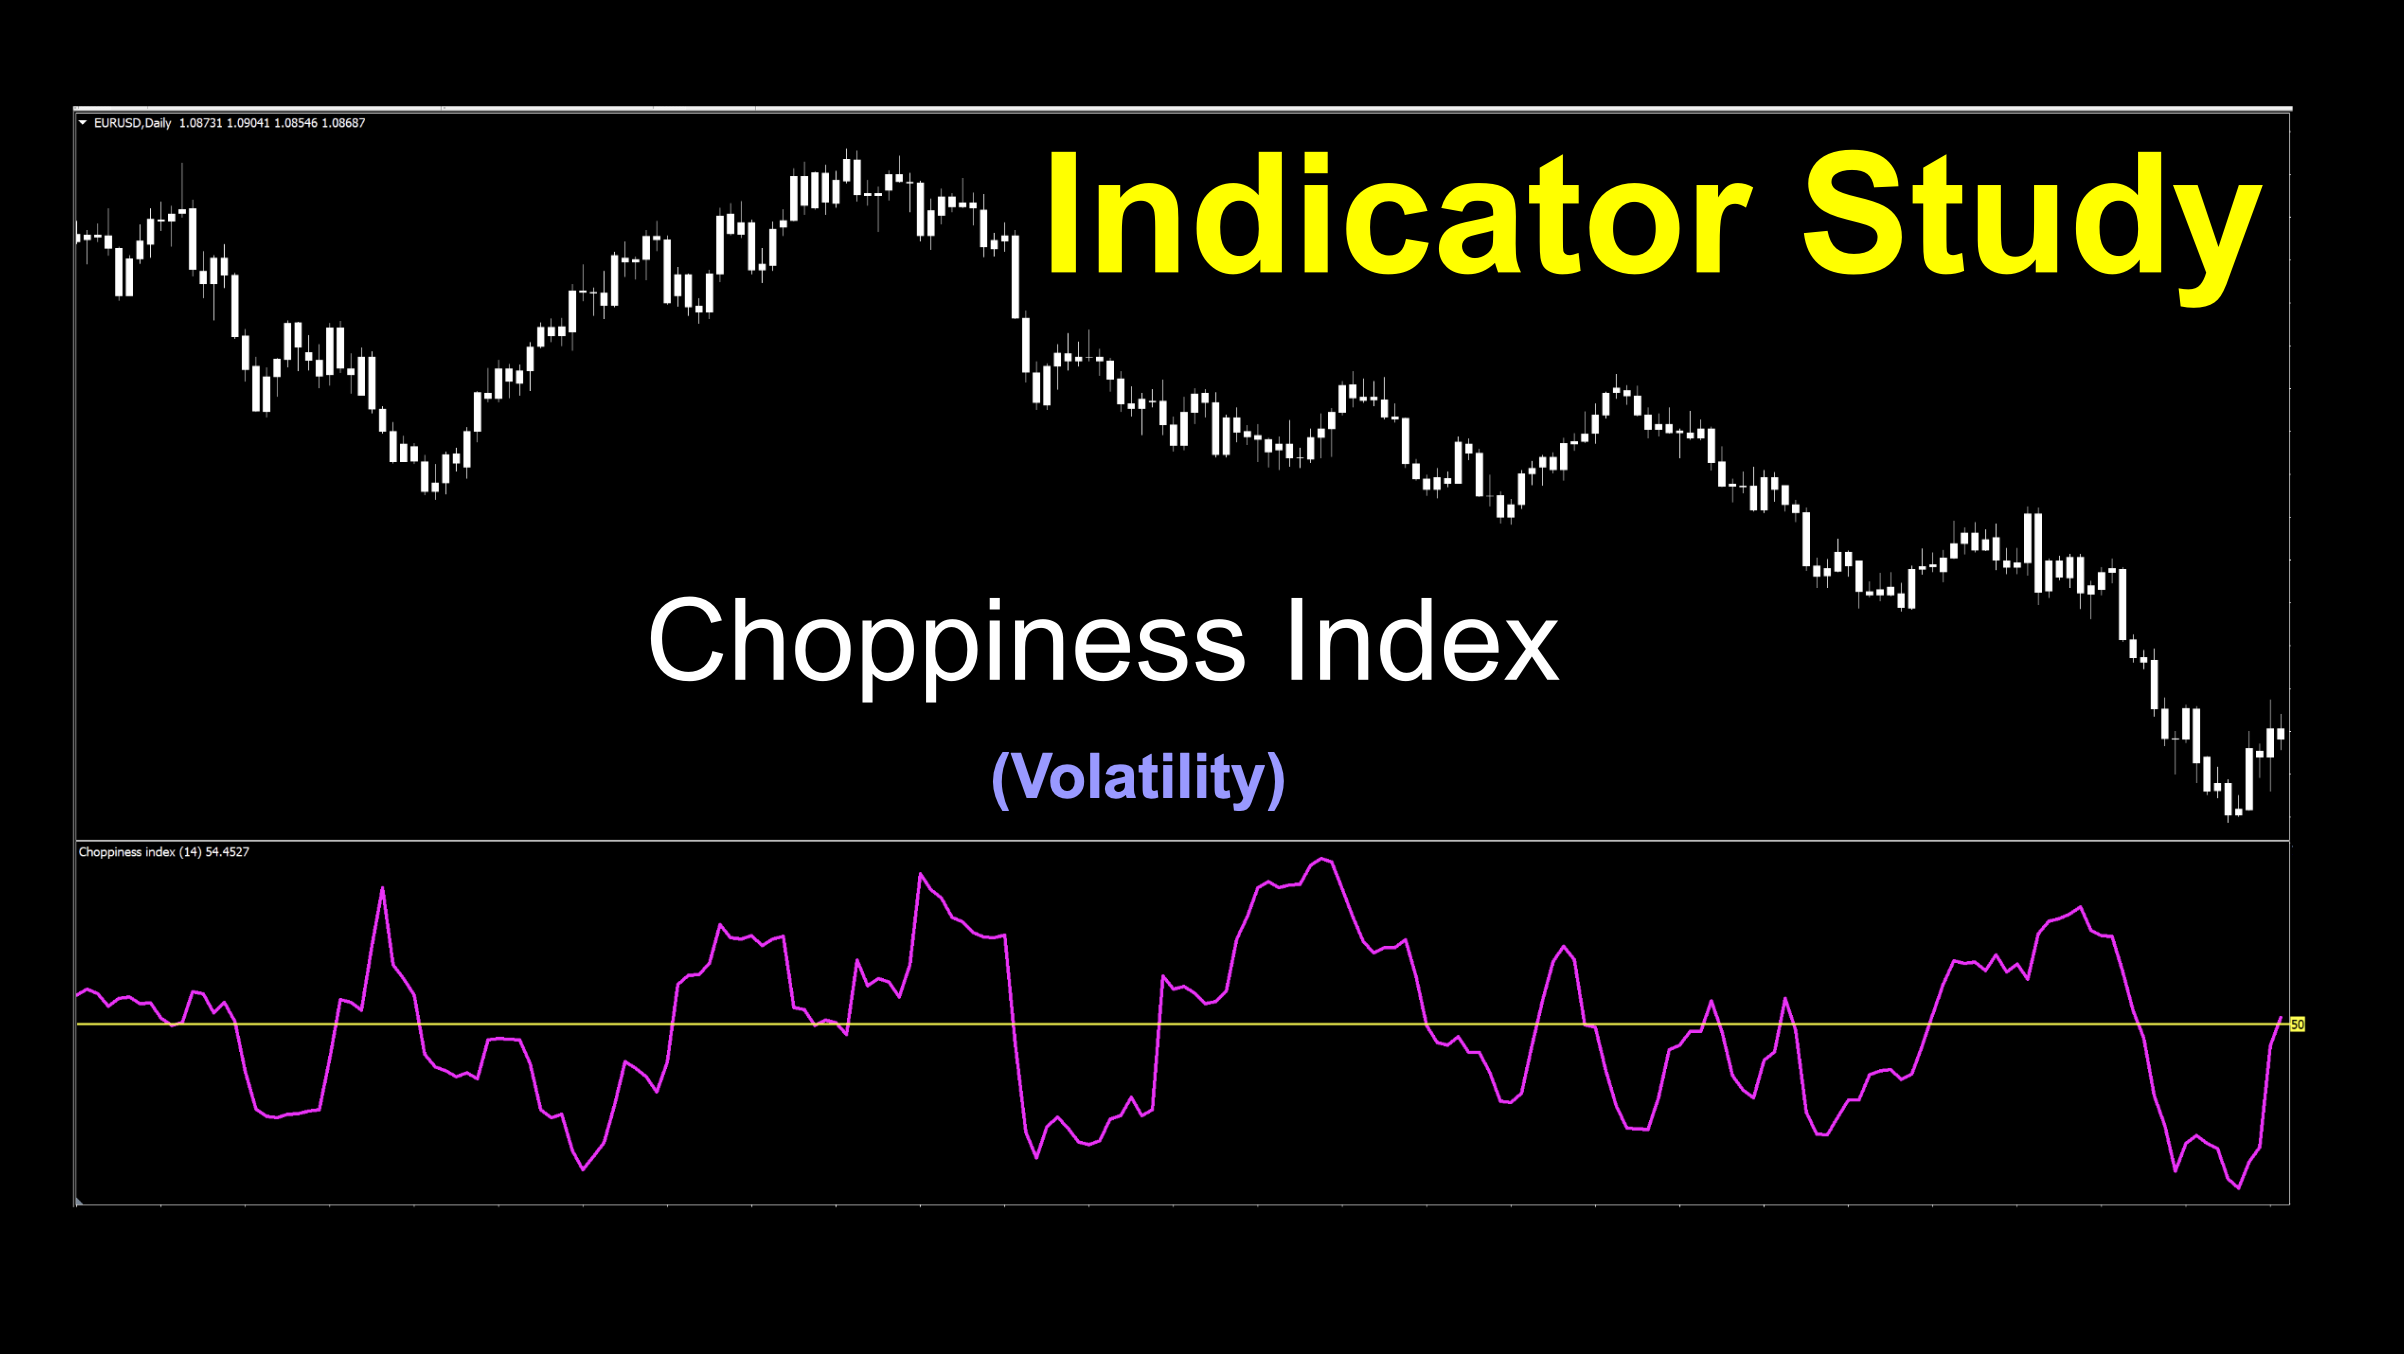
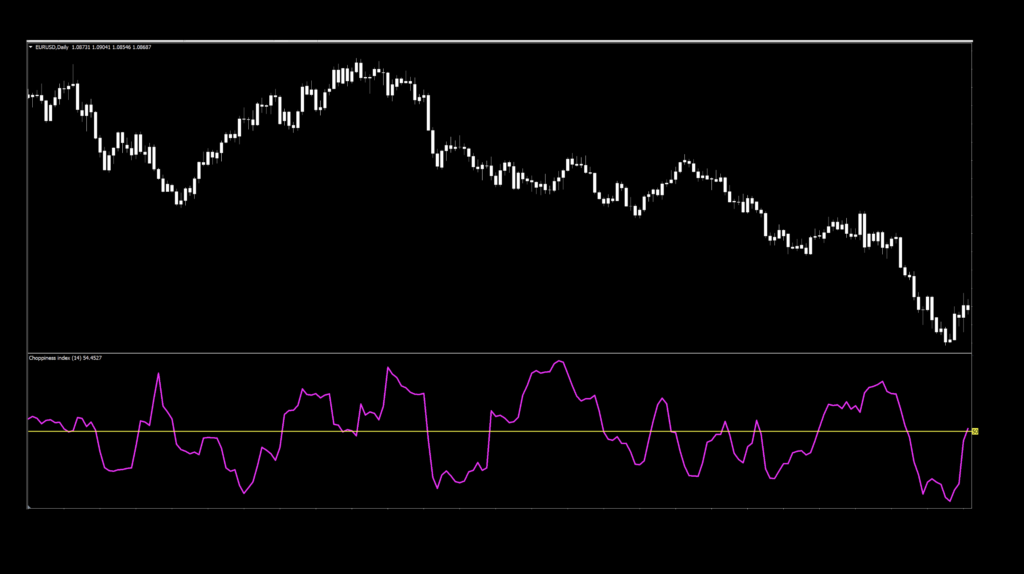
As mentioned, we chose the line version of this indicator instead of the histogram. We thickened the signal line and changed it to a brighter color, then added a single (midline) level. By the way, the midline level is not a fixed value, meaning that it will change depending on current market conditions. We’ll talk about that more later. Candles are white, per our usual process and procedure.
Now comes the fun part. And there are a few things we need to discuss.
What it Does
The Choppiness Index gets price data and attempts to determine if the market is trending or not. If the signal line is BELOW a certain threshold (level), then it is considered trending. If the signal line is ABOVE a certain threshold (level), then the market is considered to be in a non-trending state. It is not buy or sell, it is a “yes” or “no”…just like a volume indicator.
How we tested it.
We treated it as a volume indicator, and therefore needed to compare it to something. We chose the lowly SMA (Simple Moving Average). What we did is use default values for both the SMA and the Choppiness Index to get baseline values. Then we tweaked both those values to see if we could get something better. The slick thing about testing this indicator is that you can change your baseline from an SMA to one of many others to find out if that combination works better.
About a Midline
As previously mentioned, the midline is just an average of the upper and lower levels (added) and then divided by 2. Occasionally, you may have to change the level, but trading on the daily time frame prevents anything from happening so quickly that you risk missing anything significant. On our example, the upper range is 72.5 and the lower range is 27.7. Added together, you get 100.2 and divided by 2, the final result is 50.1…or just “50”.
Below are a couple of examples for your consideration…
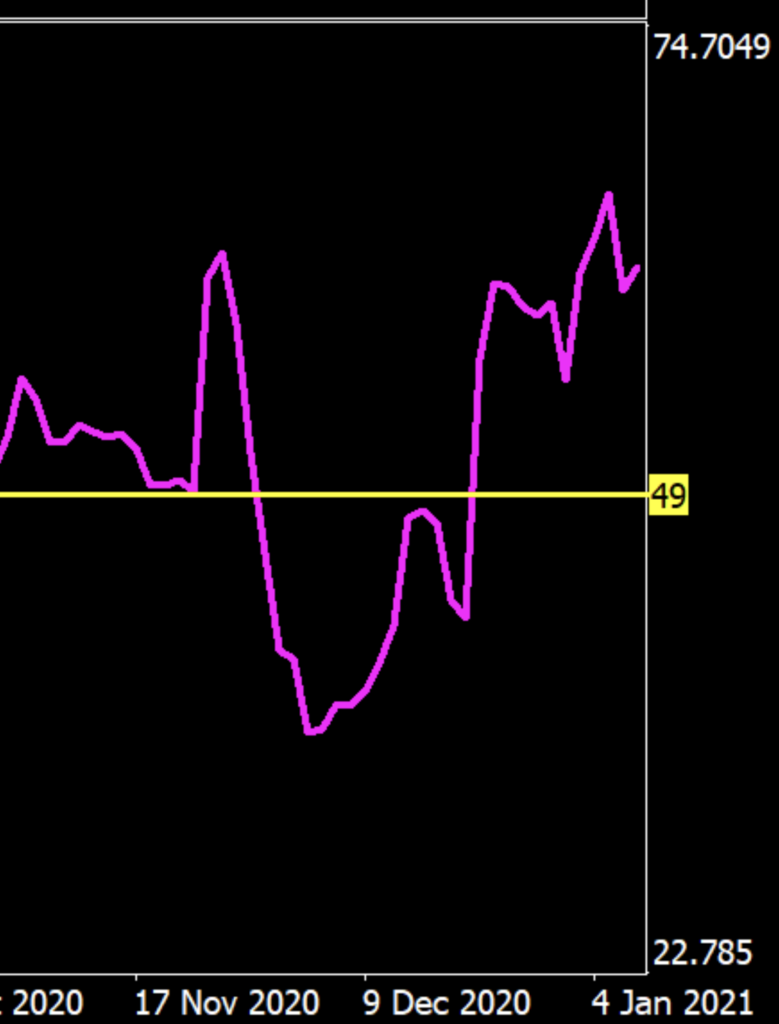
We’ll use the first trading day of 2021. Notice that the values are 74.7 and 22.8 (we rounded). Simply add the two numbers and divide by two, then round your result.
74.7 + 22.8 = 97.5
97.5/2 = 48.75 => 49
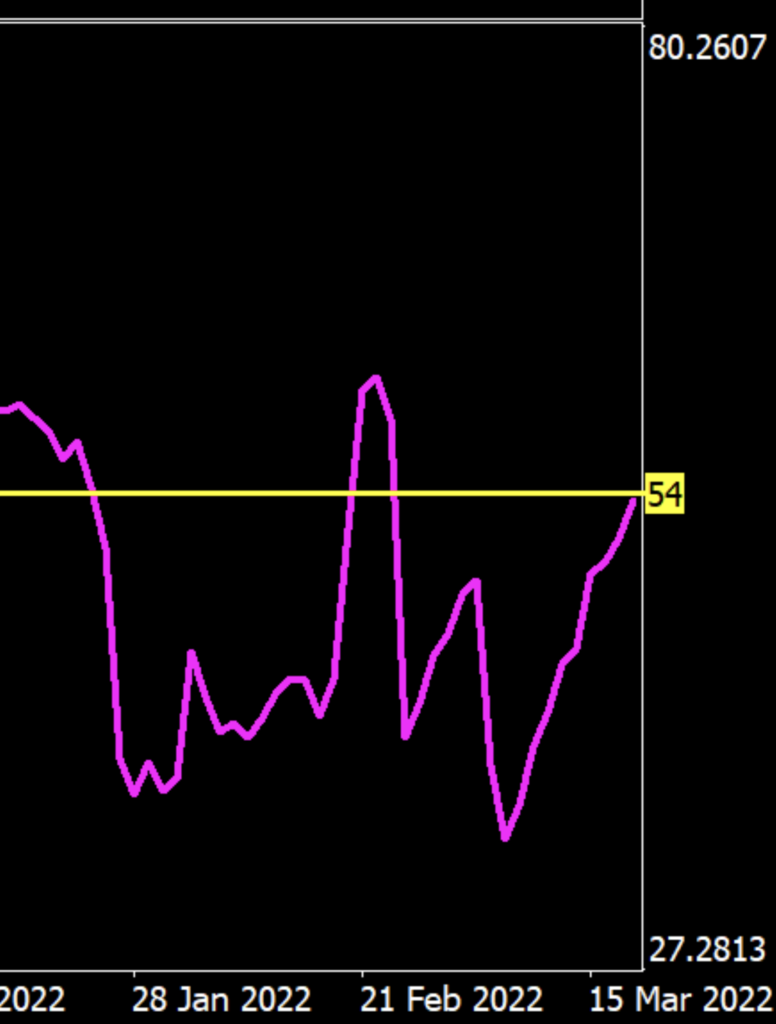
We’ve included a second example here. By moving the date to March 15, 2022, you can see the upper limit is 80.3 and the lower limit is 27.3. Using the same calculations;
80.3 + 27.3 = 107.6
107.6/2 = 53.8 => 54
Alternate Use
Before we get to the testing, we wanted to show you the “alternate” version of how you may want to use this indicator. Some use the Choppiness Index indicator to measure the market’s trendiness by using fixed values of 38.2 and 61.8. The market is trending when values are below 38.2 versus the market’s choppiness on values above 61.8. Those numbers look familiar…what are they? 38.2 and 61.8 are Fibonacci Retracement numbers, and that’s a discussion for another time.
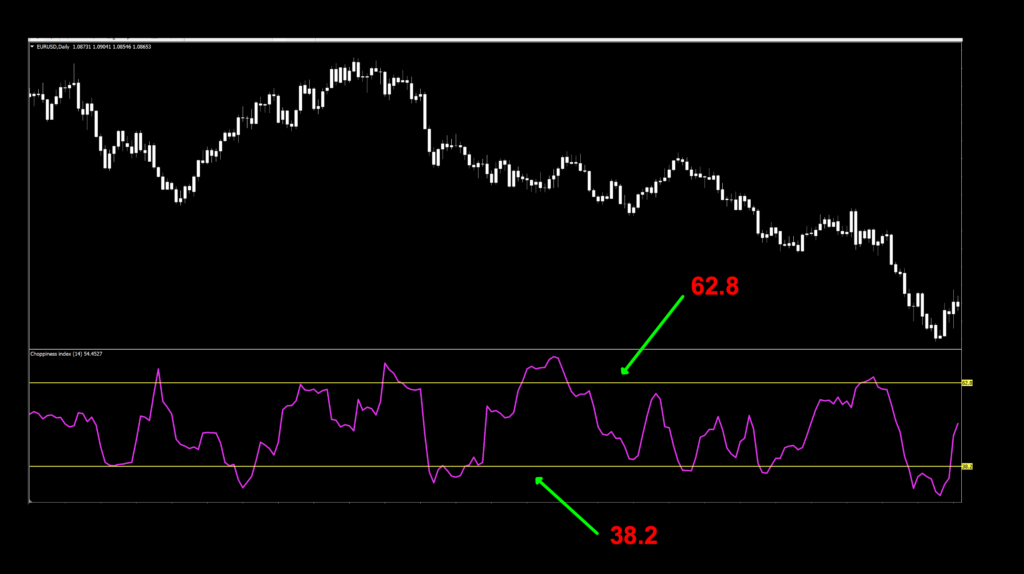
As for the “no man’s land” in the middle. This area attempts to denote that price is in consolidation and is used to try and anticipate potential breakouts.
One More Thing
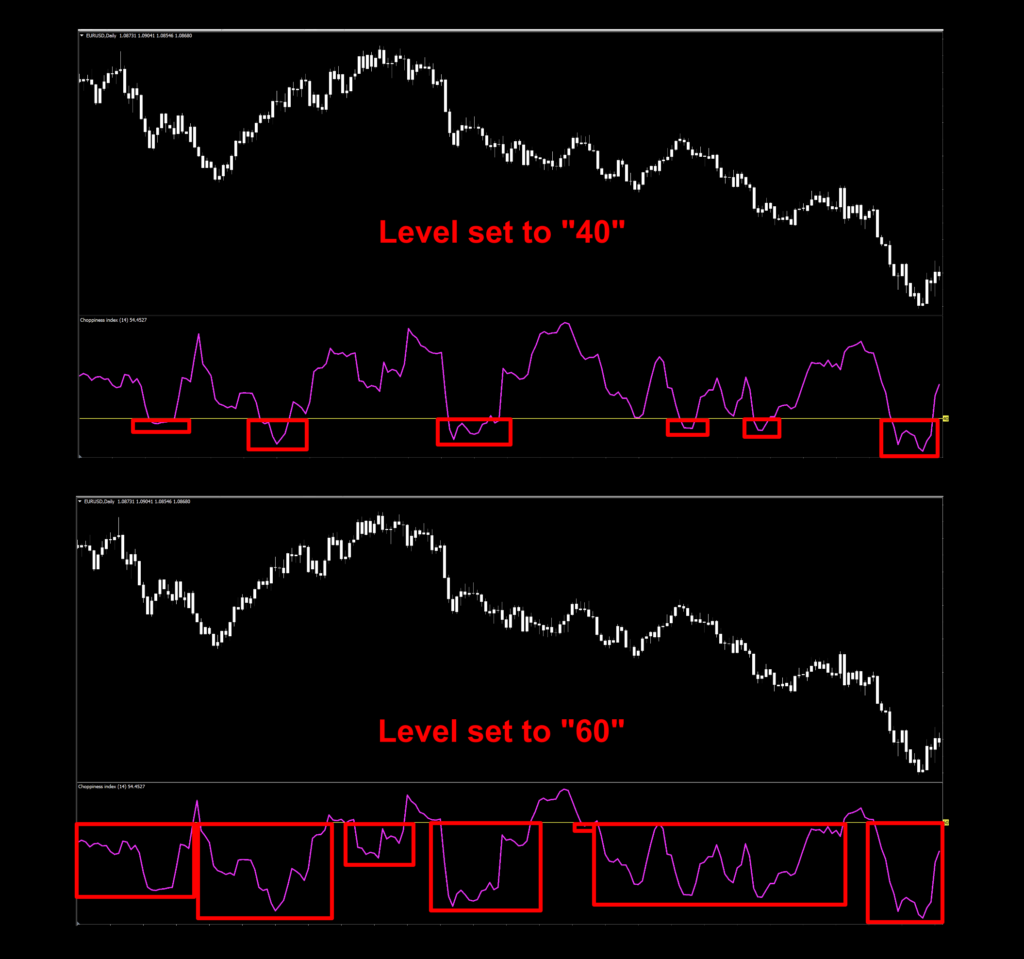
You can change the value of your midline to something other than the “center” of the window if you choose. For instance, if the high and low values are “25” and “75”, your midline would be “50”. If you chose to change that value to “40” for more conservative trades, that certainly is something you can do. Want to consider higher risk trades, raise the number to 60. The best thing about all of this, is that you’re in total control!
Settings
There is only one setting which generates the math for the signal line.
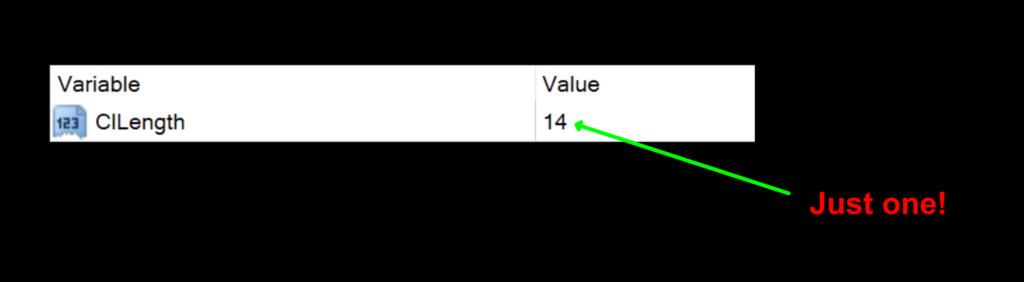
CILength: The number of periods considered for calculating the signal line. The default setting is 14.
Advantages
* Filters market conditions.
* Easy to adjust for varying markets.
* Simple binary (“yes”/”no”) signals.
Mark Up
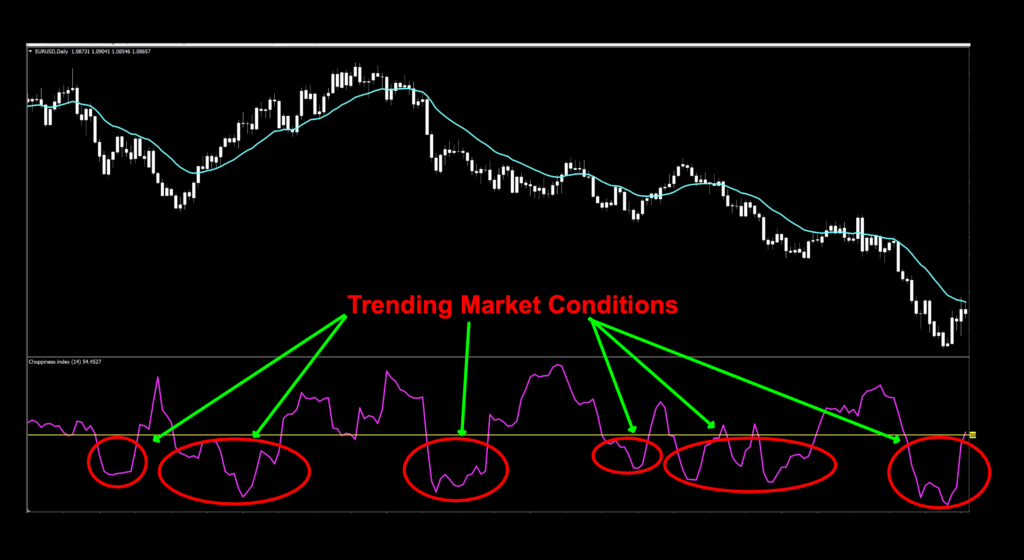
Let’s take a look at a portion of a marked up chart to see how all this peculiar indicator works.
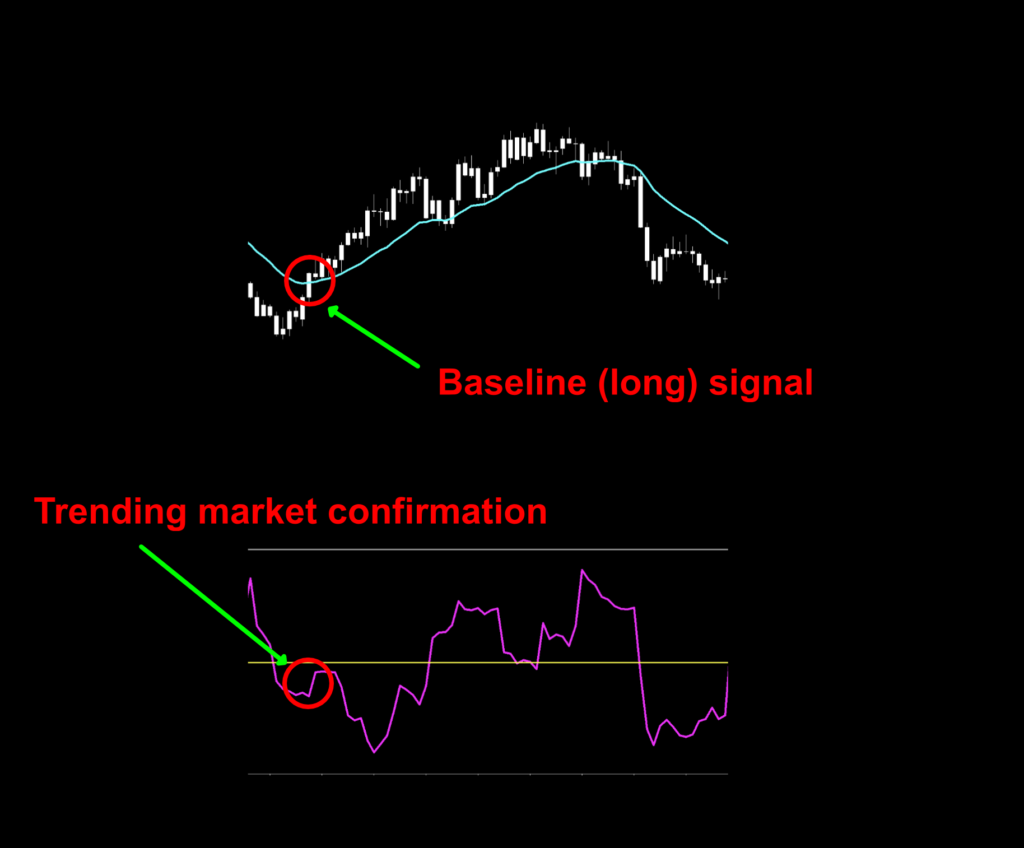
Once the market begins to trend (below the midline), you can start qualifying your other signals. What’s interesting is that this indicator appears to decipher the market as trending before the actual baseline signal. That’s a pretty good “heads up”.
Recap on Use
Trade – When the signal line crosses and CLOSES below the midline AND your other indicators agree, the trade would be opened on the open of the next candle.
NO Trade – When the candle crosses AND CLOSES above the signal line. Wait until conditions change to “Trade”.
Testing the Choppiness Index
If you’re new to these studies, we recommend looking at some of the older blogs to understand how we conduct our testing.
The six pairs we recommend testing are…
EUR/USD
AUD/NZD
EUR/GBP
AUD/CAD
CHF/JPY
CAD/SGD
The markets we test our indicators are the:
EUR/USD (Euro/US Dollar)
BTC/USD (Bitcoin/US Dollar)
XAU/USD (Gold/US Dollar)
SPX500 (S&P500 Index)
Timeframes and Results
We’ll run the Choppiness Index indicator on the EUR/USD, BTC/USD, XAU/USD, and the SPX500 using the default and tweaked settings across the daily and 4-hour timeframes on the MT4 strategy tester.
We focus on three metrics;
Total trades
Win/Loss ratio
ROI (return on investment)
The Results Are In
Below are the spreadsheets from our tests.
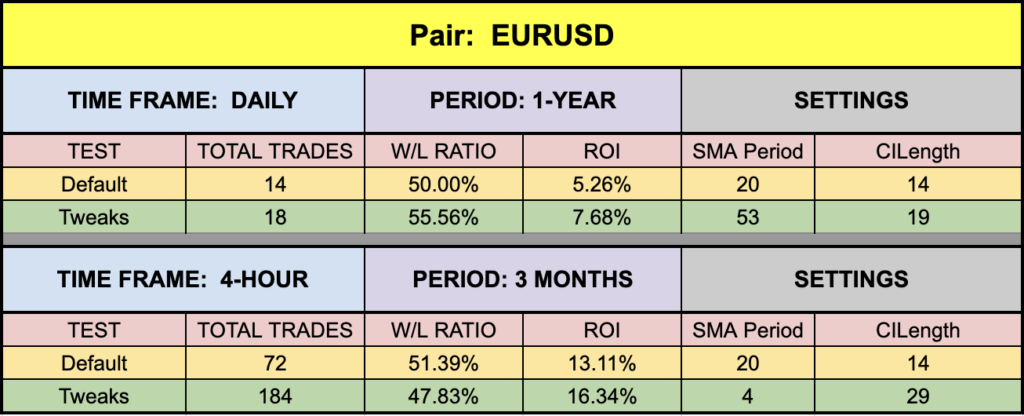
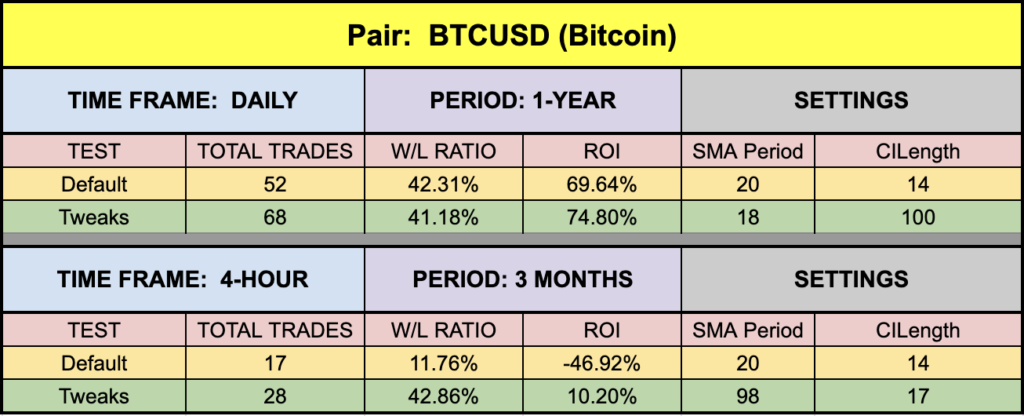
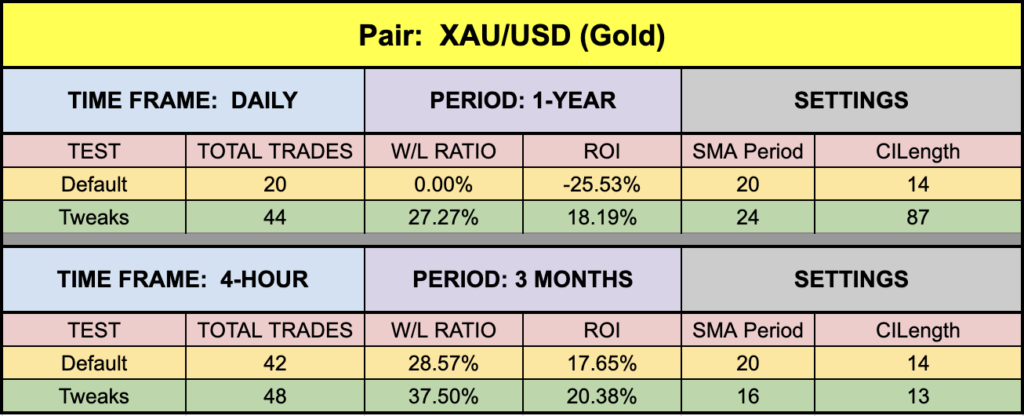
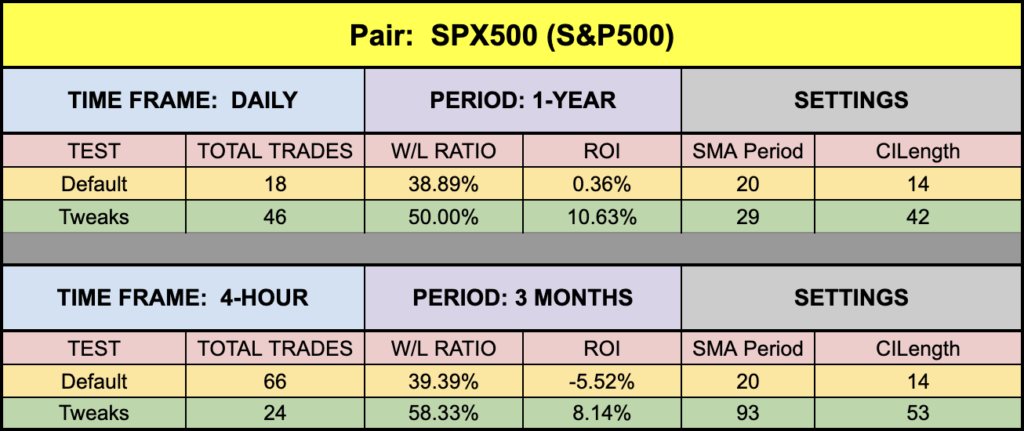
The green highlighted rows are the tweaks we applied to both the indicators as a combination. They are not fully optimized values as they change every day and therefore would make no sense. We’re just demonstrating indicators which can be made better. The settings are not to be considered trading advice. They are for educational and illustrative purposes only.
Please never use just one indicator to make your trading decisions. Always have an algorithm, or system, to raise your trade confidence and increase the odds of closing a trade in profit.
Money Management
Money management is based on the NNFX risk profile. That information can be learned in the Advanced Course.
Resources
We’ve made the Choppiness Index indicator available for download on our site from the indicator library. When you’re ready to get it, click HERE.
We’re Here For You
Sign up on our contacts page on the website for the latest digests. Subscribe to our YouTube channel and Facebook page. We also answer questions on Quora related to Forex. Visit Trustpilot to see what others are saying about us as well.
Our only goal is to make you a better trader.
BTW – Any information communicated by Stonehill Forex Limited is solely for educational purposes. The information contained within the courses and on the website neither constitutes investment advice nor a general recommendation on investments. It is not intended to be and should not be interpreted as investment advice or a general recommendation on investment. Any person who places trades, orders or makes other types of trades and investments etc. is responsible for their own investment decisions and does so at their own risk. It is recommended that any person taking investment decisions consults with an independent financial advisor. Stonehill Forex Limited training courses and blogs are for educational purposes only, not a financial advisory service, and does not give financial advice or make general recommendations on investment.