
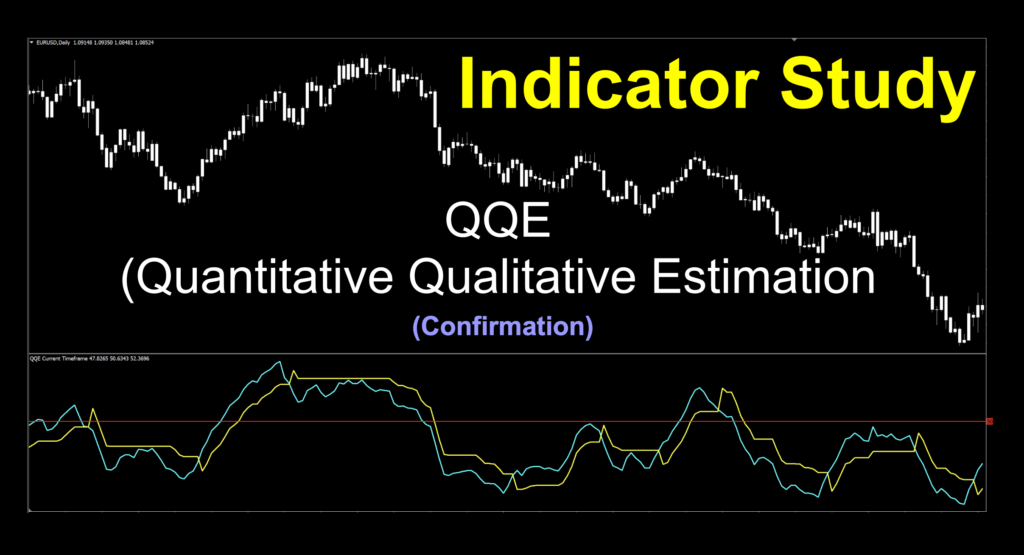
QQE (Quantitative Qualitative Estimation)
If you’d like to follow along with the e-book version of the blog, click on the play button in the audio player at the top of the page.
 Quirky Quality Excellence
We’re guessing that heading makes no sense…and you’re probably right. I’ll bet you can’t say it ten times fast. You tried, right? Anyway…let’s get to it. We’ve got our first subscriber requested indicator as a bonus blog. VP won’t be profiling it on the series due to its widespread use, but we’ll make our analysis video for those interested in checking it out – especially for newer traders. After all, this indicator is going to be new to some of you…ammirite?
Let’s Visit a Friend
So, what is this mystery indicator? None other than the QQE; or Quantitative Qualitative Estimation indicator. This beauty is based on Welles Wilder’s RSI…but different. This is another smoothed version of an indicator that calculates the absolute value of the change in RSI values between calculated bars and averaged twice. Pretty slick!
Double the Fun
We’re going to look at a version suggested by a user in this blog. We did find multiple variations, and the appearances can range from the simple to somewhat involved. That being said, we’ll try to keep it on the simple side because life is involved enough. This version was submitted by Will via the indicator email. Thank you for including the file as well!
Let’s take a few minutes to see how this alternate version reacts to price action and mark off some entries for comparative studies. When you’ve watched it, come on back to read the remainder and see the results!
Alternate Alternative
We’ll take a look at this version of the indicator using the default settings. We changed the colors from the default values for better visualization. Candles are white to focus our attention on the indicator and leave price bias behind.
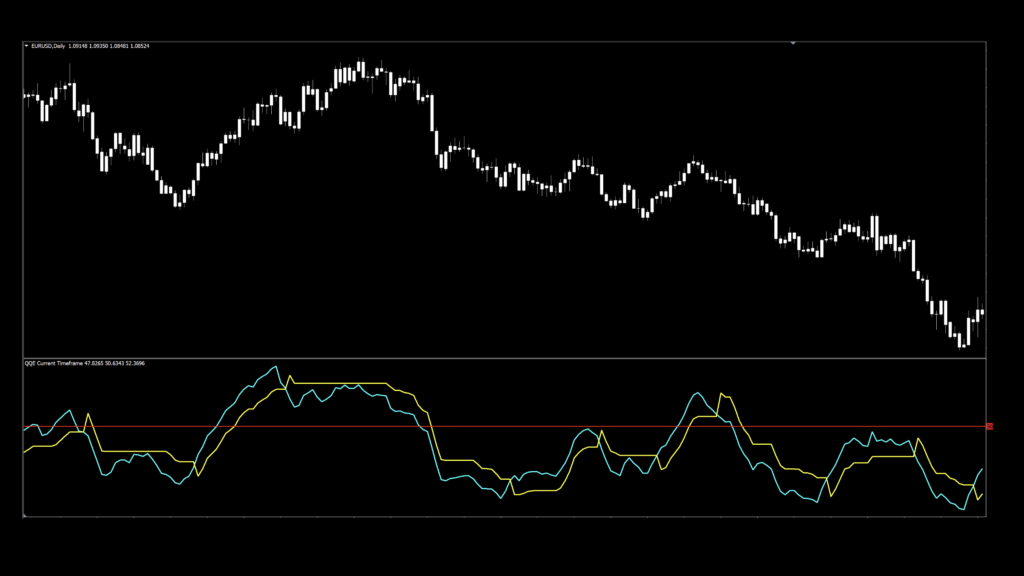
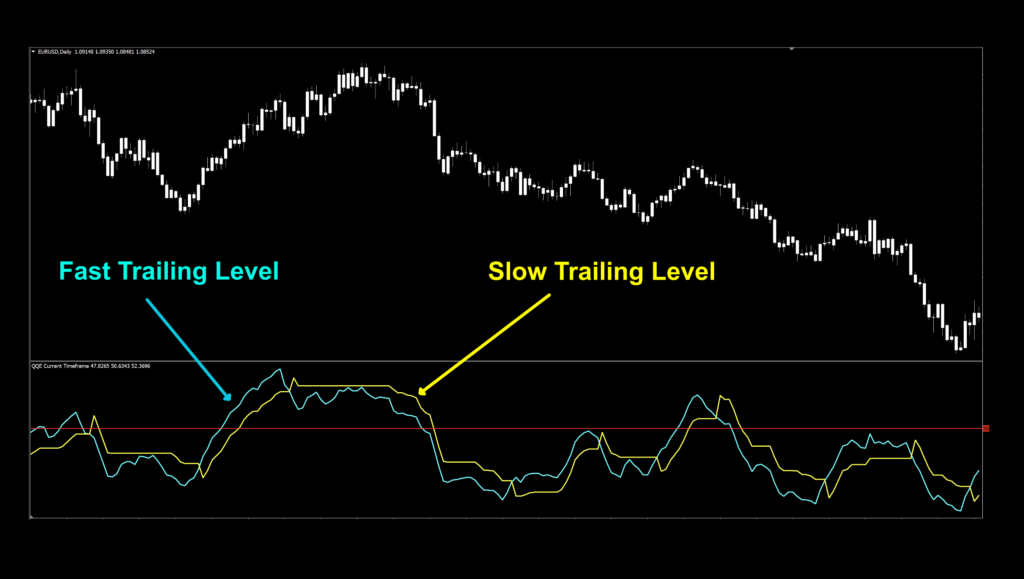
Let’s break down what we’re looking at here. There are two lines (aqua/yellow) which are called “trailing levels” One is fast (aqua) and one is slow (yellow). The levels are calculated using the ATR of smoothed RSI over a specified number of periods and then smoothing it further using an additional Wilders smoothing function. Once that part of the calculation is complete, those results are multiplied by the fast and slow ATR multipliers to calculate the levels (lines). So glad we don’t have to plot this by hand!
Before we get into the mark-up, let’s go over the settings.
Settings
Among the MANY settings available, we only need to concern ourselves with one. So nice!
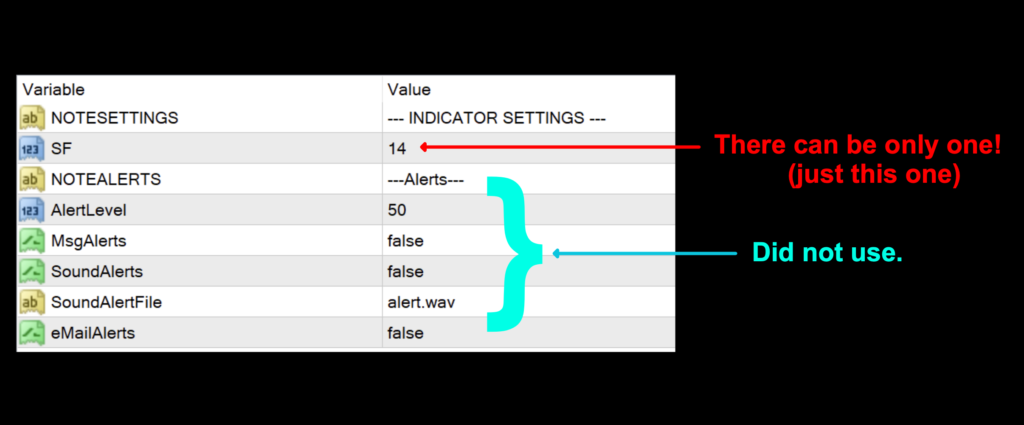
SF (Smoothing): The variable that affects the calculations of the two lines. The default setting is 5.
OB/OS
As many indicators are designed, especially oscillating indicators, there are suggestions to use them as an overbought and oversold tool by placing additional levels in the indicator window. That’s fine, if you trade that way, but we don’t. “Why not, sir?” Glad you asked. Because we cannot determine what actually constitutes overbought and oversold in a currency pair. It’s not a “thing”.
Cosmik Debris

I had to pull that reference to Frank Zappa’s song again. Remember, we are not wizards and no matter how big your crystal ball is, you never know when price reverses. Currency prices can move literally thousands of pips. It has before, probably will again. Just trade what you see.
Advantages
* Provides different options for signals
* Easy to adjust for varying markets.
* Smoothed lines filter out market noise.
Two Line Versus Mid-Line
Let’s see how the two different methodologies compare. The purple circles represent the mid-line cross. We’re taking into account the faster trailing line for our testing purposes. The pink circles represent the two line cross.
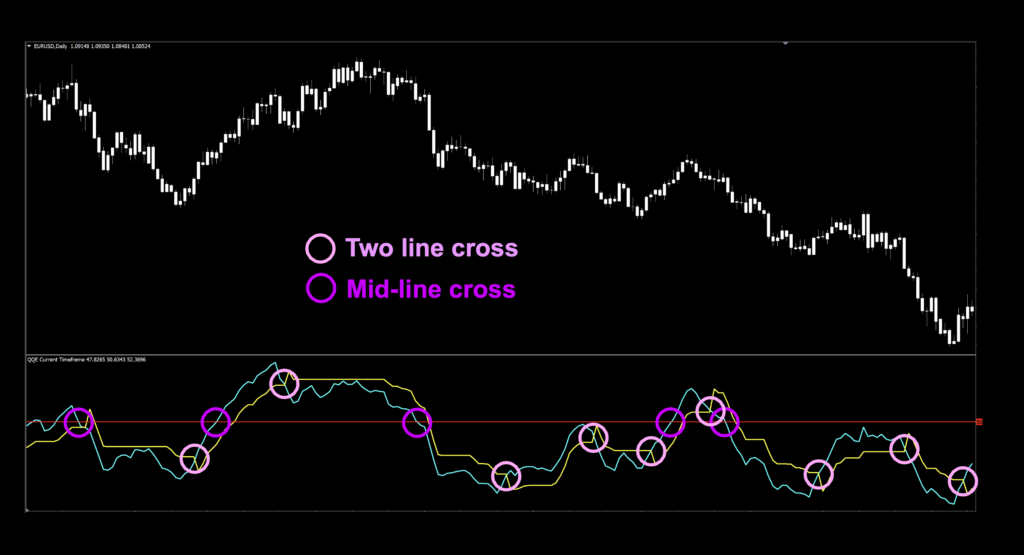
Both methodologies appear to give pretty decent signals. At first glance, it appears that the zero cross may keep you in trade longer, while the two lines cross is more reactive to change in direction of price. We’ll see how testing plays out.
How We Use It
Long signal:
Two line cross: when the aqua line crosses and closes over the yellow line. The entry occurs on the open of the next candle.
Mid-line cross: When the aqua line crosses and closes over the zero-line. The entry occurs on the open of the next candle.
Short signal:
Two line cross: when the yellow line crosses and closes over the aqua line. The entry occurs on the open of the next candle.
Mid-line cross: When the aqua line crosses and closes below the zero-line. The entry occurs on the open of the next candle.
Testing the QQE
We’re going to do something for the first time – test the same indicator two different ways; as a two lines cross, then as a mid-line cross.
If you’re new to these studies, we recommend looking at some of the older blogs to understand how we conduct our testing.
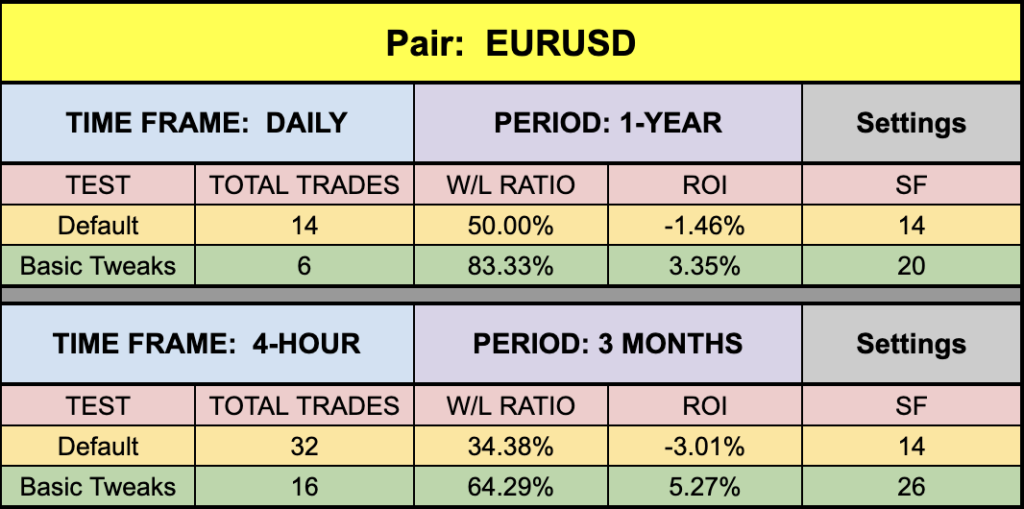
The six pairs we recommend testing are…
EUR/USD
AUD/NZD
EUR/GBP
AUD/CAD
CHF/JPY
CAD/SGD
The markets we test our indicators are the:
EUR/USD (Euro/US Dollar)
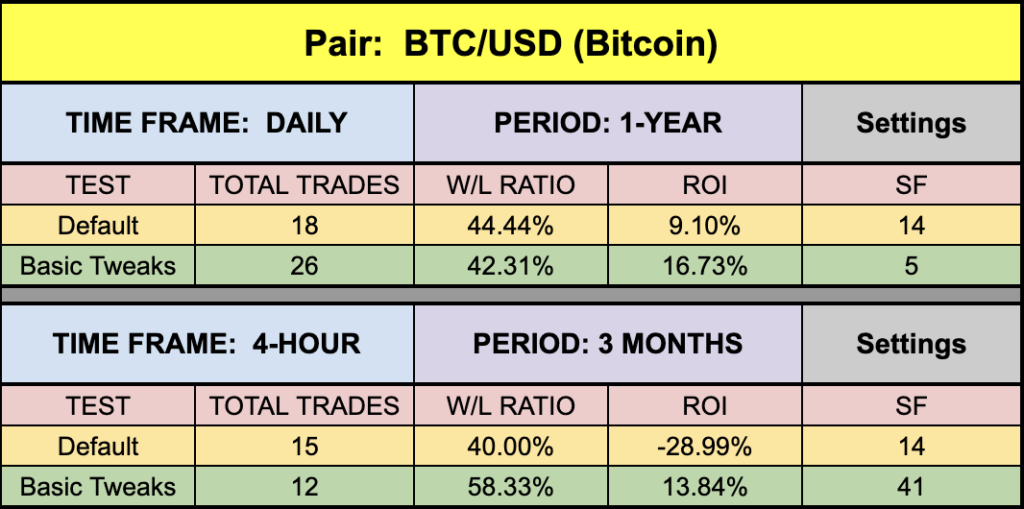
BTC/USD (Bitcoin/US Dollar)
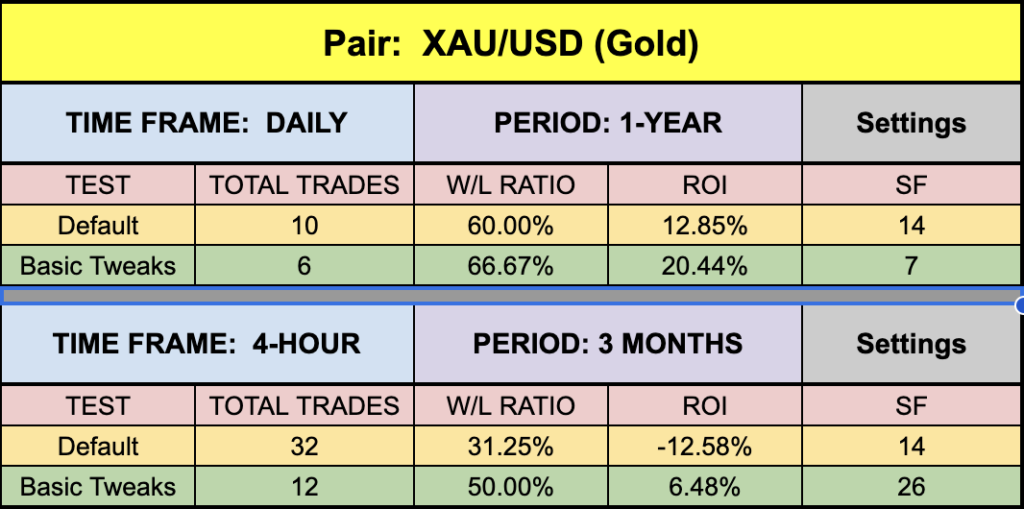
XAU/USD (Gold/US Dollar)
SPX500 (S&P500 Index)
Timeframes and Results
We’ll run the QQE indicator on the EUR/USD, BTC/USD, XAU/USD, and the SPX500 using the default and tweaked settings across the daily and 4-hour timeframes on the MT4 strategy tester.
We focus on three metrics;
Total trades
Win/Loss ratio
ROI (return on investment)
What We Got
Below are the spreadsheets from our tests.
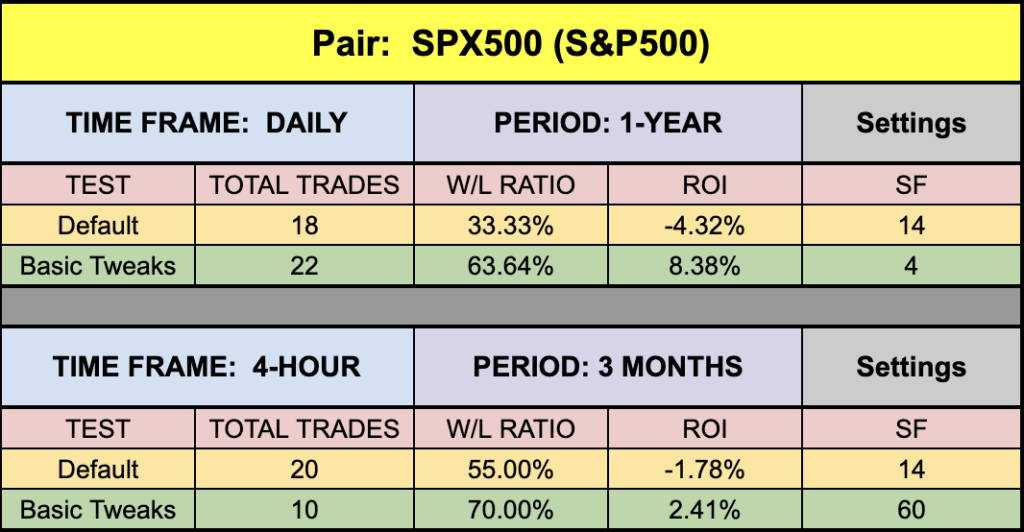
And below here are the results of the QQE tested as a mid-line cross.

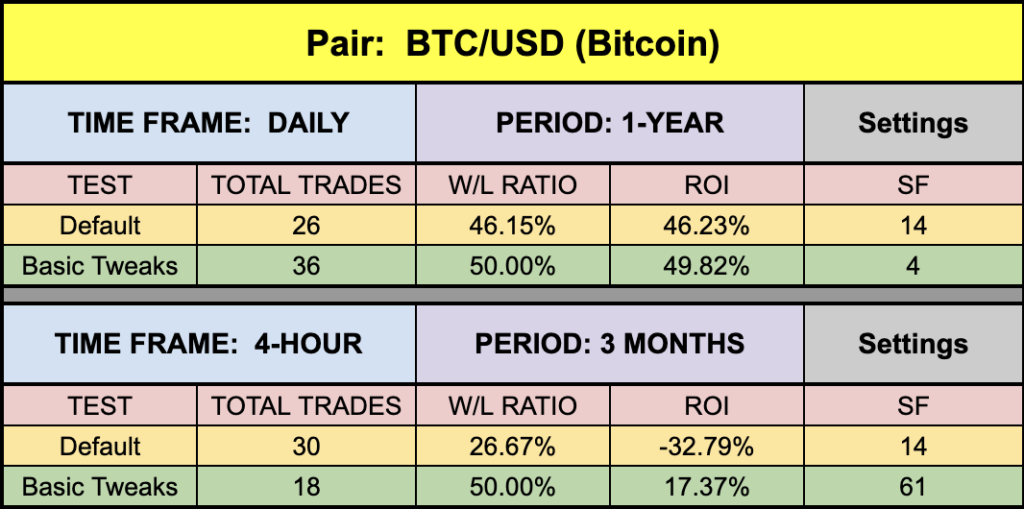
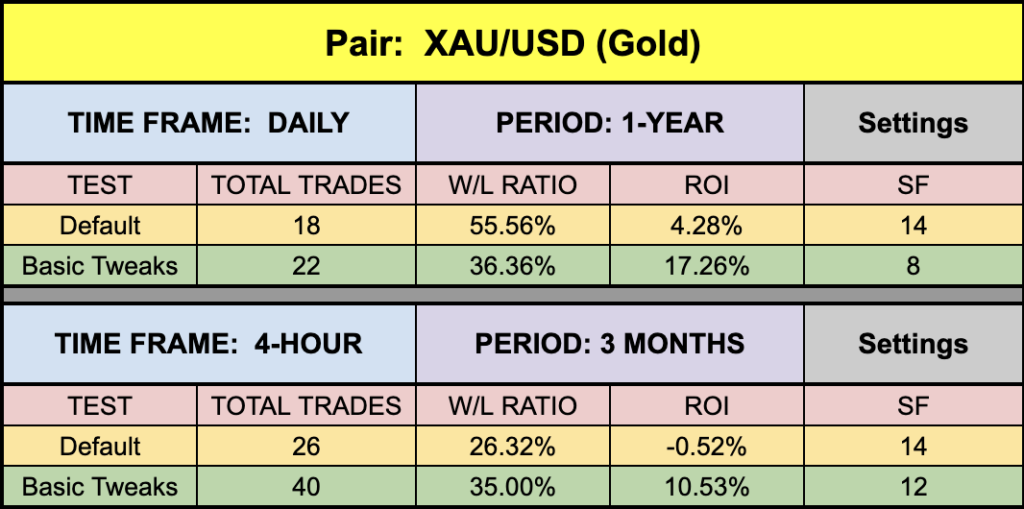
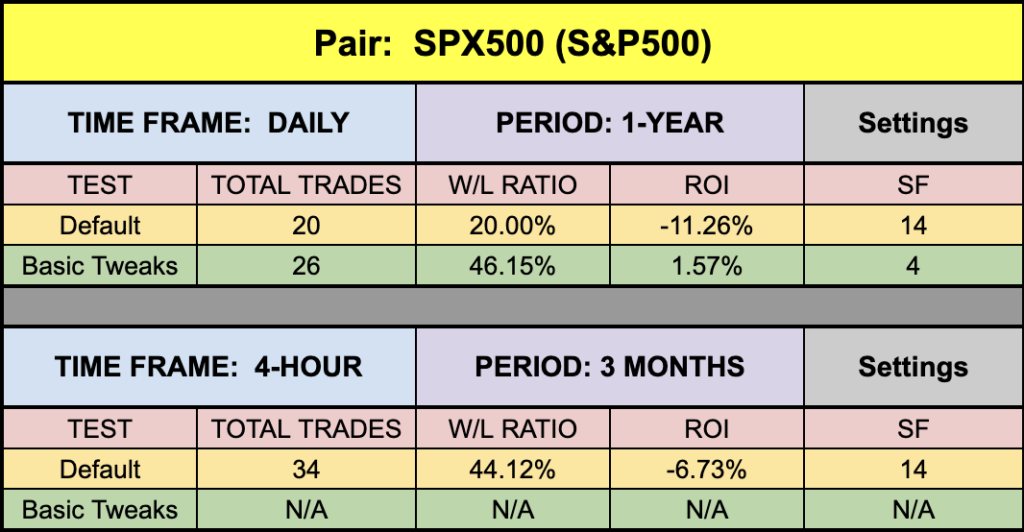
Analysis
As we always like to mention, green highlighted rows are the tweaks we found which returned better results – but we never post fully optimized tweaks because numbers change every day. We’re just demonstrating indicators which can be made better. The settings are not to be considered trading advice – they are for educational and illustrative purposes only.
And most importantly, do not ever use just one indicator to make your trading decisions. Always have a proven algorithm in place for better trading odds.
Money Management
Money management is based on the NNFX risk profile. That information can be learned in the Advanced Course.
Resources
We’ve made the QQE indicator available for download on our site from the indicator library. When you’re ready to get it, click HERE.
We’re Here For You
Sign up on our contacts page on the website for the latest digests. Subscribe to our YouTube channel and Facebook page. We also answer questions on Quora related to Forex. Visit Trustpilot to see what others are saying about us as well. Consider giving us a 5-star review if we’ve helped you. Your contribution helps others find us for a safe place to learn.
Our only goal is to make you a better trader.
BTW – Any information communicated by Stonehill Forex Limited is solely for educational purposes. The information contained within the courses and on the website neither constitutes investment advice nor a general recommendation on investments. It is not intended to be and should not be interpreted as investment advice or a general recommendation on investment. Any person who places trades, orders or makes other types of trades and investments etc. is responsible for their own investment decisions and does so at their own risk. It is recommended that any person taking investment decisions consults with an independent financial advisor. Stonehill Forex Limited training courses and blogs are for educational purposes only, not a financial advisory service, and does not give financial advice or make general recommendations on investment.