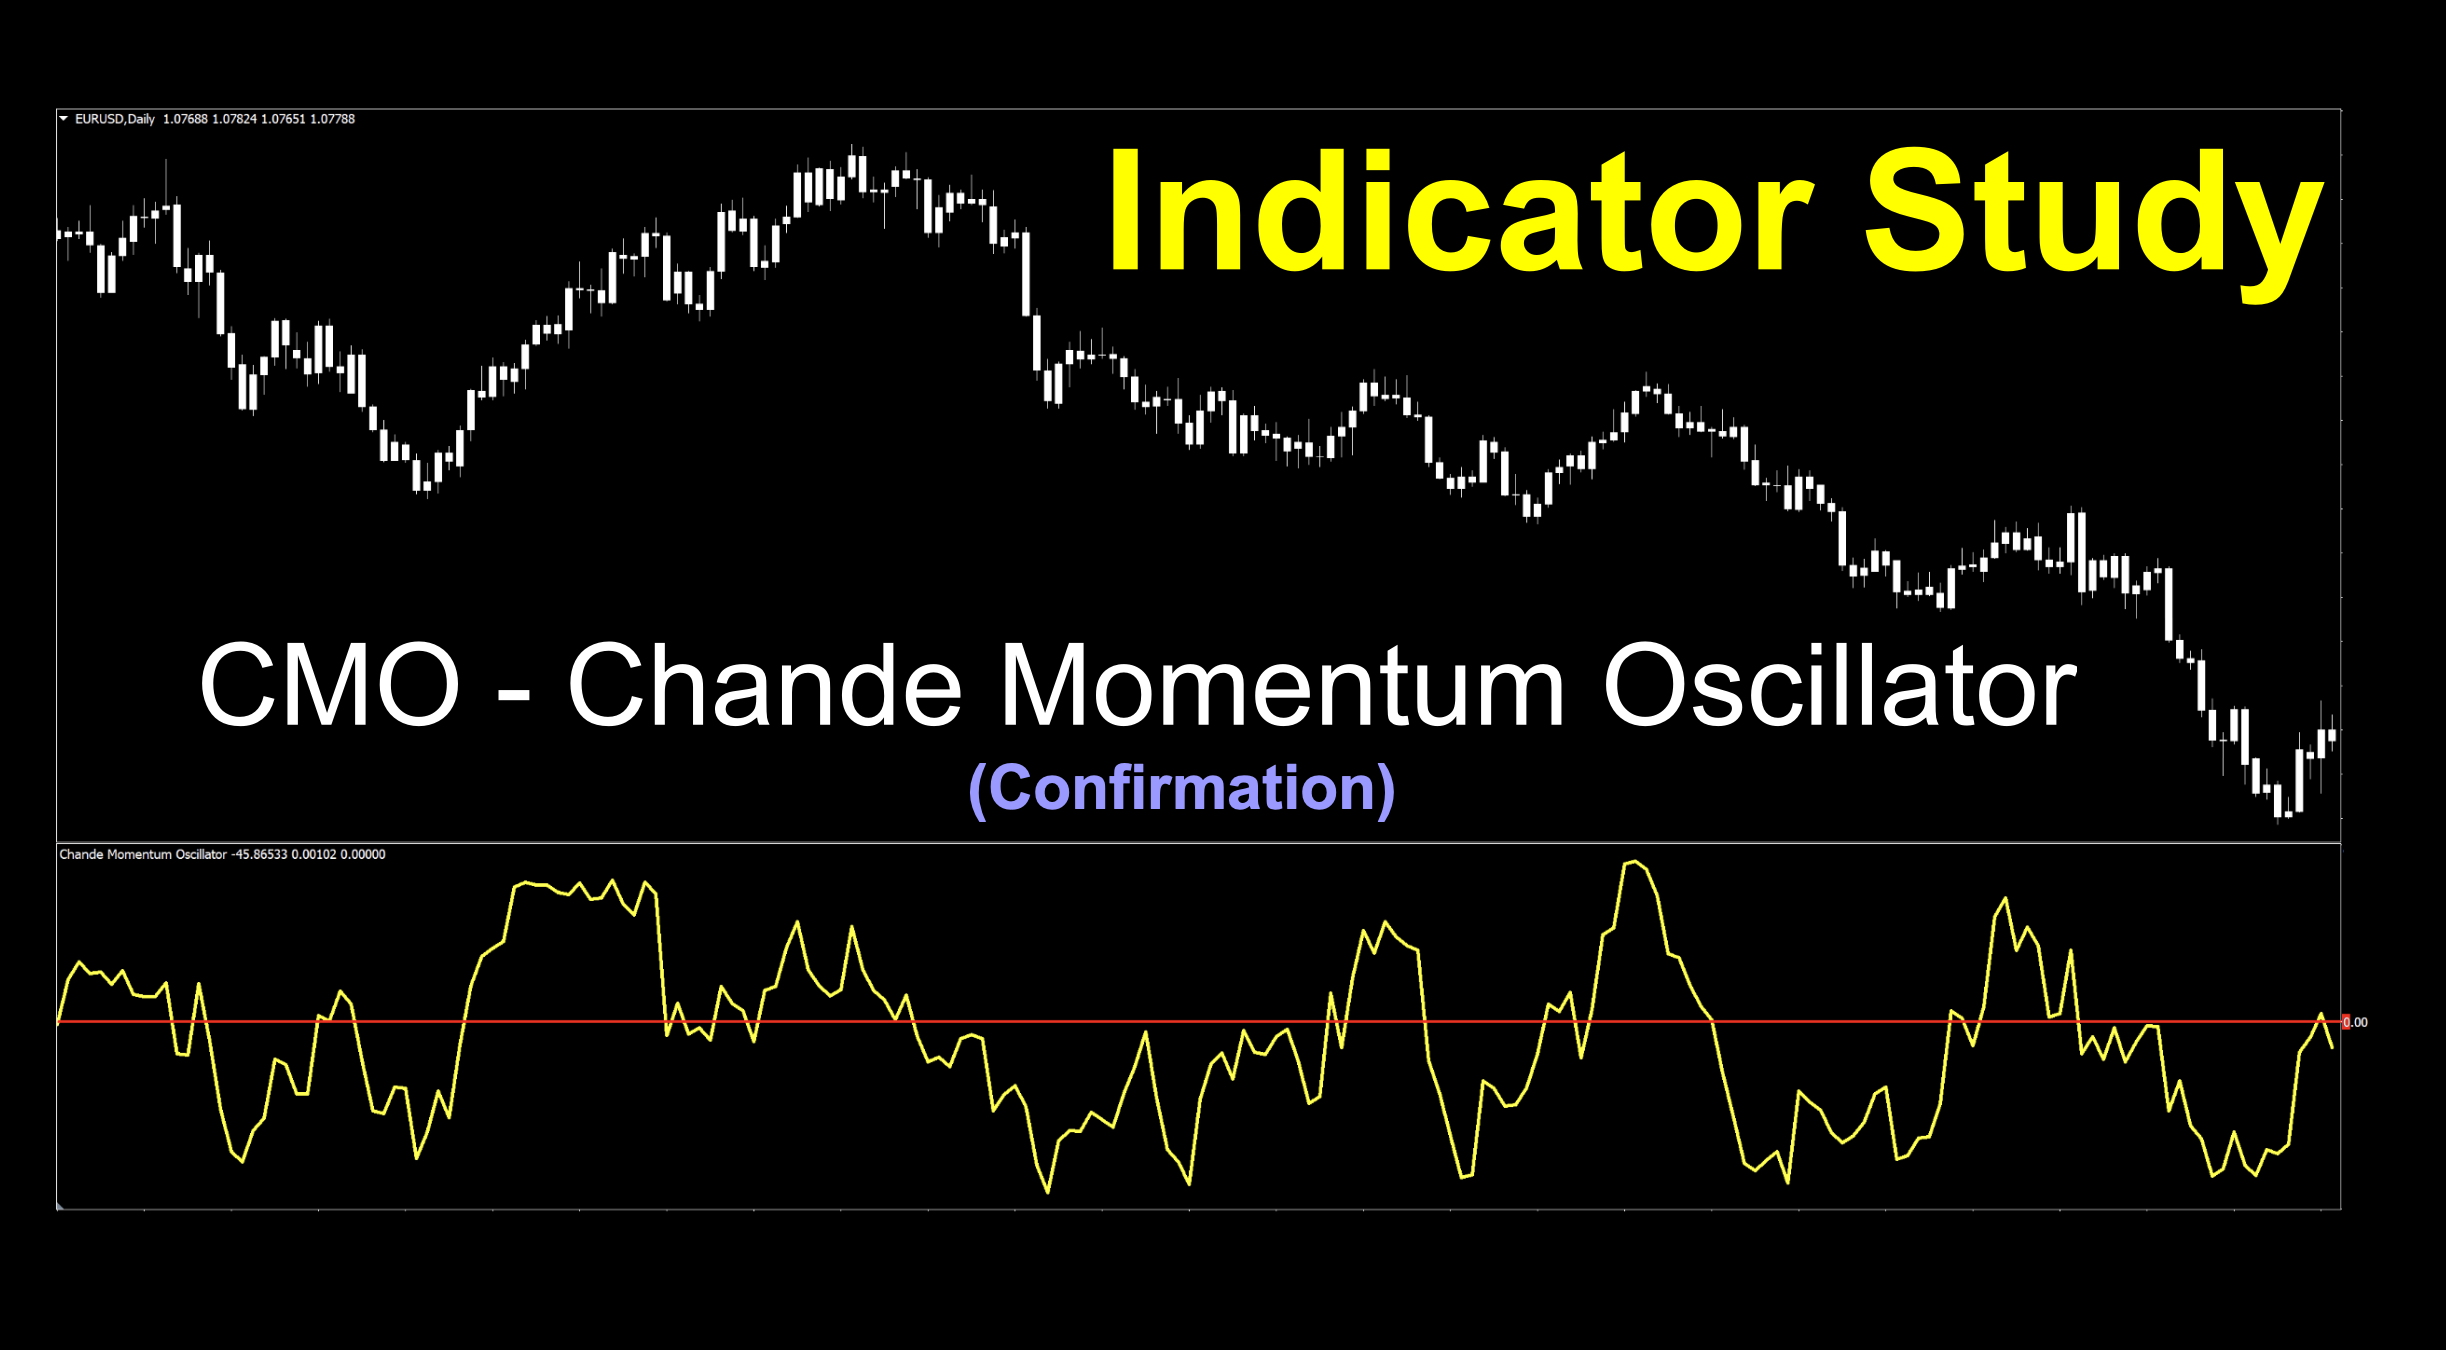
CMO (Chande Momentum Oscillator)
If you’d like to follow along with the e-book version of the blog, click on the play button in the audio player above, at the top of the page.

Mass and Velocity
Welcome to ninth grade physics. Just kidding. But really, understanding what momentum is can actually be helpful to the trader. Without it, markets can range, become volatile, and quickly reverse without warning…kind of like an angry toddler. We want momentum. We need momentum. Momentum is what gives price its mass and velocity to keep moving in the same direction, hopefully for long extended trends. Momentum is our friend.
You Again? Awesome!
We’re going to take a look at a zero-cross indicator called the Chande Momentum Oscillator, developed by Tushar Chande in 1994 and discussed in his book, “The New Technical Trader. Coincidently, we showcased another indicator by Mr. Chande nearly a year ago called VIDYA; a baseline indicator.
Finding the Delta
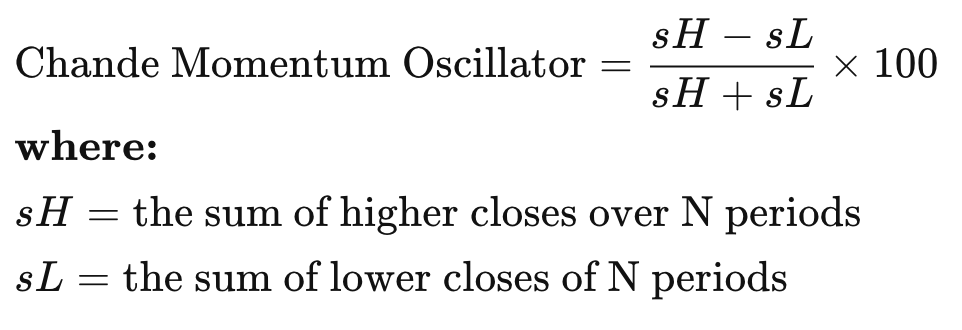
The essence of the CMO is that it calculates the difference between the sum of recent gains and the sum of recent losses, then divides the result by the sum of all price movements over the same period. Nice, right? Below is the math for those inclined to ponder.
Birds of a Feather
CMO finds itself in the company of similar indicators such as Wilder’s RSI and Appel’s Stochastic Oscillator; however, it measures momentum on both up and down days and, unlike some of the newer indicators we’ve profiled, does not smooth the results. This can result in frequent signals, especially during periods of dynamic market activity.
Don’t Do It
Like many oscillator users, you will often hear them refer to the dreaded overbought/oversold sentiment of currencies. It’s just not a thing. Believing something is overbought or oversold implies that a baseline value must be present for price comparison. Okay. So tell me, what should that price be to determine whether current price is one or the other. Doesn’t make sense.
We’ll be making the technical analysis video in the next couple of days. We’re still working on a few site affairs, so be sure you’re subscribed to the Stonehill Forex YouTube channel to receive video notification.
Modesty Can Be Beautiful
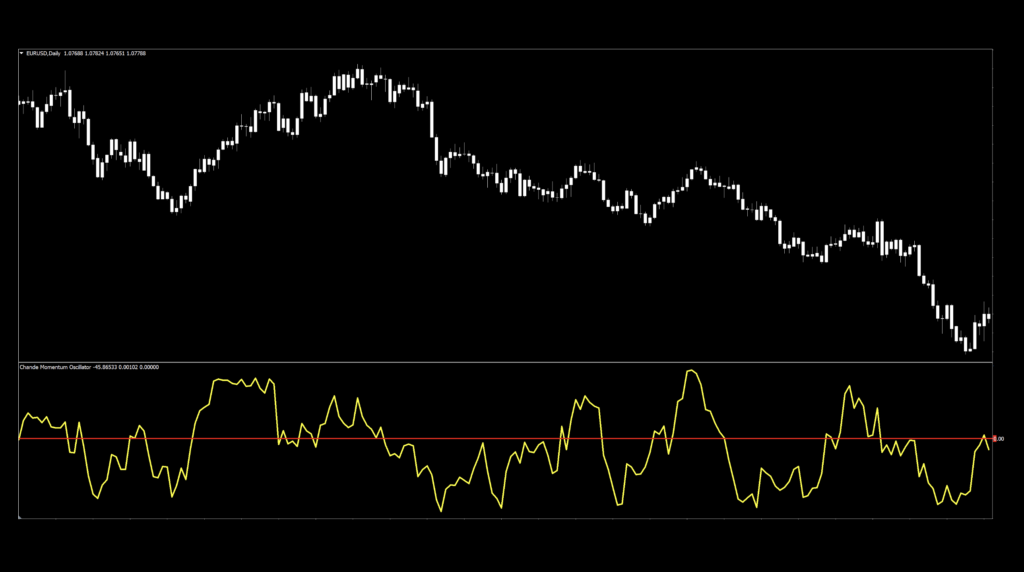
Sometimes, a simple line can tell you a lot. We’ve pretty much left things as they come out of the box, except for making it a bit thicker, so it pops off the screen. Candles are white to focus our attention on the indicator and help those who suffer from price bias.
Before we get into the mark-up, let’s go over the settings.
Settings
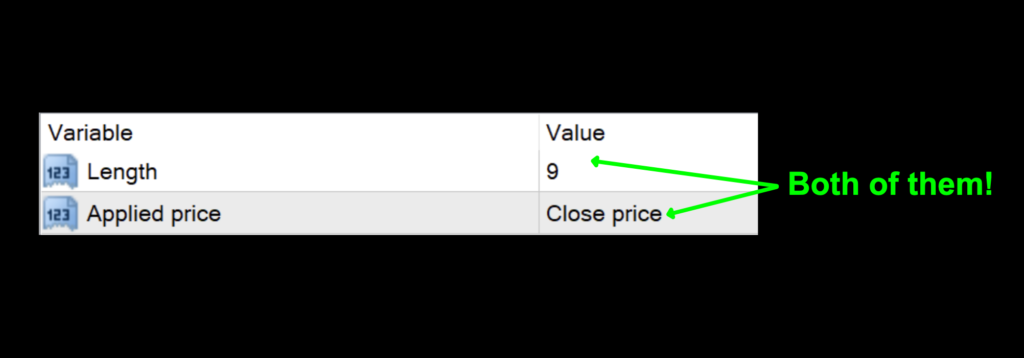
There are two settings which can be adjusted, giving you some degree of control.
Length: The number of periods used in calculating the signal line. The default setting is 9.
Applied Price: This is the specific price data set used for calculating the signal line; 0-Closed, 1-Open, 2-High, 3-Low, 4-Median, 5-Typical, and 6-Weighted. The default value is 0-Closed.
Advantages
* Responds quickly to market change.
* Easy to adjust for varying markets.
* Signal identification is clear.
Show Me The Signals
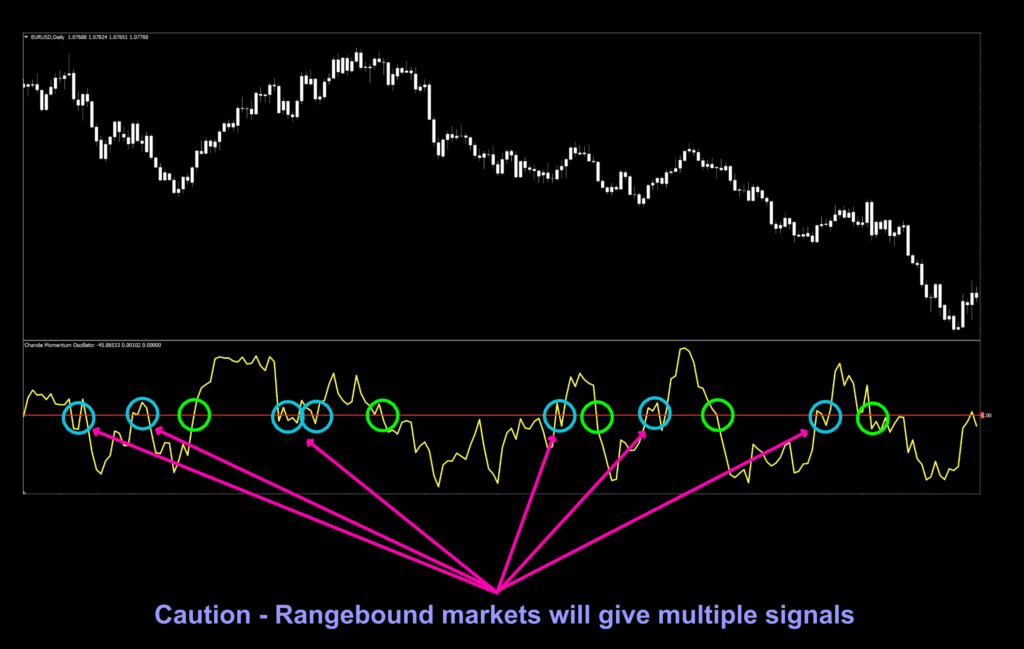
Up, No Down, No Up
The first thing that we noticed, especially on the default settings, was the multiple signals when price became range bound. This will most certainly trip up the novice trader, especially one who does not trade with an algorithm and chooses to make their decisions with a low degree of confidence. You’ll see, in all but one of our tests, we had to increase the length of testing periods to shake out some of the false signals for better results.
How We Use It
Long signal: When the signal line crosses and closes above the zero line, the entry occurs on the open of the next period.
Short signal: When the signal line crosses and closes below the zero line, the entry occurs on the open of the next period.
Testing the CMO Indicator
If you’re new to these studies, we recommend looking at some of the older blogs to understand how we conduct our testing.
The six pairs we recommend testing are…
EUR/USD
AUD/NZD
EUR/GBP
AUD/CAD
CHF/JPY
CAD/SGD
The markets we test our indicators are the:
EUR/USD (Euro/US Dollar)
BTC/USD (Bitcoin/US Dollar)
XAU/USD (Gold/US Dollar)
SPX500 (S&P500 Index)
Timeframes and Results
We’ll run the CMO indicator on the EUR/USD, BTC/USD, XAU/USD, and the SPX500 using the default and tweaked settings across the daily and 4-hour timeframes on the MT4 strategy tester.
We focus on three metrics;
Total trades
Win/Loss ratio
ROI (return on investment)
The Results Are In
Below is the data from our testing.
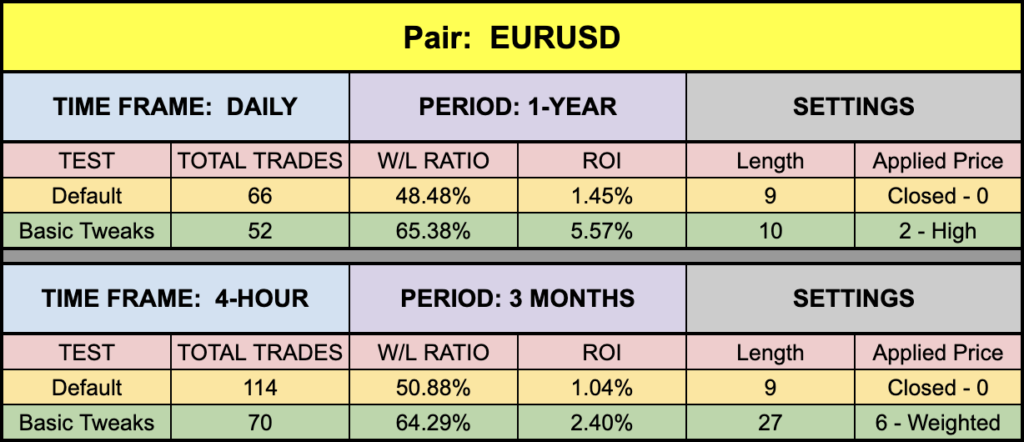
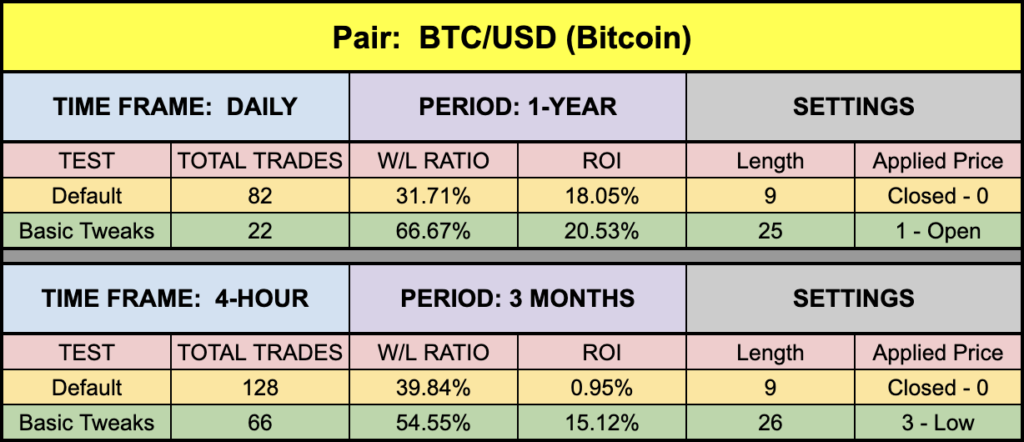
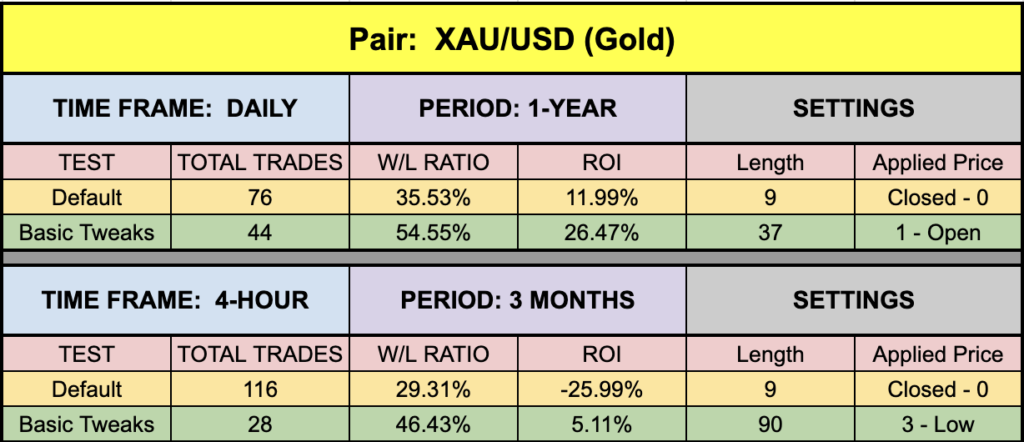
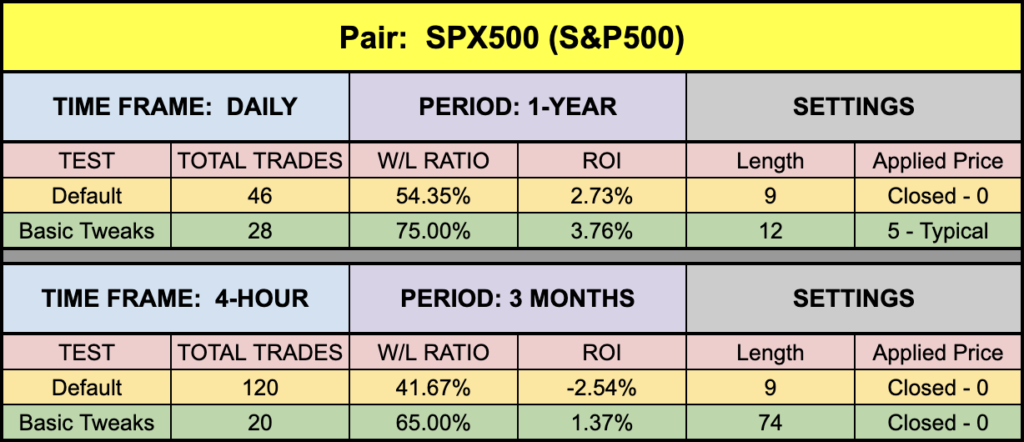
Updated Results
In the spirit of trying to provide relevant information, we opted to retest this indicator through the various markets. What you see is recent and more reflective of what current price action is actually doing. Just a reminder that the highlighted rows are the tweaked values we found which returned better results. We do not post fully optimized values because those values would not represent accurate metrics going forward in time.
Money Management
Money management is based on the NNFX risk profile. That information can be learned in the Advanced Course.
Resources
We’ve made the CMO indicator available for download on our site from the indicator library. When you’re ready to get it, click HERE.
We’re Here For You
Sign up on our contacts page on the website for the latest digests. Subscribe to our YouTube channel and Facebook page. We also answer questions on Quora related to Forex. Visit Trustpilot to see what others are saying about us as well. Consider giving us a 5-star review if we’ve helped you. Your contribution helps others find us for a safe place to learn.
Our only goal is to make you a better trader.
*Our published testing results are based on money management strategies employed by the NNFX system and depend on varying external factors, which may be different between individuals and their specific broker conditions. No guarantee, trading recommendations, or other market suggestions are implied. Your results and subsequent trading activities are solely your own responsibility.
BTW – Any information communicated by Stonehill Forex Limited is solely for educational purposes. The information contained within the courses and on the website neither constitutes investment advice nor a general recommendation on investments. It is not intended to be and should not be interpreted as investment advice or a general recommendation on investment. Any person who places trades, orders or makes other types of trades and investments etc. is responsible for their own investment decisions and does so at their own risk. It is recommended that any person taking investment decisions consults with an independent financial advisor. Stonehill Forex Limited training courses and blogs are for educational purposes only, not a financial advisory service, and does not give financial advice or make general recommendations on investment.