A Long Way To Tipperary
Just a heads-up. This blog will be a bit longer because we wanted to explain a few items we don’t normally get into. But, it’s all good, right?
“Bułka z masłem” – Roll with butter
A Polish expression…meaning that a task or situation is simple, easy kind of sums up our next indicator study. This indicator was one we sort of stumbled upon a couple of months ago. We knocked it around and thought it was worth investigating. It’s even got an international flavor, as we’ll soon see.
Grucha, Not Grouchy
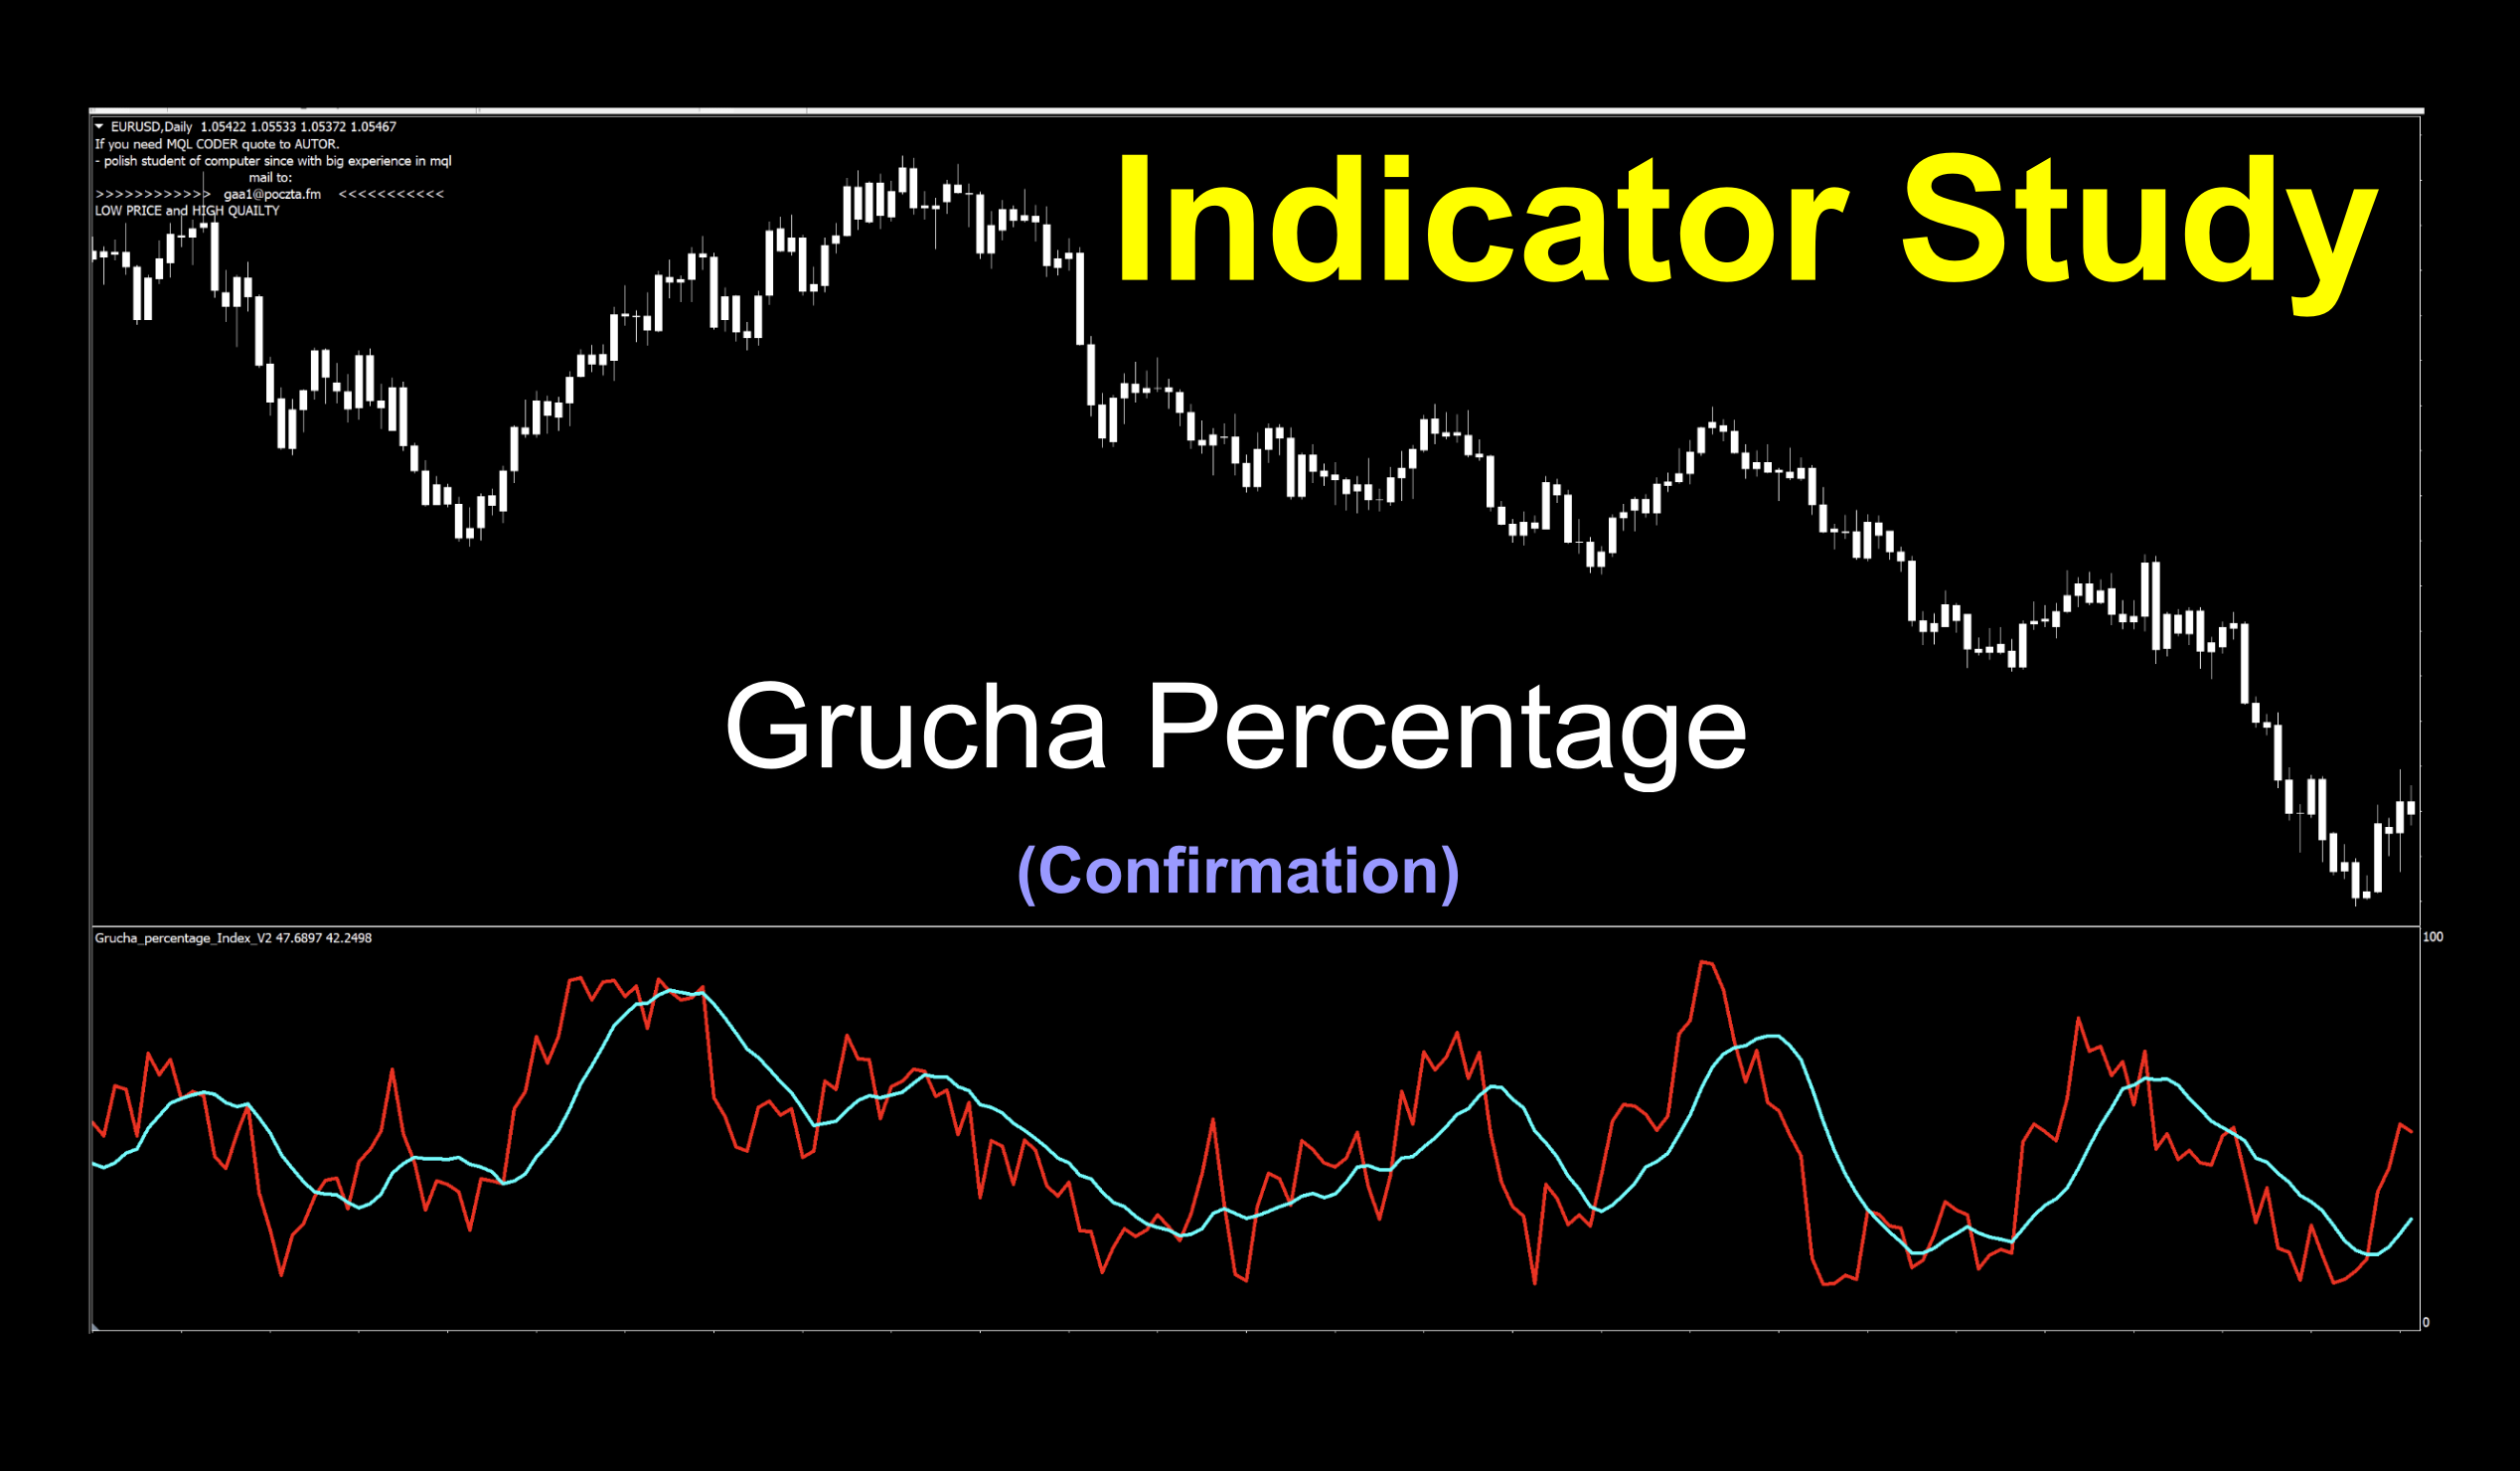
We’ll be looking at an indicator called the Grucha Percentage Index. We wondered what the word “Grucha” was and asked a friend who speaks Polish. She responded that it could mean someone talking, or more specifically “cooing”. So…does that mean this indicator will whisper sweet nothings to you? Perhaps…
Billboards R Us
The indicator was coded by a Polish coder named Grzegorz Antosiewicz in 2011 who coincidentally advertises his skills right on the chart, once it’s loaded up. We found a few other indicators from this developer which we may investigate in future blogs, but we’ll start with this one.
What Does it Do?
Simply stated, “It finds the lowest/highest prices and generates signals by comparing the bulls and bear bars.” Okay, sounds good, let’s keep going.
Confirmation Indicator
This indicator is considered a below chart two-lines cross at first glance, but you know us. We’re always looking at how it might be used differently. We’ll address it a little further down.
Red-White-Blue
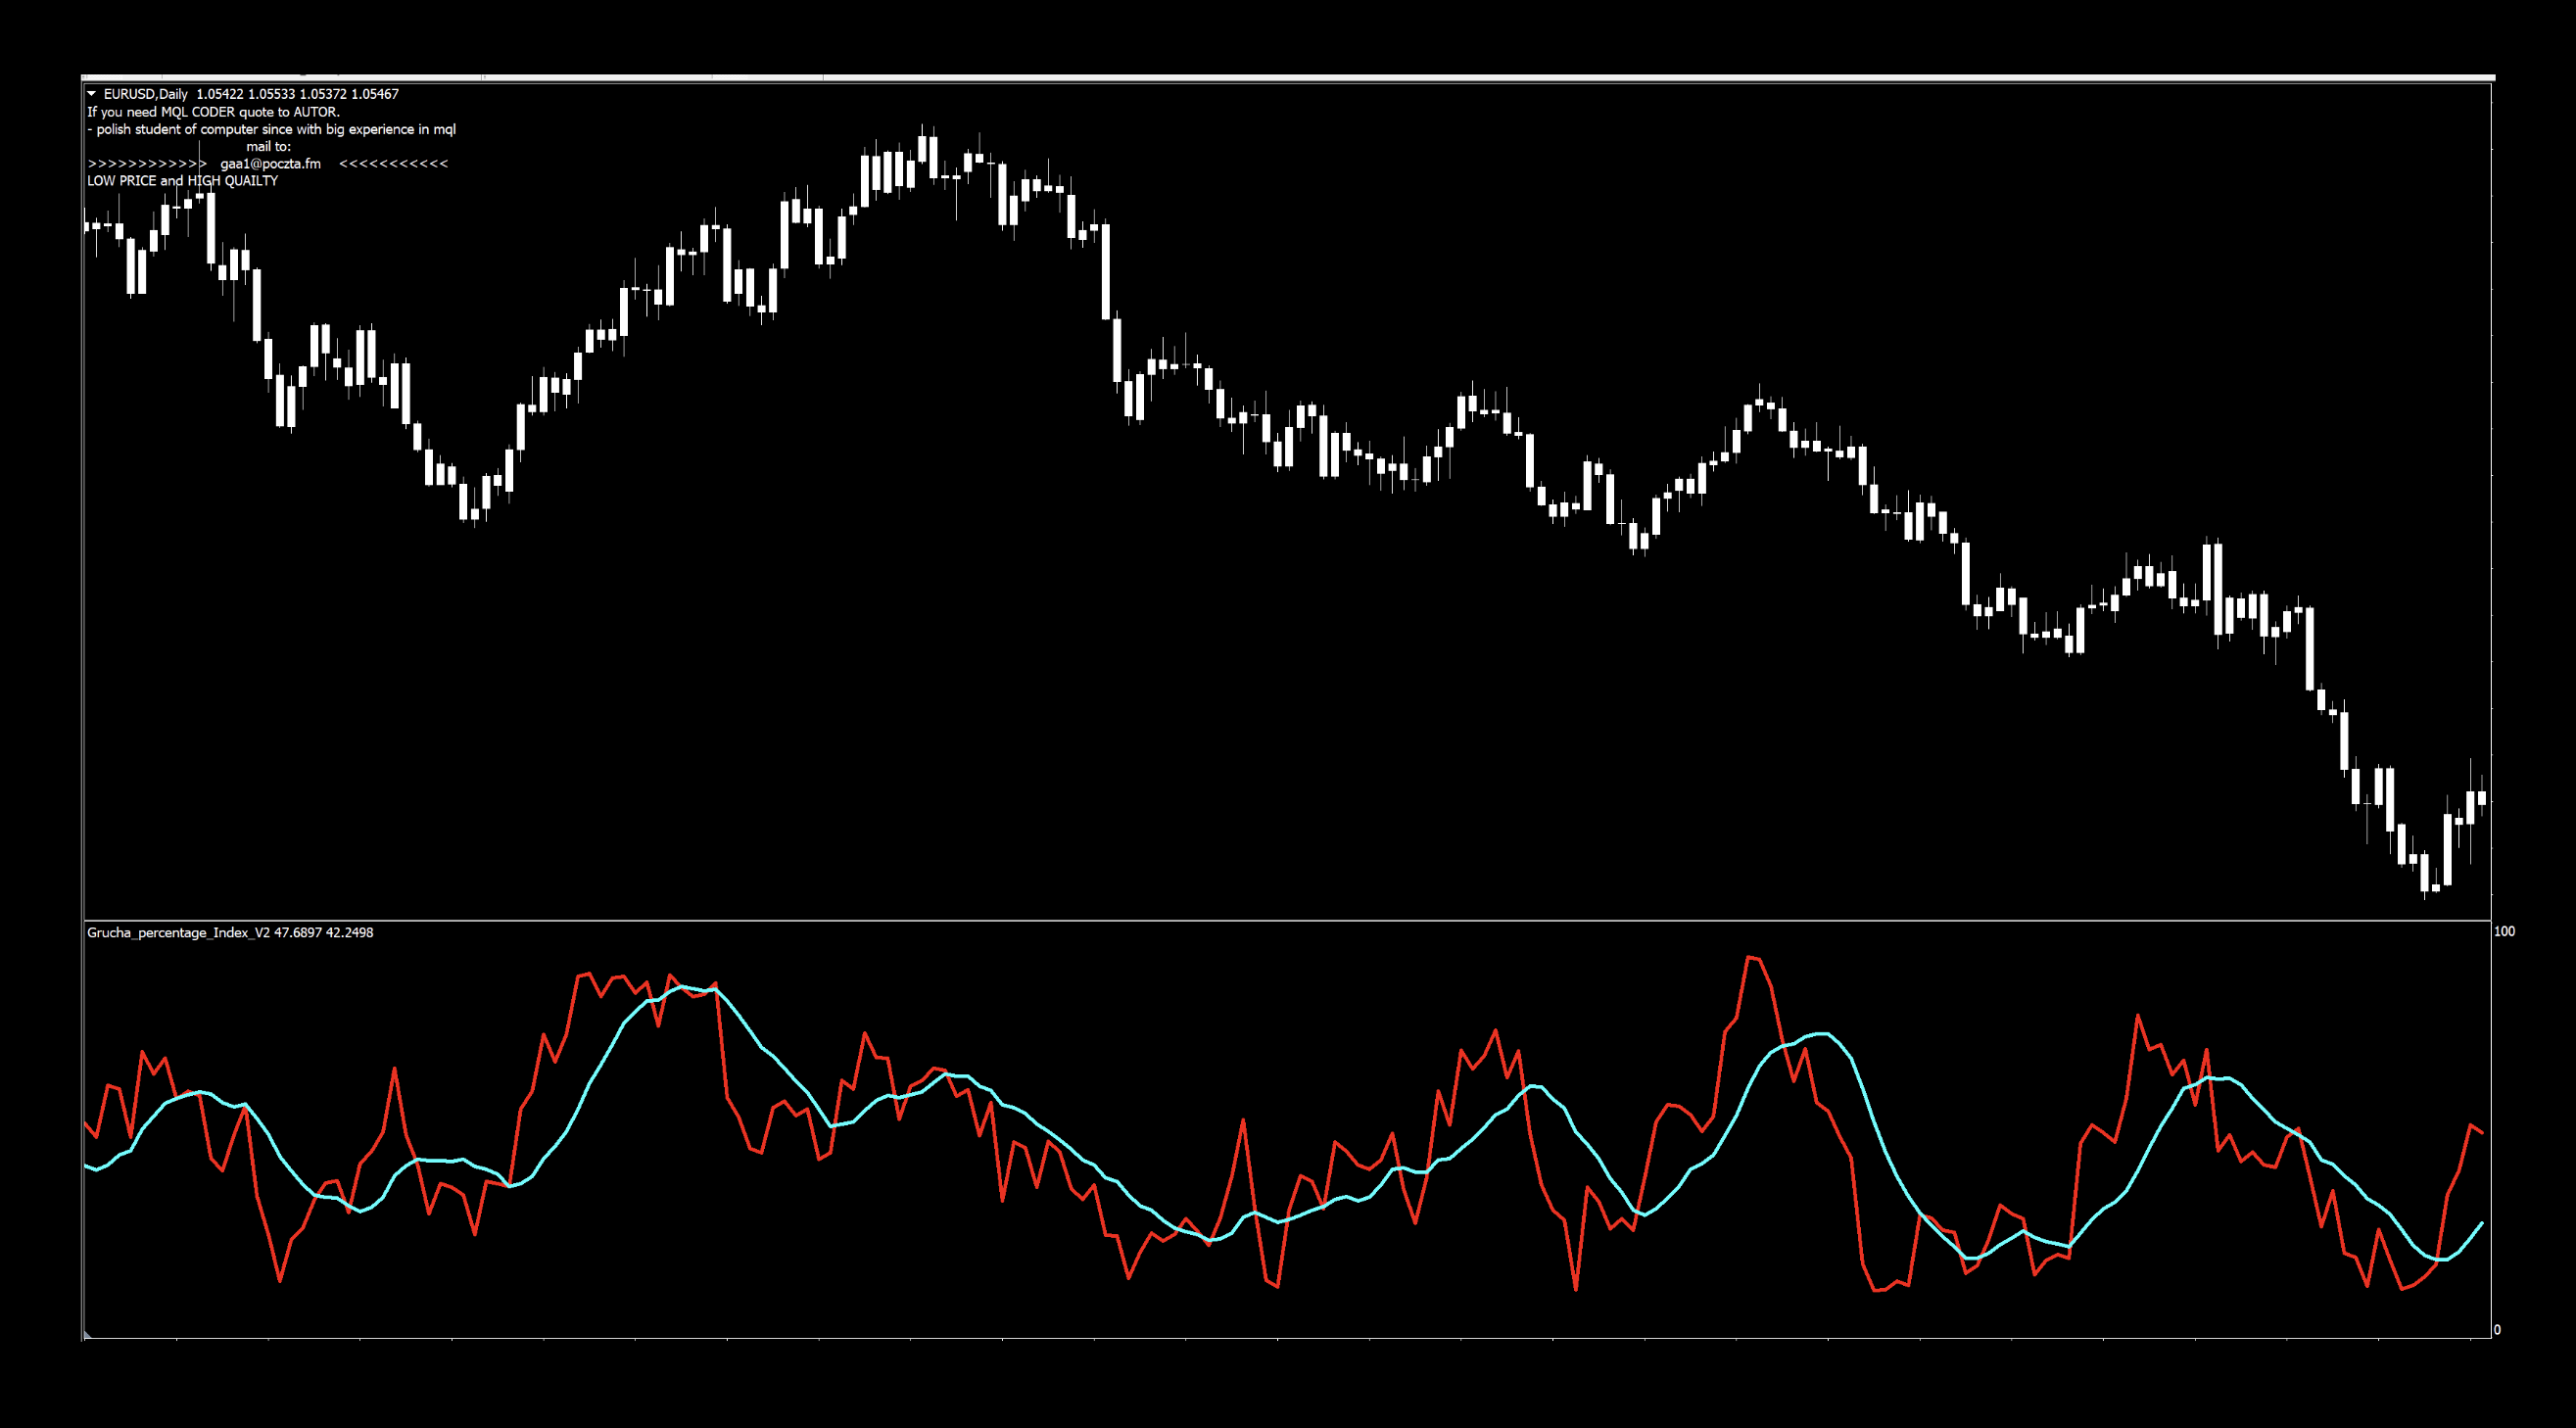
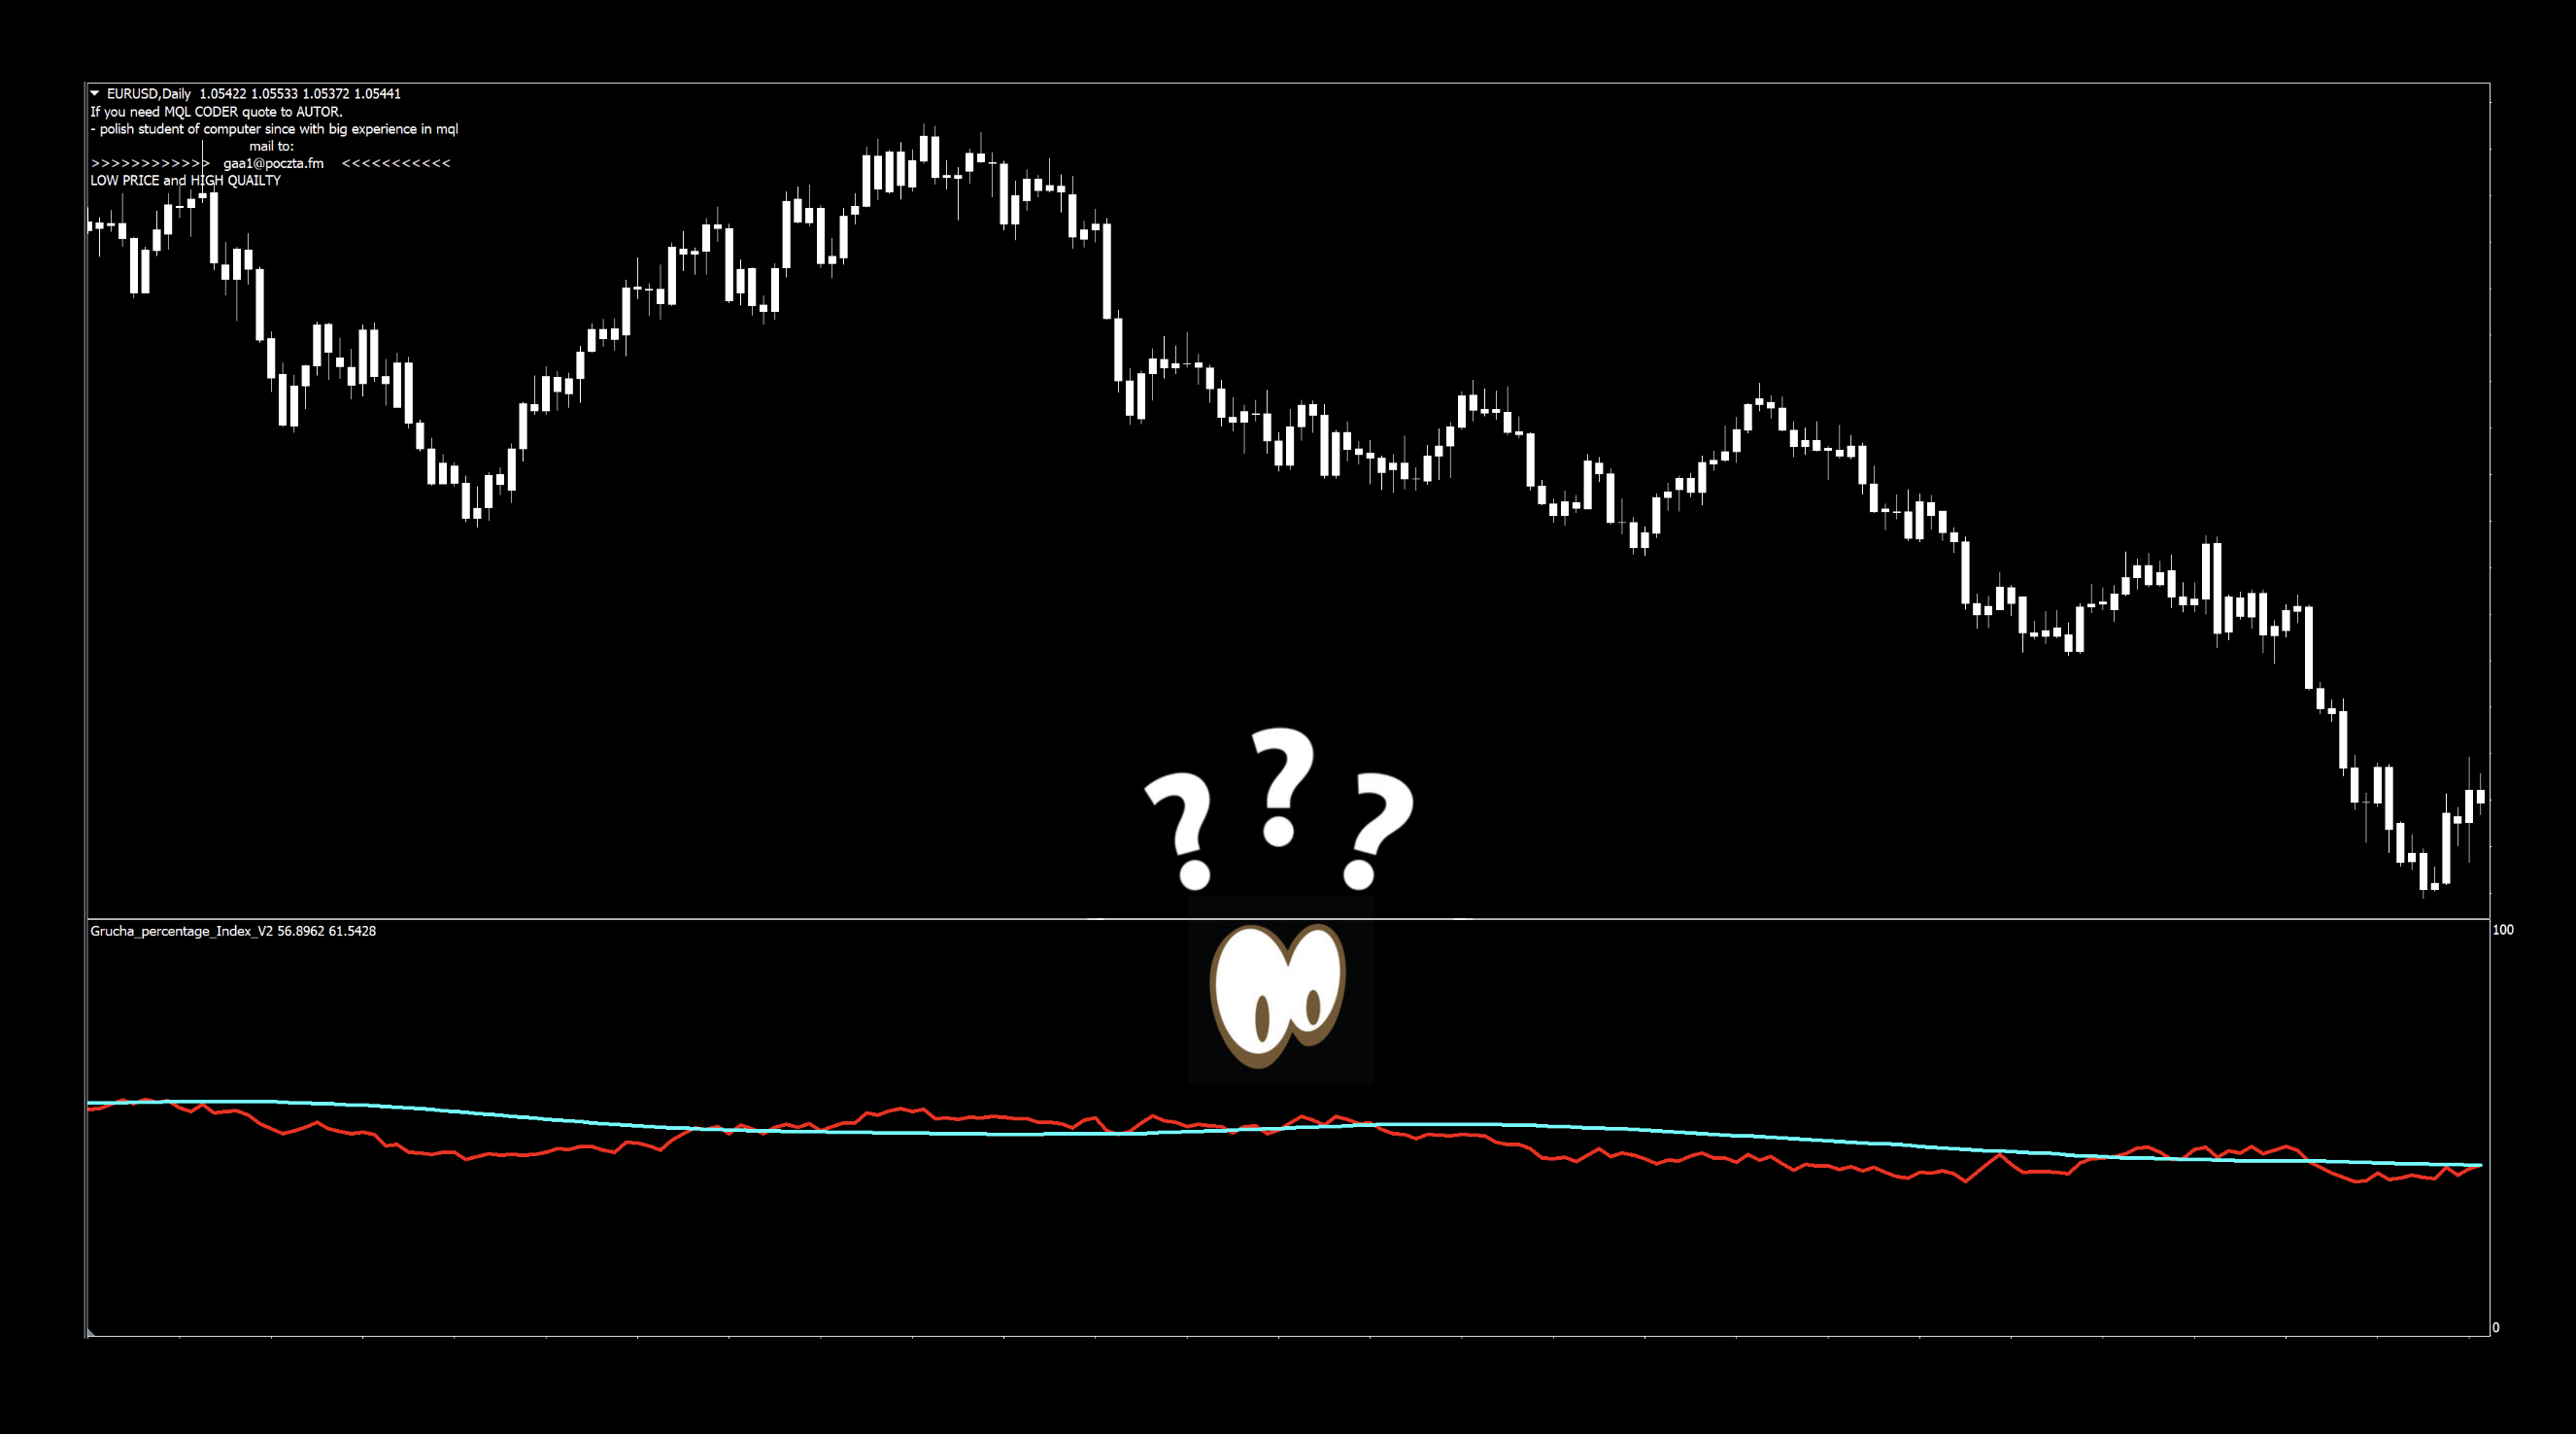
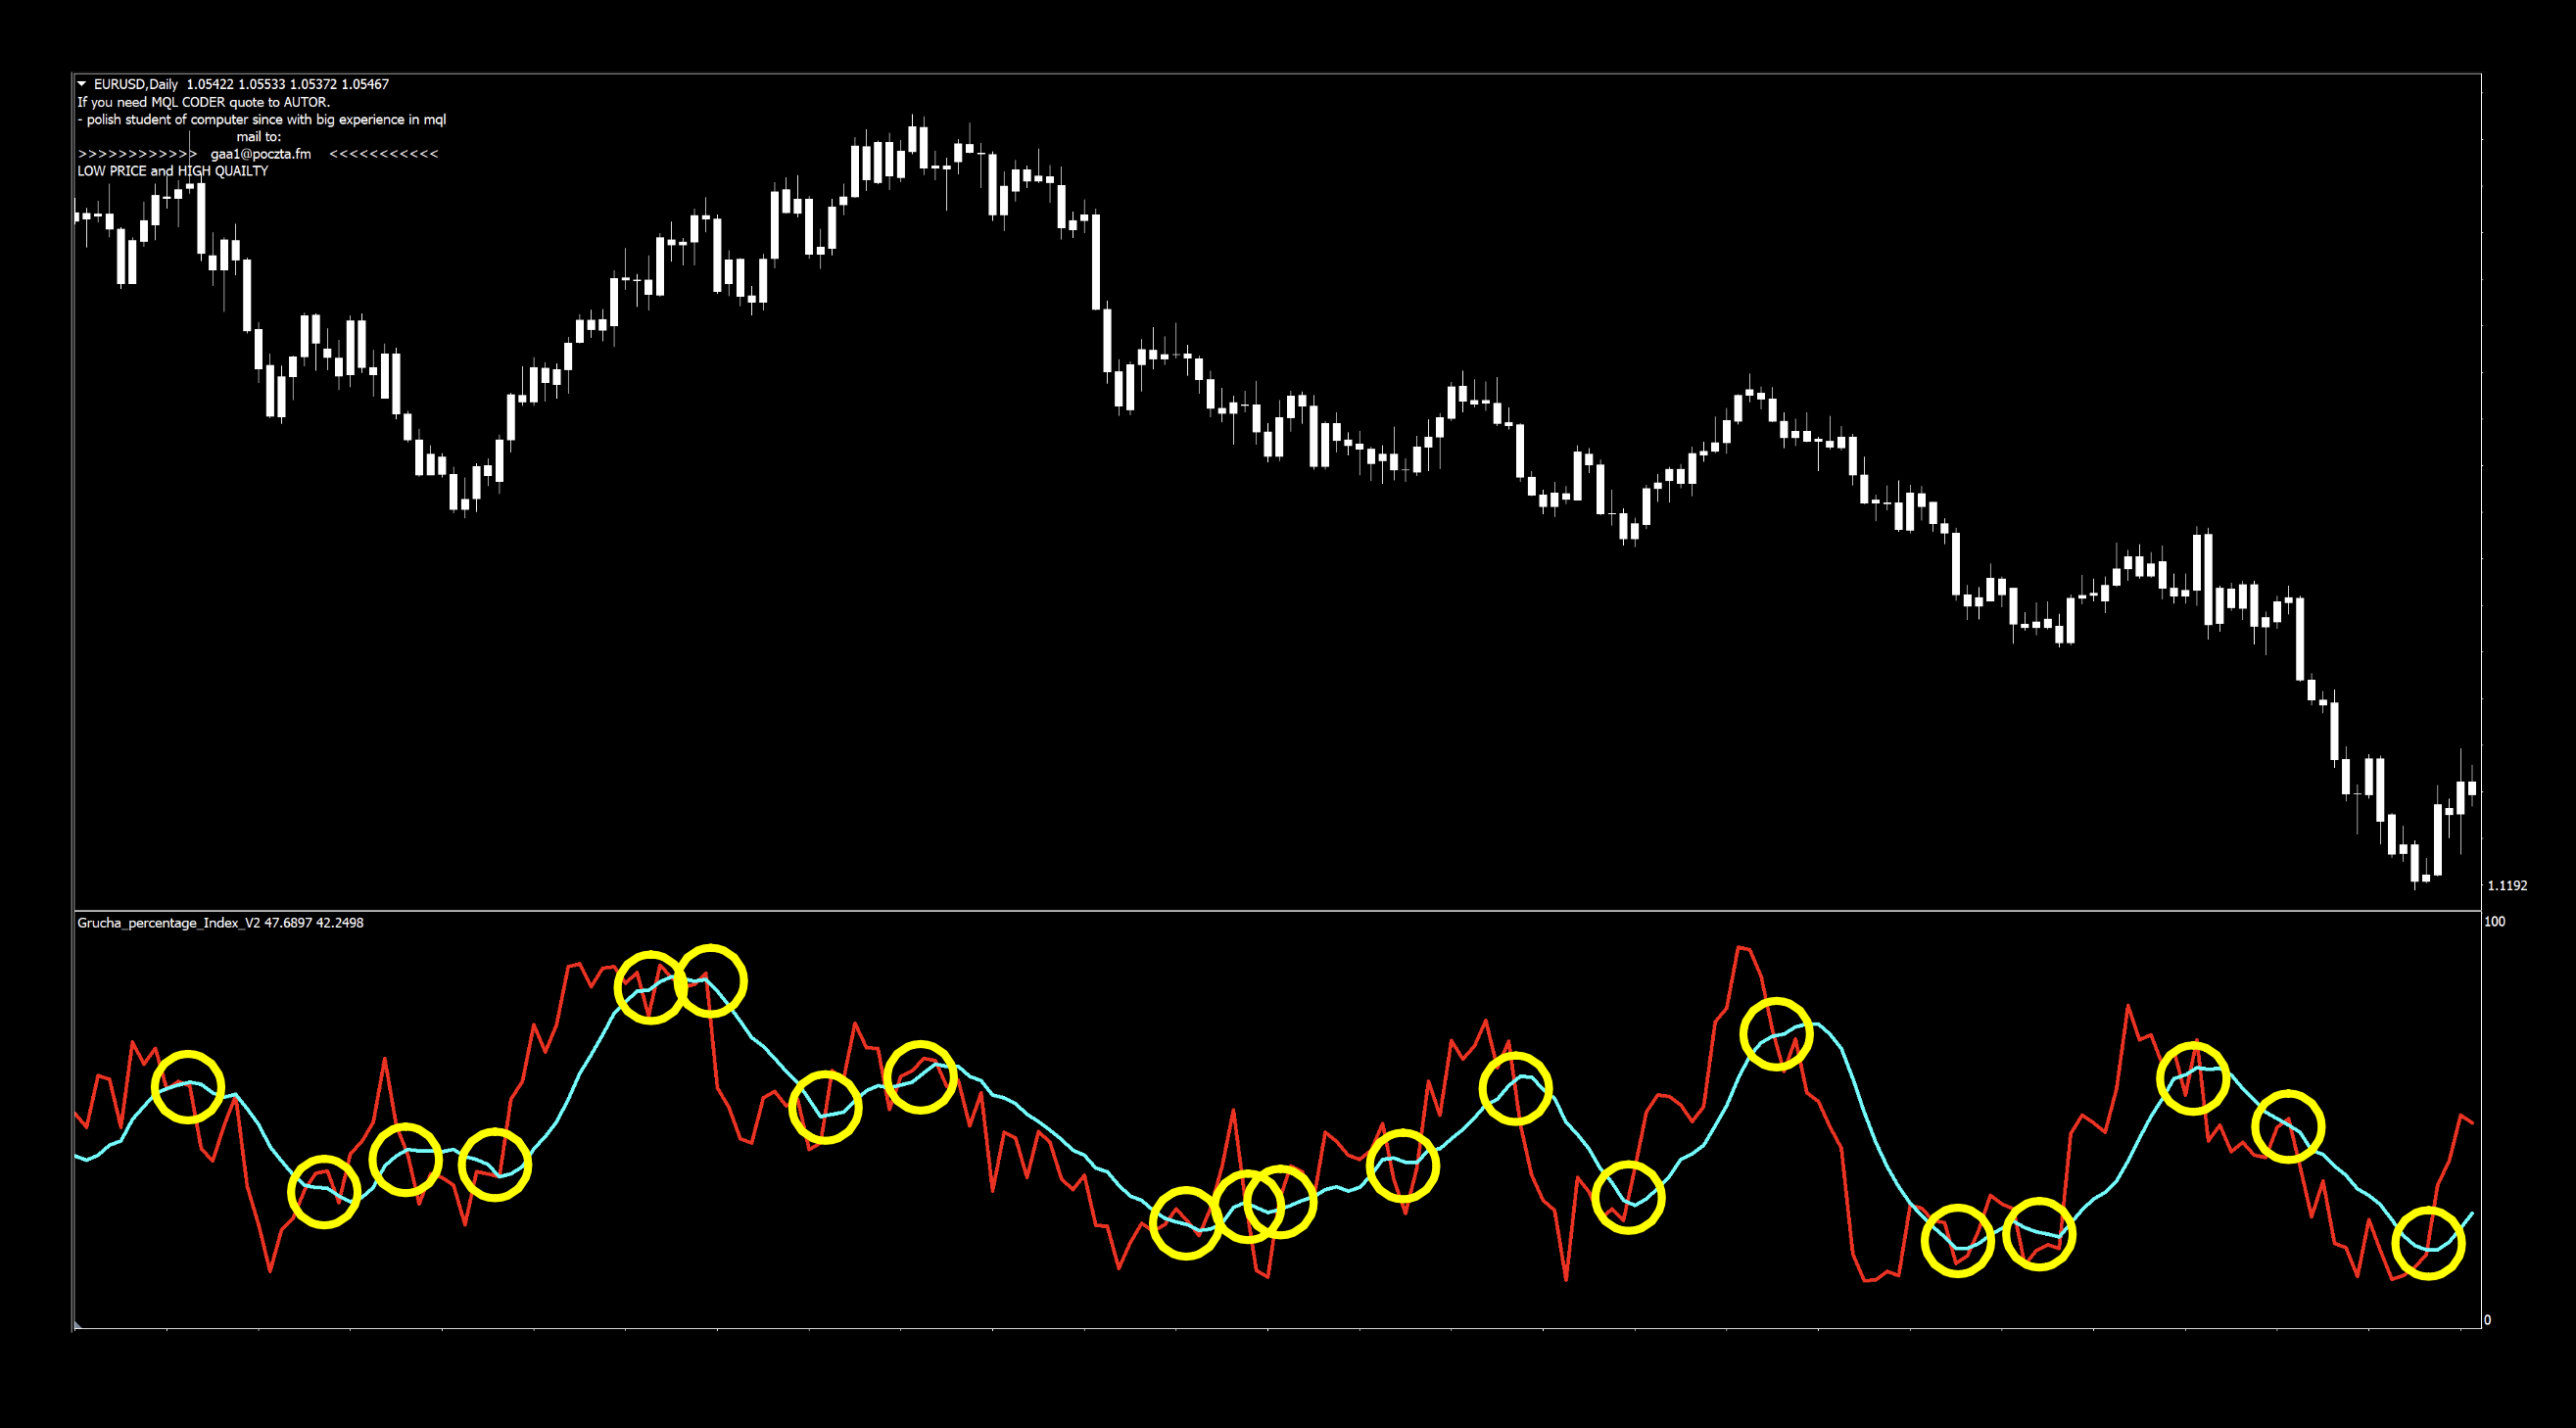
In the screenshot below, we changed the “blue” to “aqua” for better visibility, but left the red alone…and changed the thickness to “5” for better visibility. Candles were changed to white. We don’t want to bias ourselves to price when determining the effectiveness of the indicator. You’ll also notice a little bit of writing in the upper left corner. That’s the coder’s message stating that he’s open for business and available for work.
Settings
There are only two settings in this indicator, so testing is fairly quick.
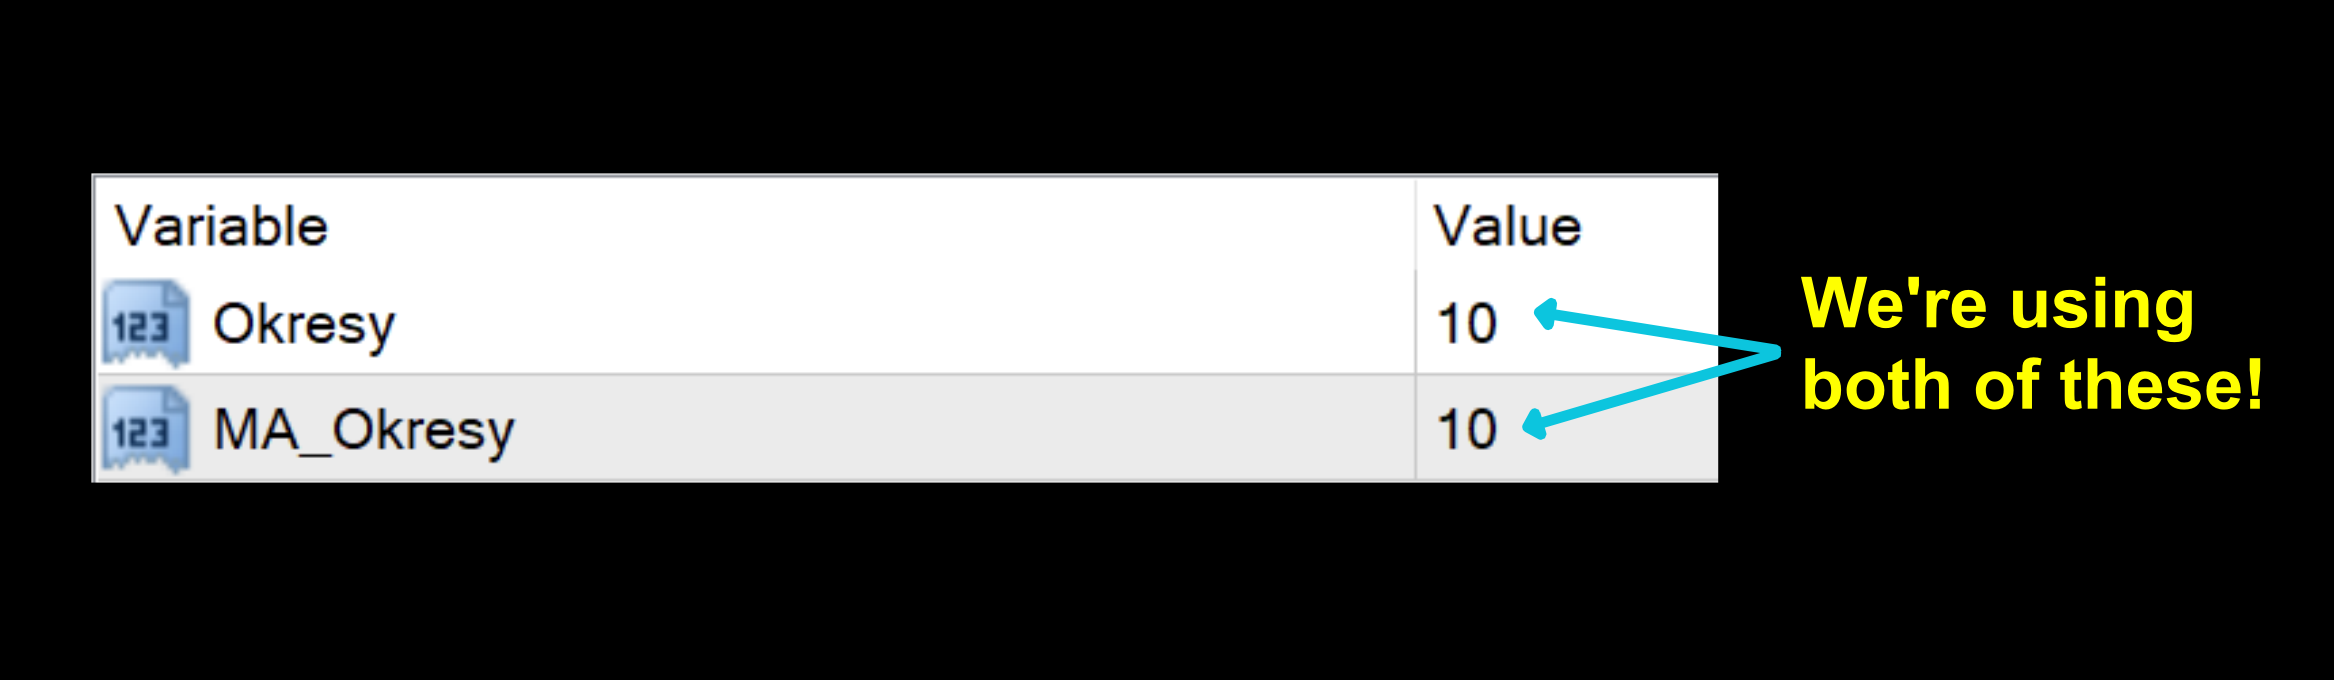
Okresy: The number of periods used to calculate the “Grucha Index”. This is the red line. The default setting is 10.
MA_Okresy: The moving average line calculated based on the results of the Grucha Index. This is the blue line. The default setting is 10.
Advantages
* Can be used to generate signals in multiple ways.
* Easy to test.
Before That…This
Before we dive into how to use it, let’s investigate a few possible ways we can generate signals using this indicator. As mentioned, the native display points you towards using it as a two line cross. However, if you were to remove one (or the other) line and insert a “50” level, you now have a mid-line cross. That being said, you could only take signals on the Grucha Index, or you could take signals on the moving average of the Grucha Index. Let’s compare the charts for a moment.
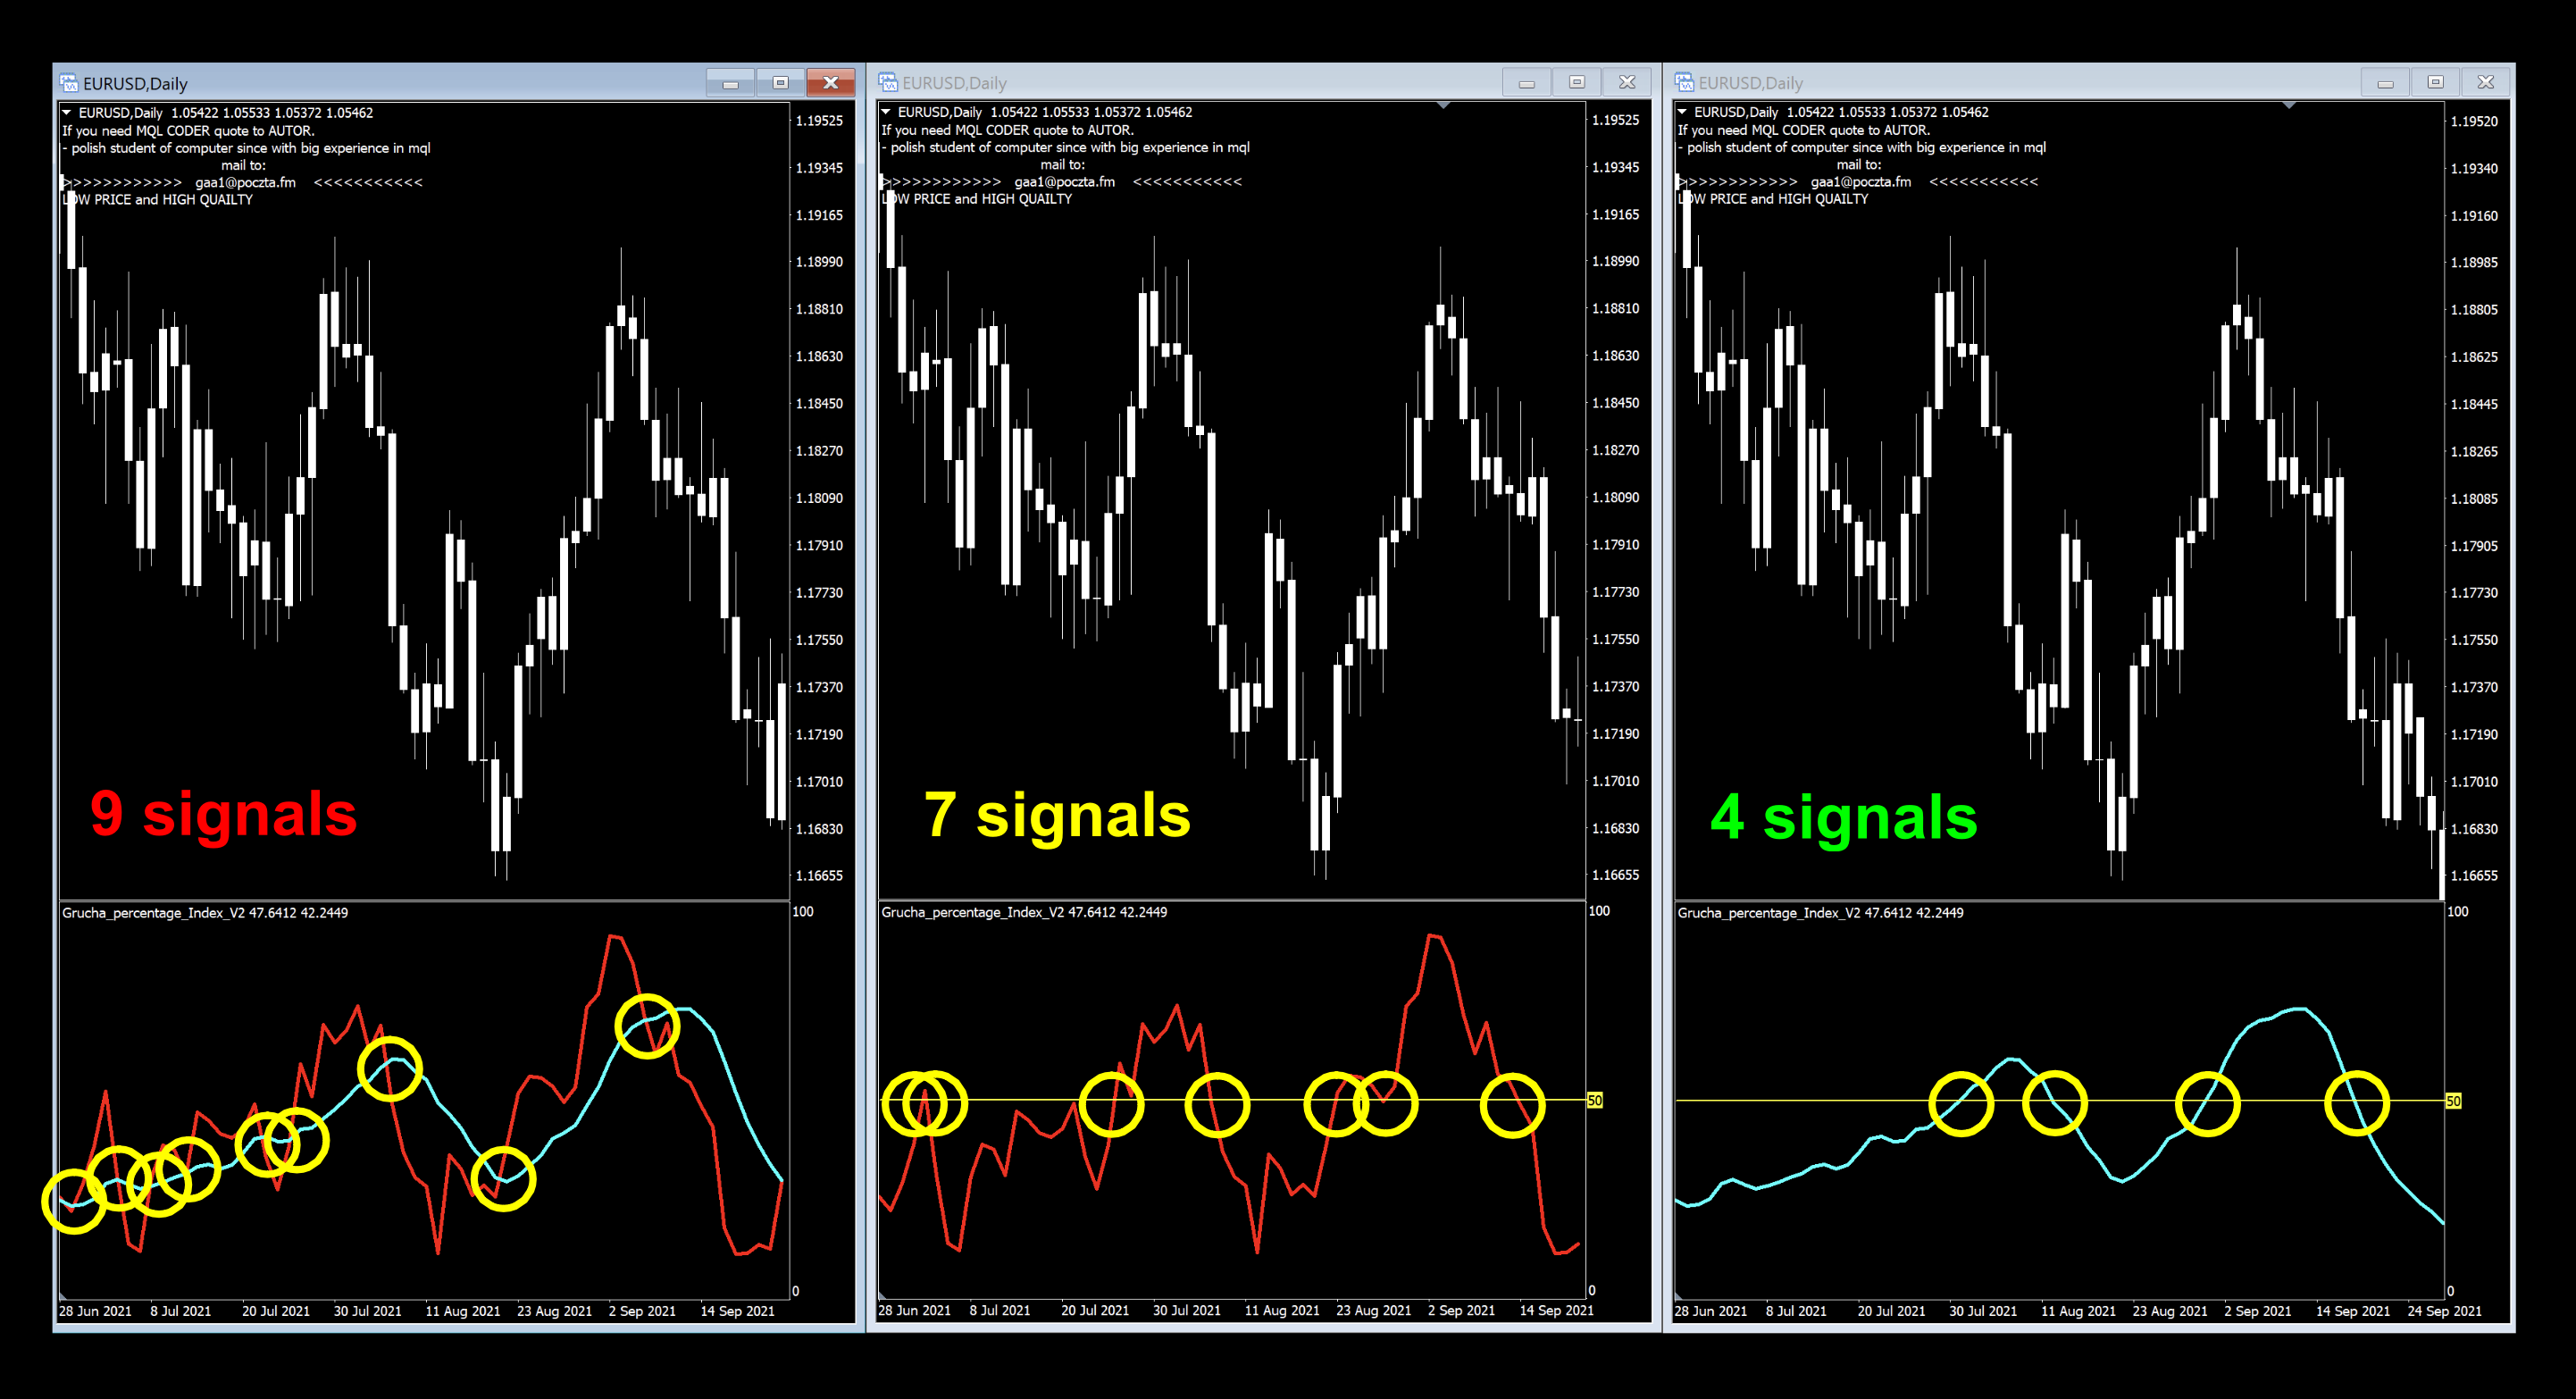
As a two line cross, there were 9 signals. A couple of them were within the same circle, but this had the most. Using the Grucha Index alone, a couple less, and the MA of Grucha, significantly less…and easier to see.
Cool Story Bro…Now What?
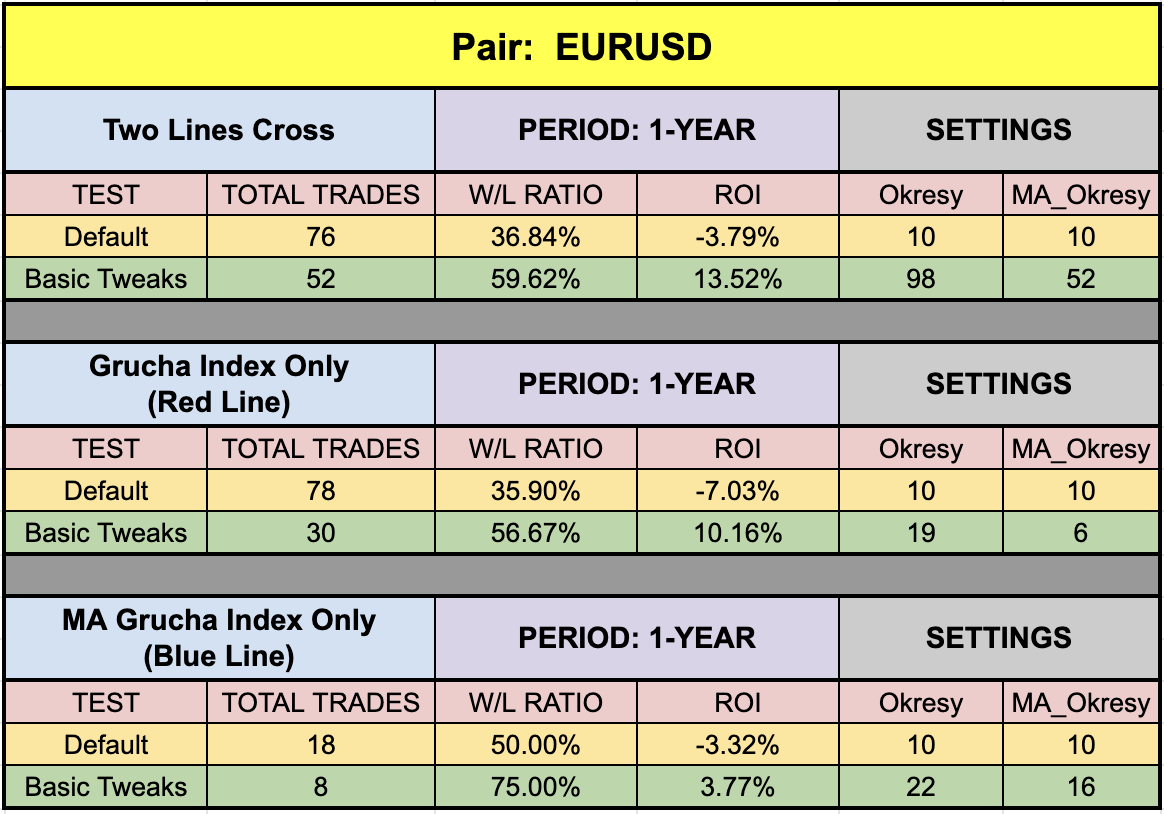
Okay, so the questions begs to ask. Which one is best? Do you want more signals to contend with, or something a bit easier to see? We ran random time span benchmark tests (default/tweaked) on the three possibilities, using the daily EUR/USD to make a decision. Here’s what we saw.
Two-Lines Cross
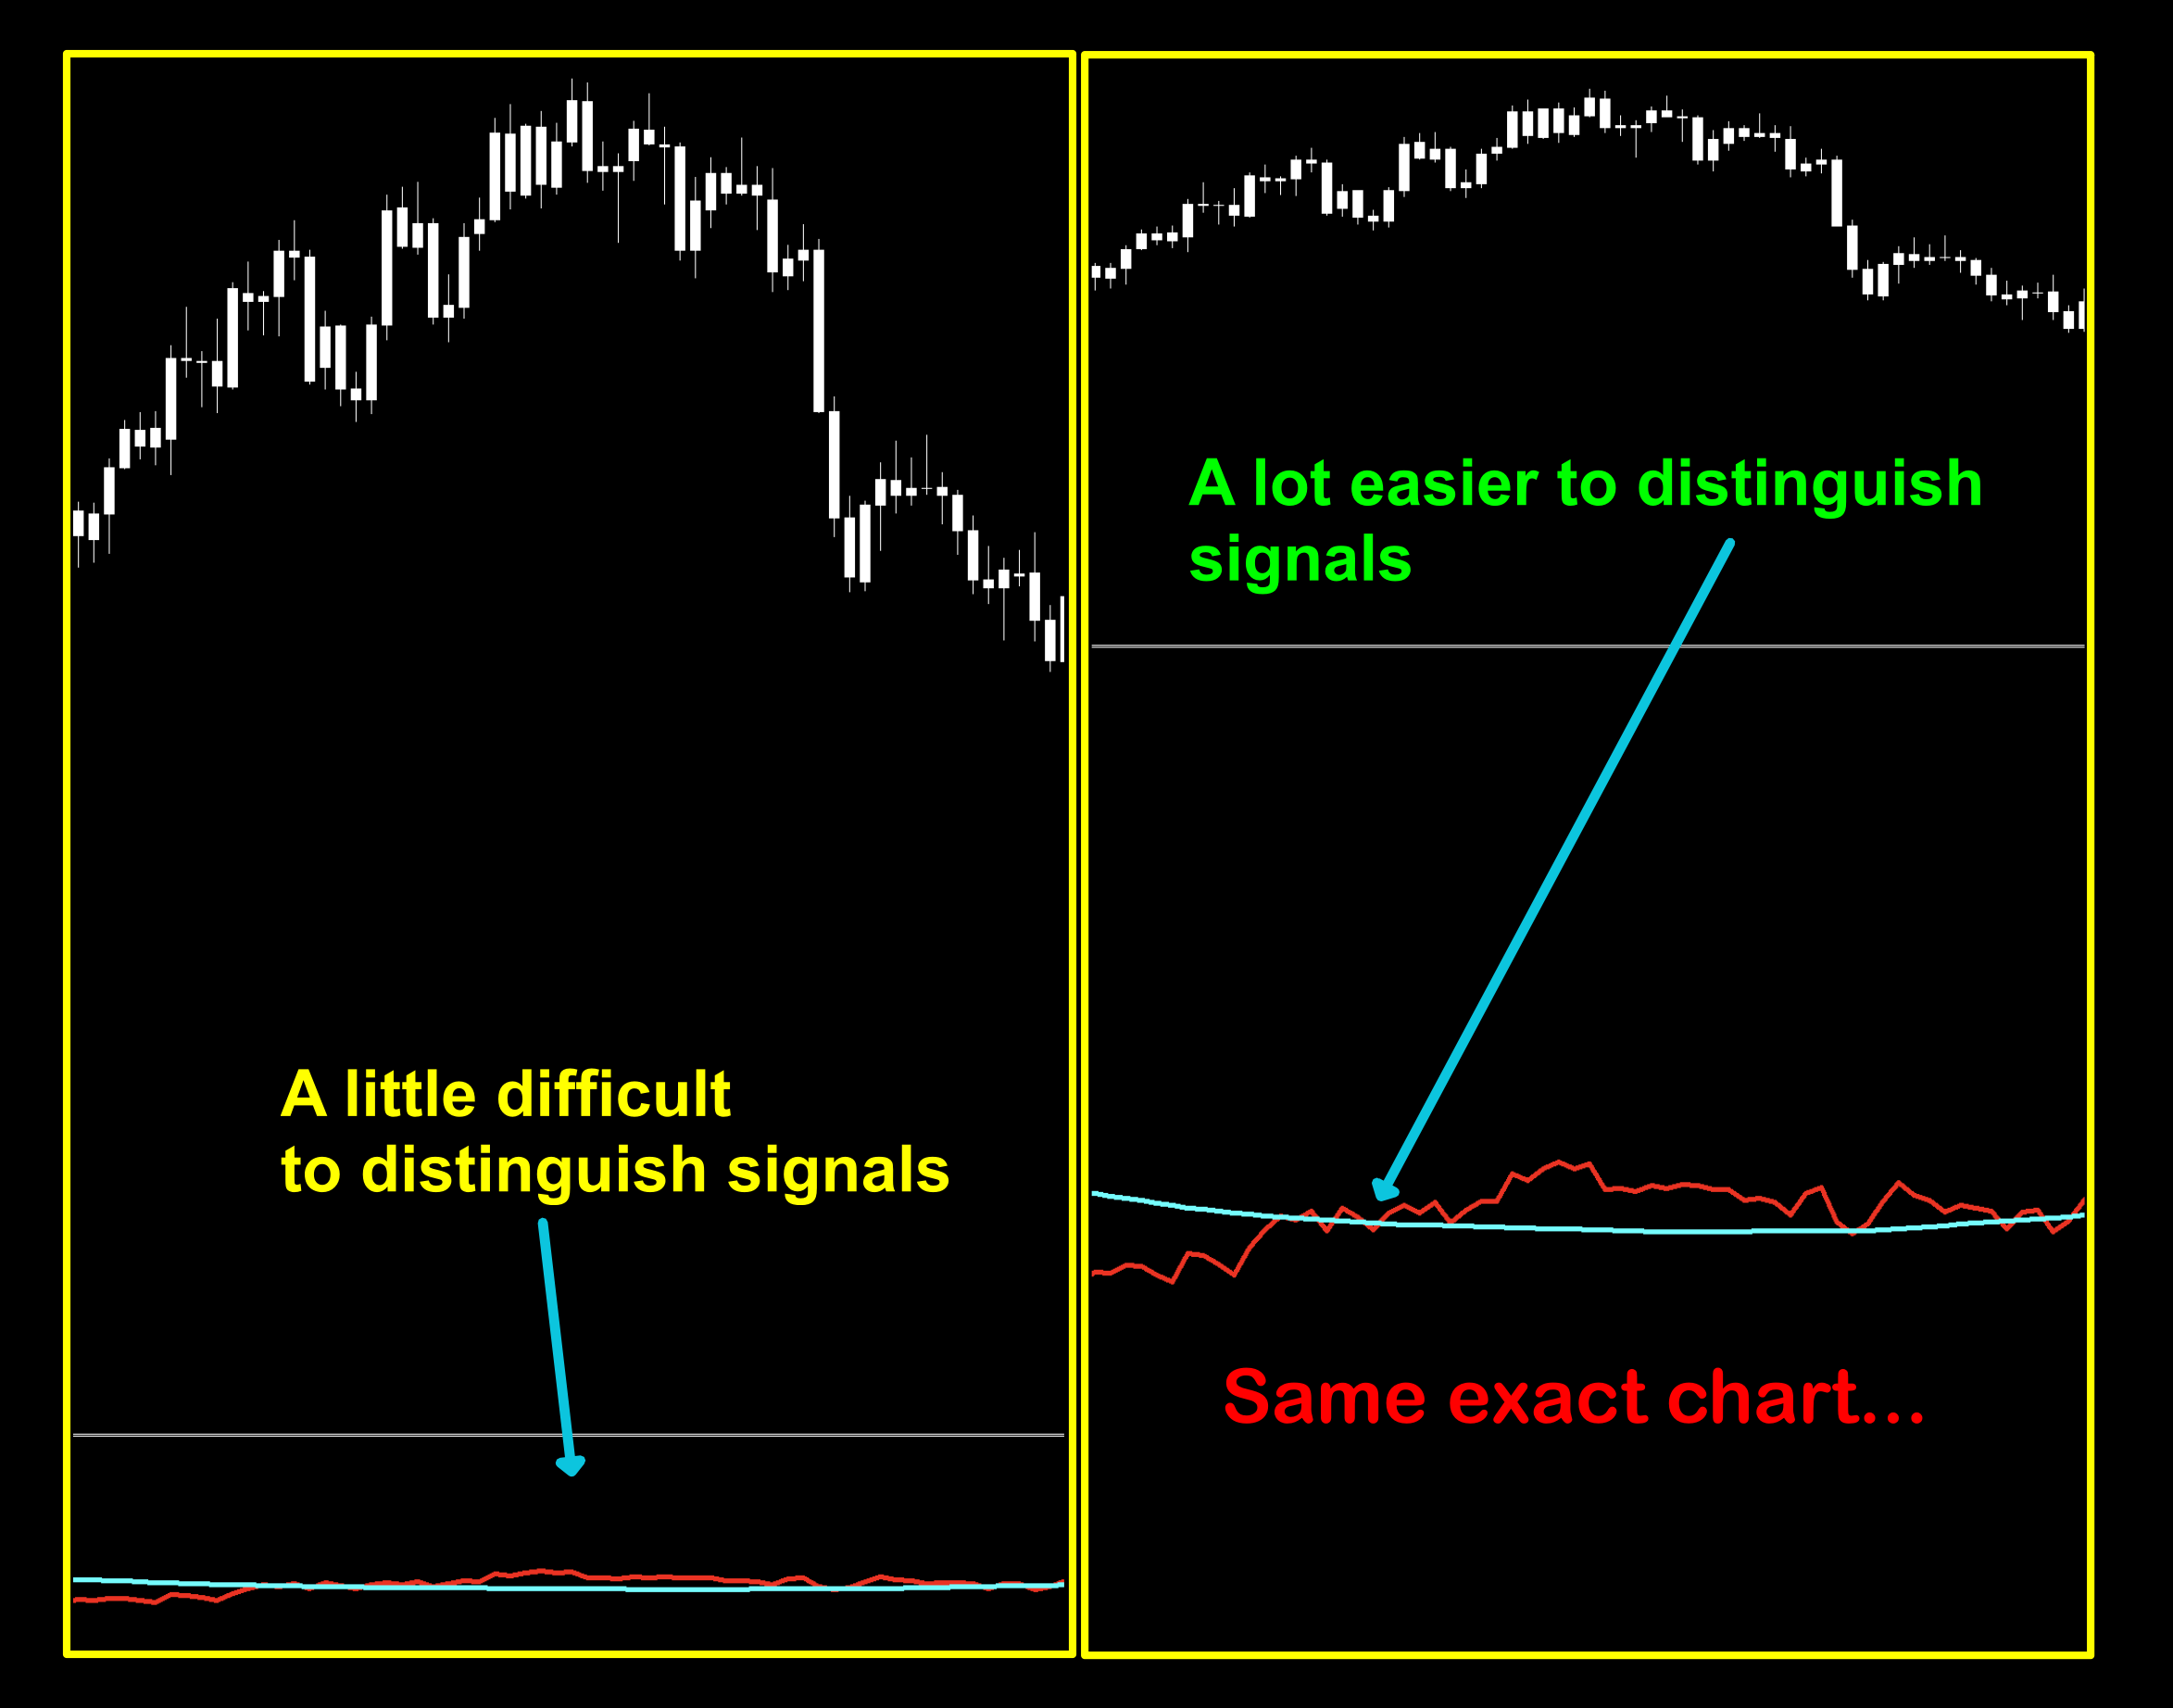
On the two lines cross, we could tweak it to get positive results. However, the higher returns necessitated much a much longer period setting which “flattened” out the signal lines – making it difficult to see the signals as noted in the image below.
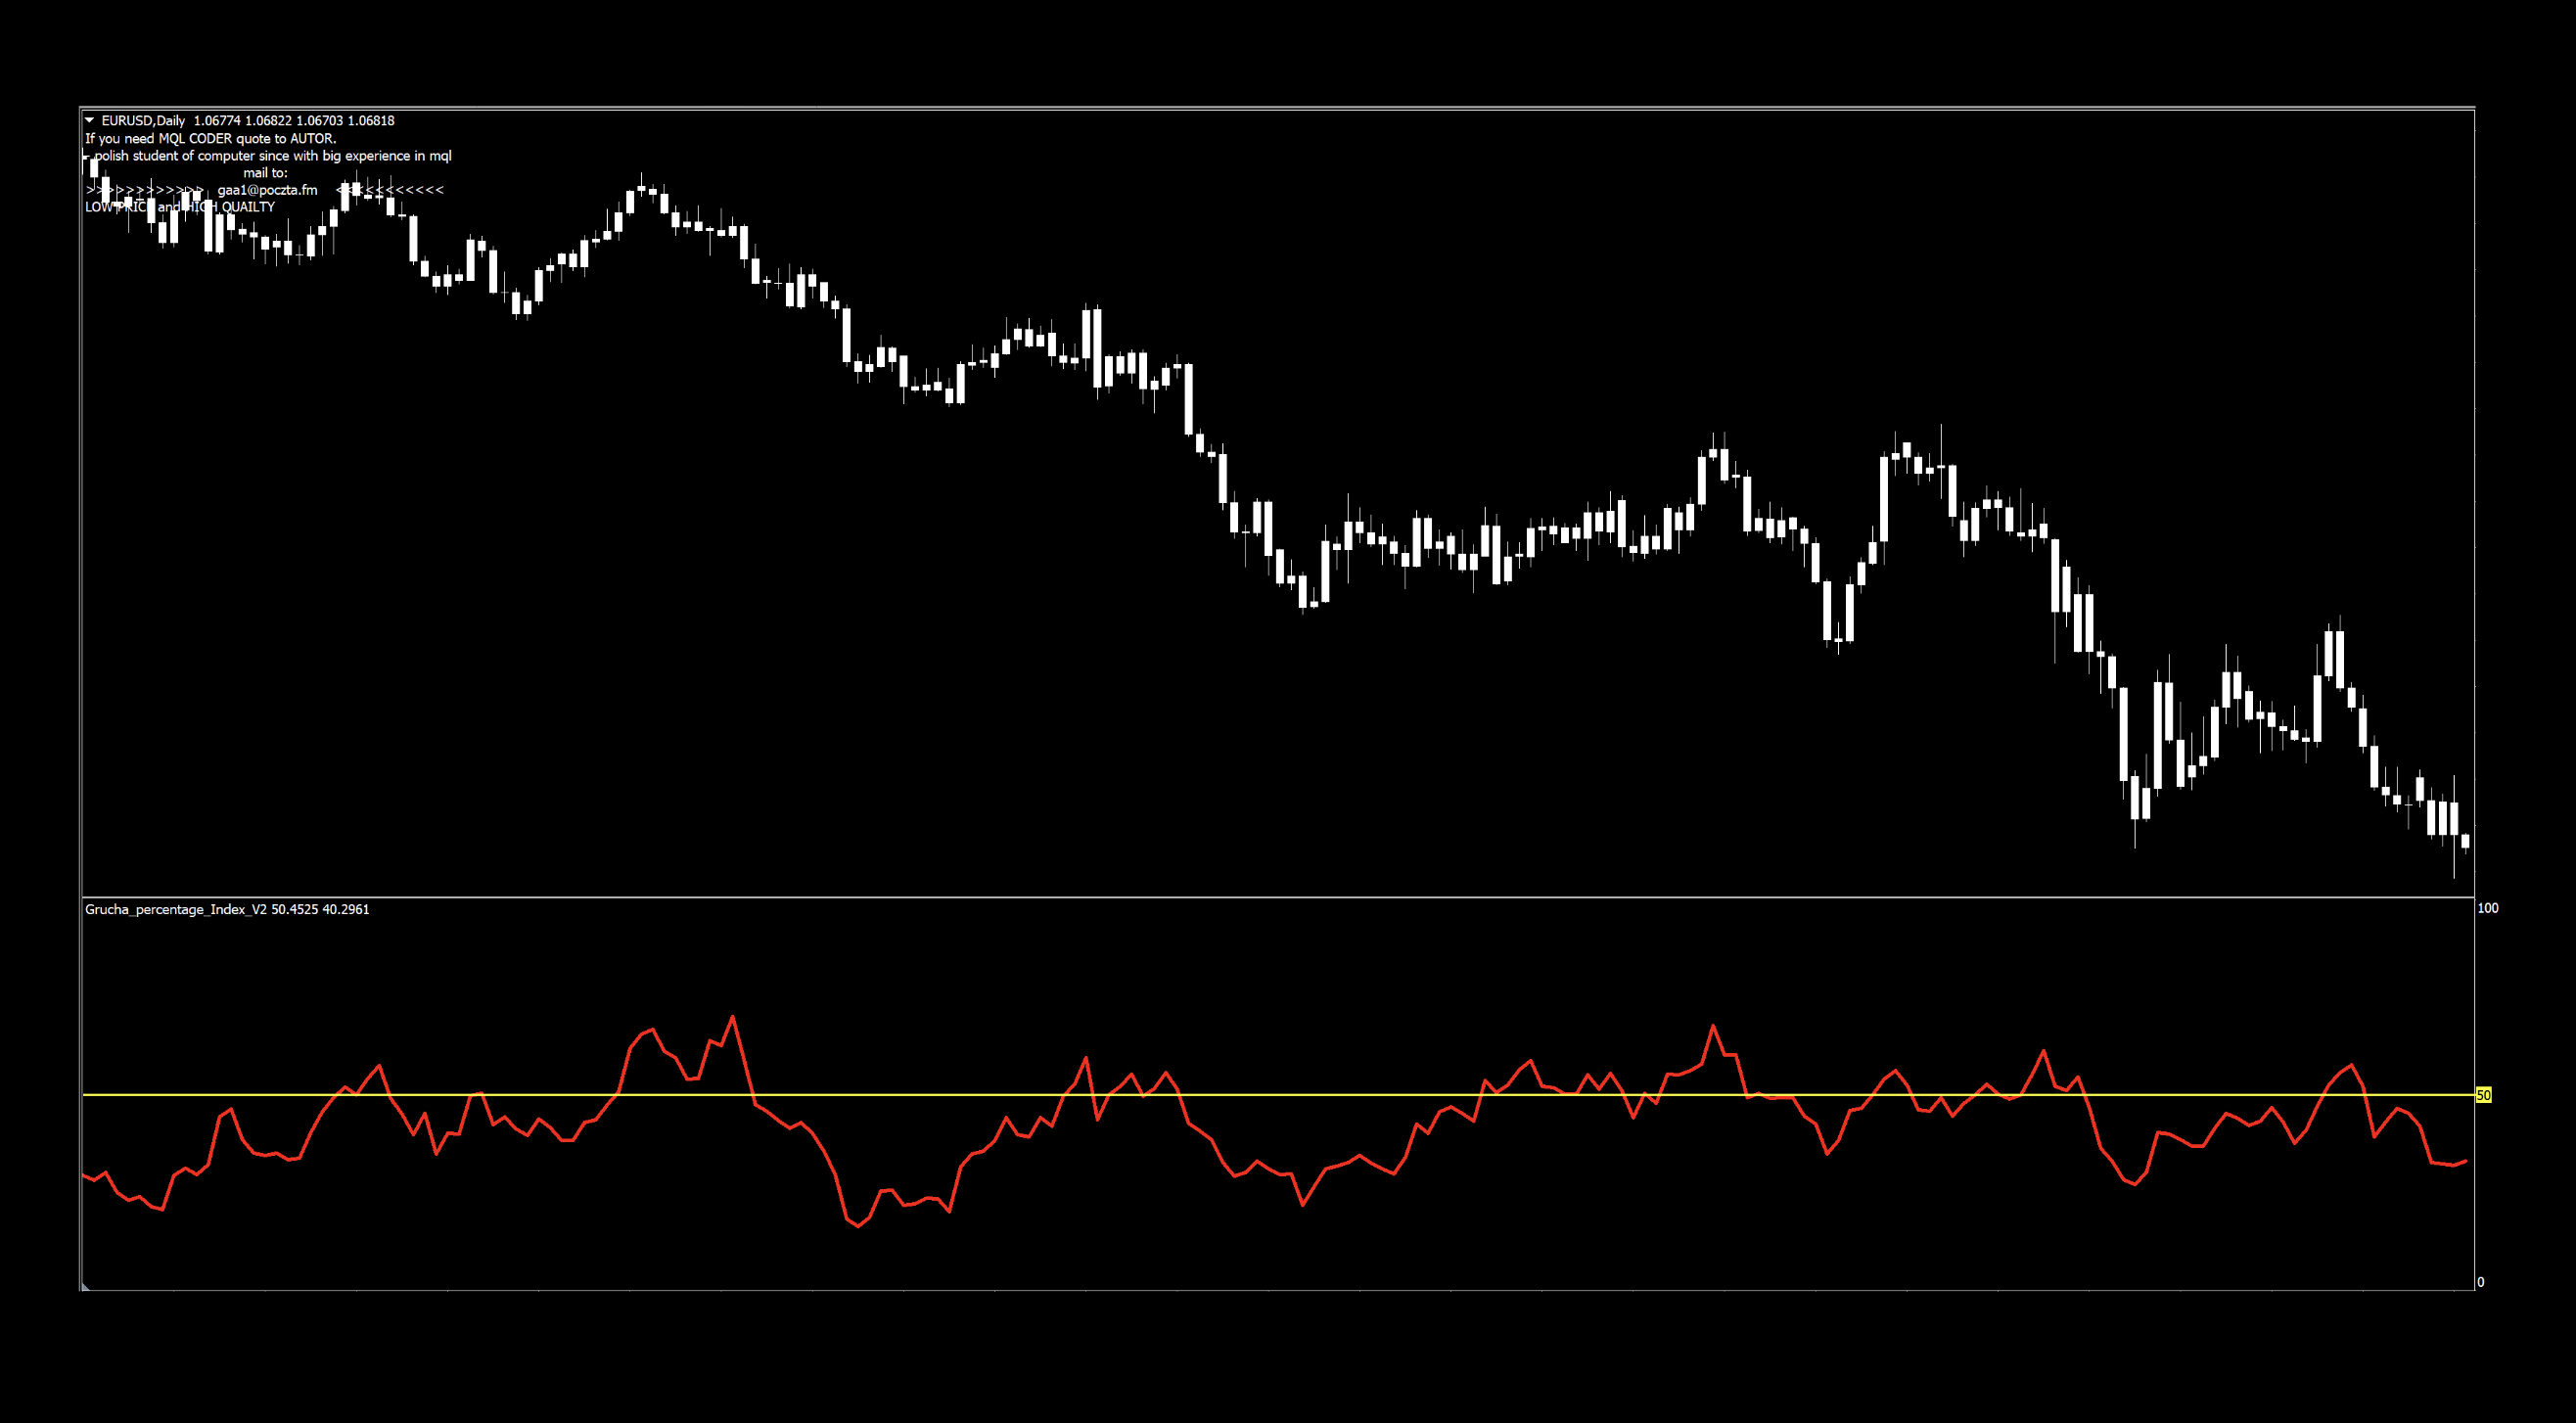
One Level Cross – Grucha Index
Next, we tried just using the Grucha Index signal line (red) as a single level cross to see how we did. We were able to use a smaller number and not flatten out the line. Remember, that the Grucha Index is the first number, so the second one isn’t relevant.
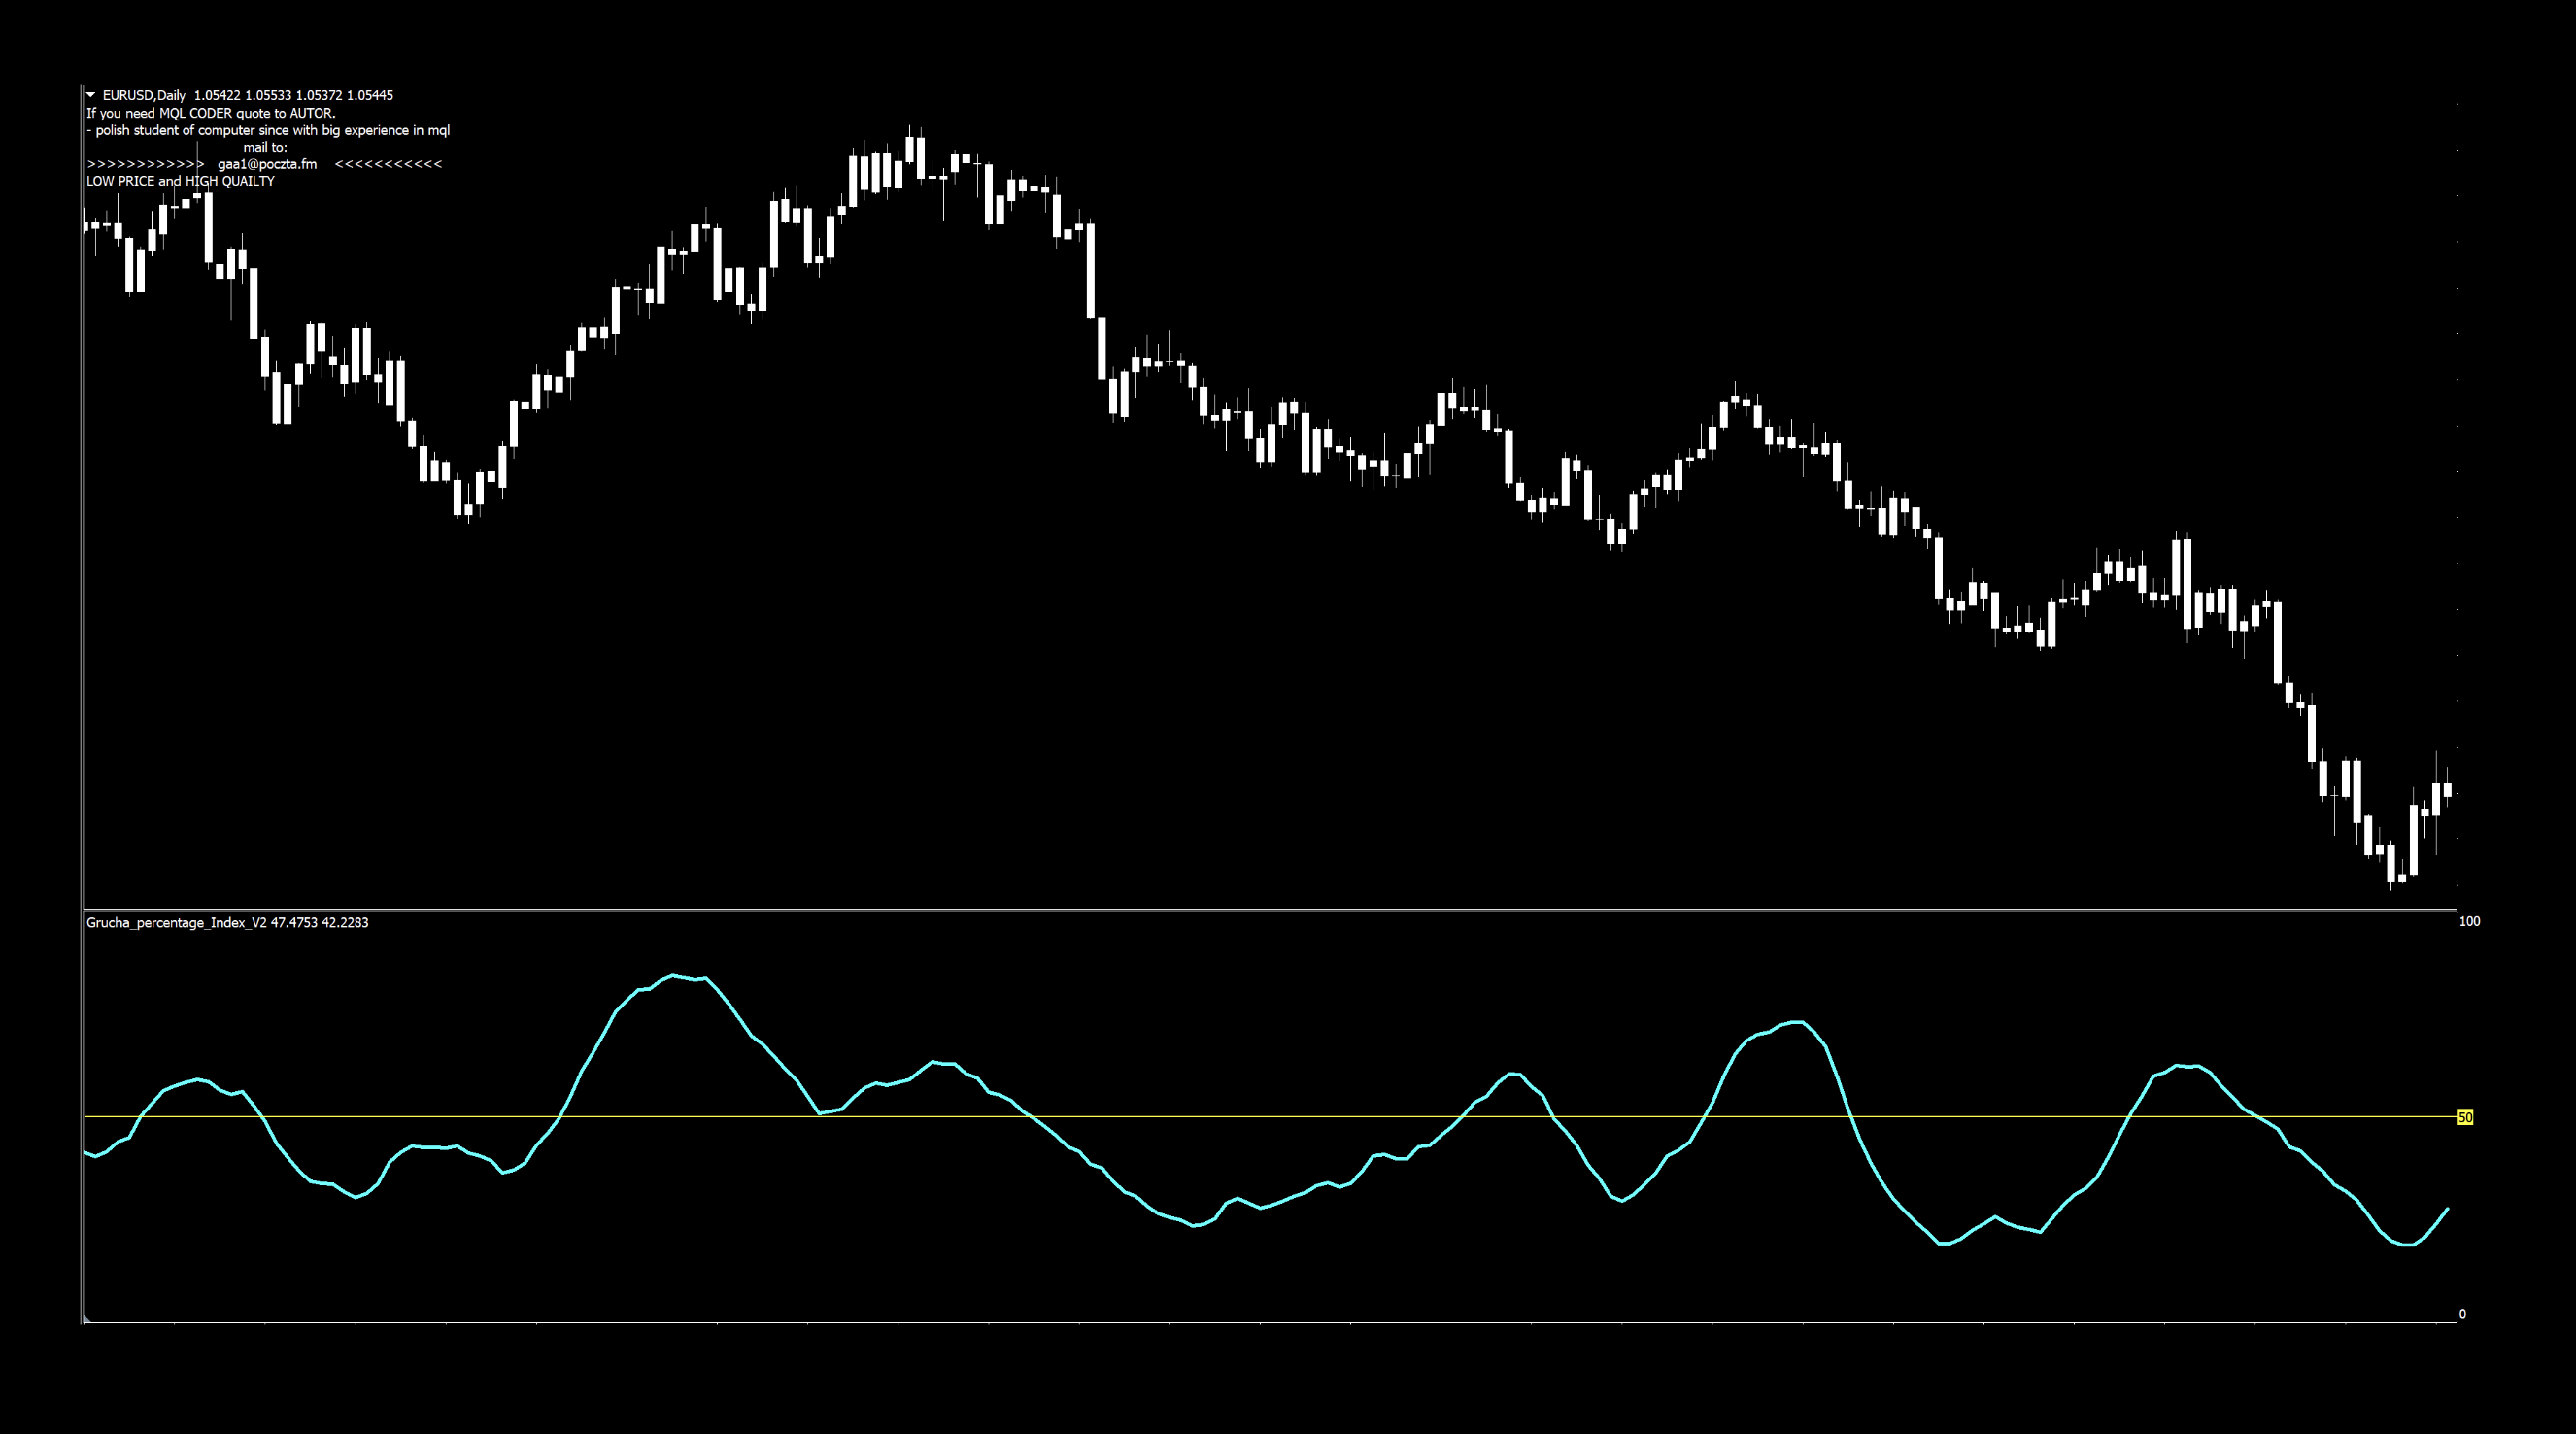
One Level Cross – MA Grucha Index
And last, we tried just using the MA Grucha Index signal line (blue) as a single level cross to see how we did.
Again, the issue is if the settings are too high on either one of the two settings, the signal line flattens out and identifying signals can be a bit tricky. Granted, the W/L ratio is pretty high, but you “pay” elsewhere.
The results of our testing are below, demonstrating our testing results.
One More Helpful Thing
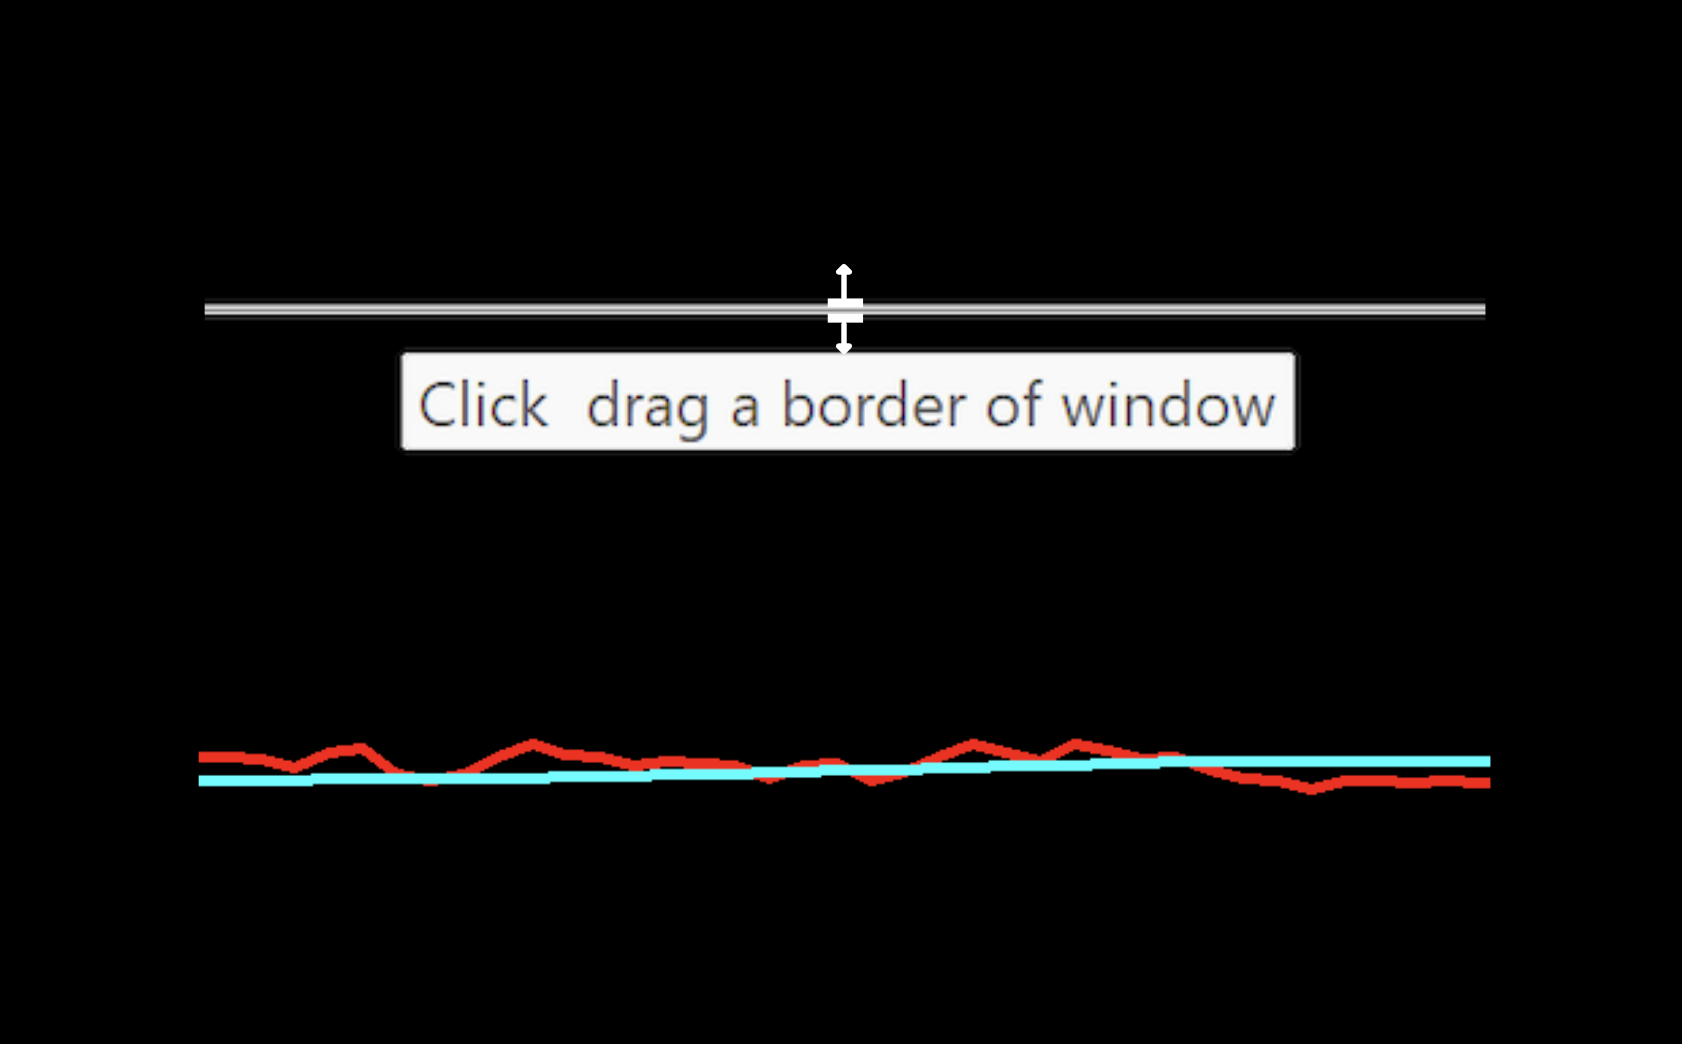
If you weren’t aware, you can actually “stretch” and compress the windows on your chart. We’ll demonstrate this feature by looking at a default view of the two lines cross (with flattened lines) then stretch it to get a better view of the signals lines. It’s helped us in the past, so I’m pretty sure it’ll help you as well. Check it out.
 All you need to do is place the mouse arrow directly over the line, then left click and “drag” the line that separates the windows higher and lower to achieve the same results. Like this…
How We Use It
Alright…so now that we’ve covered different ways to use the indicator, what is the best way? Ultimately, the decision lies with you, but for our purposes, we’ll go with a two lines cross since we don’t see too many of them.
It Is What It Is
The default settings are numerically low, meaning that a lot of signals appear and there may be occasions where not many good choices are available…but we post what we get. Some may have great returns and many trades, and some may have mediocre returns but easy to see signals and a more reasonable amount of trades.
Signals
Long signal – When the blue line crosses and closes over the red line. The entry occurs on the open of the next candle.
Short signal – When the red line crosses and closes over the blue line. The entry occurs on the open of the next candle.
We printed an abridged screenshot above, but we’ll look over longer period below to see what we get.
You can see there were a few areas of congestion where price flattened out creating multiple signals; however, this is where a quality algorithm may protect you from losing trades.
Testing…Testing…Testing…
Remember, comprehensive analysis is strongly suggested, and we advocate backwards and forward testing indicators or systems prior to trading actual funds. We propose conducting your tests on the following pairs.
EUR/USD
AUD/NZD
EUR/GBP
AUD/CAD
CHF/JPY
CAD/SGD
If it doesn’t work on these 6 pairs, chances are it won’t work on other pairs. This is not an absolute, but we’ve found this rule is reliable in most cases.
The markets we test our indicators are the:
EUR/USD (Euro/US Dollar)
BTC/USD (Bitcoin/US Dollar)
XAU/USD (Gold/US Dollar)
SPX500 (S&P500 Index)
Timeframes and Results
In our initial test, we’ll run the Grucha Percentage Index indicator on the EUR/USD, BTC/USD, XAU/USD, and the SPX500 using the default settings across the daily and 4-hour timeframes on the MT4 strategy tester. We use the fast method of testing the indicator to get a general idea; however, you may also run the tick-by-tick data set for a more precise result (which takes considerably more time).
As No Nonsense Traders – and therefore Swing Traders, we will not examine shorter time frames in these studies. We will also run an additional test, using different values for the settings, to analyze which one may work better and examine the following results:
Total trades
Win/Loss ratio
ROI (return on investment)
There are other metrics included in the strategy tester report, which can be compared, but these three metrics provide the necessary gauge to make quick decisions as to the usefulness of a particular indicator and its settings.
Next, for comparison, we’ll explore the following;
Daily – 1 year
4-hour – 3 months
The reason exceptionally long (or short) testing periods are not included is due to changing market conditions, which might return irrelevant information. A balance of statistically significant data is necessary for accurate results.
And the Outcome…
Below are the spreadsheets illustrating the results from our tests.
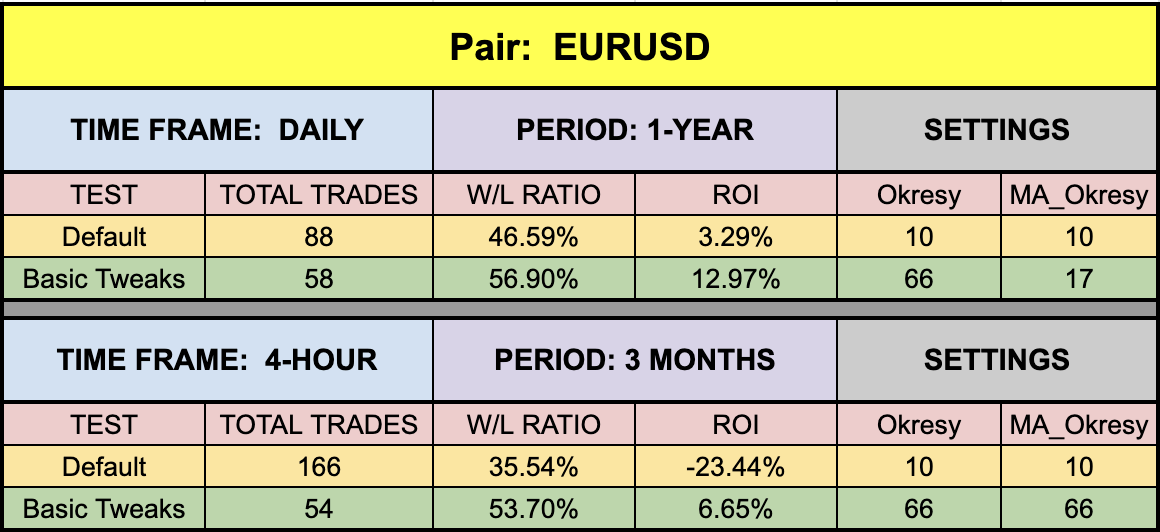
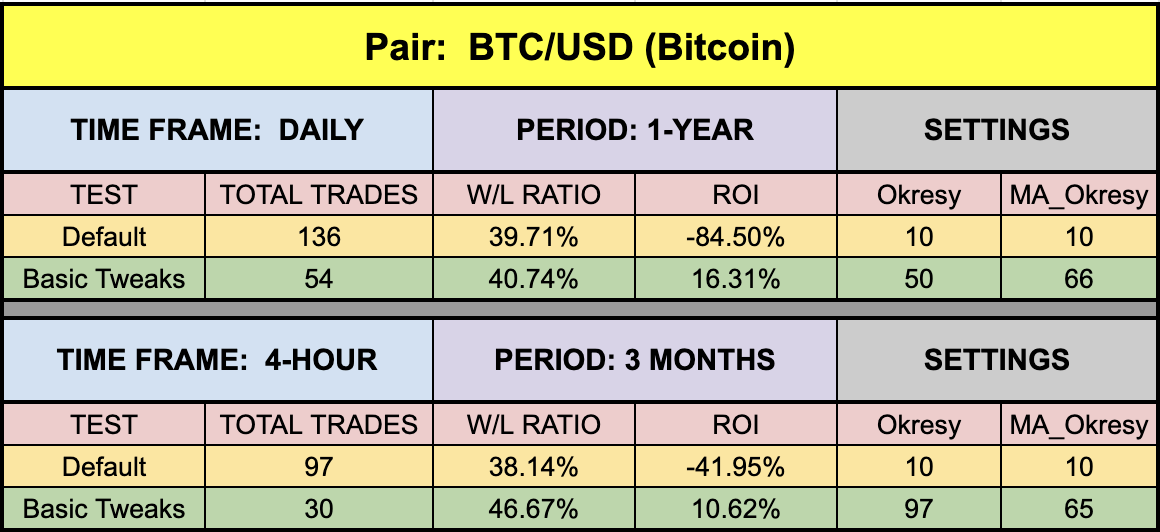
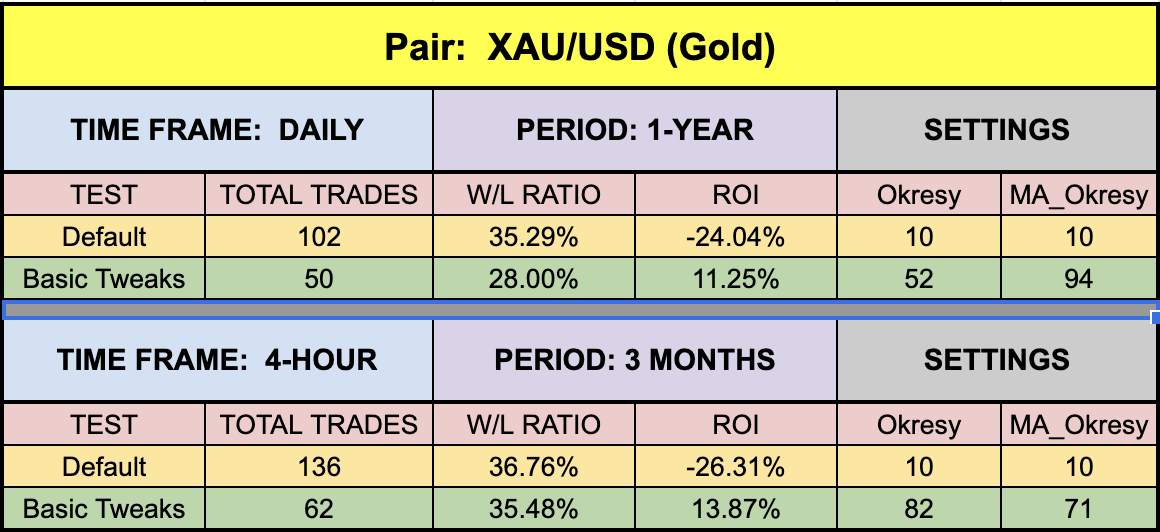
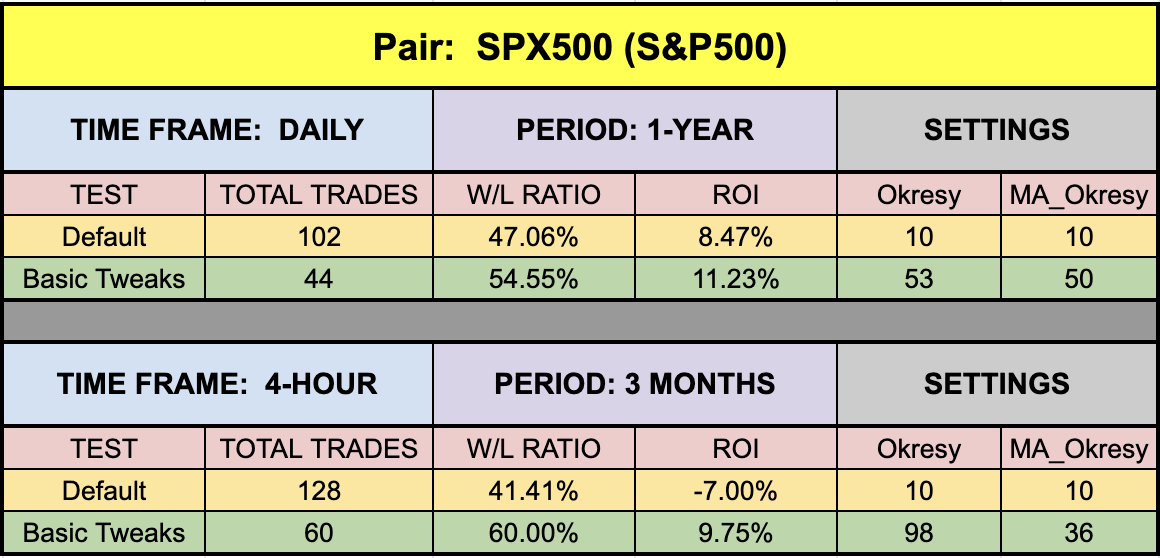
The green highlighted rows represent “basic tweaks” on the settings which returned better results. Are these the best? Not necessarily. Given that variables including testing date range and broker data are different from person to person, you may find better settings.
What’s Up With Bitcoin?
We’re certain you’ve noticed a pattern with testing on Bitcoin throughout the indicator blogs/profile series. The default settings have deviated far off what other pairs return. There are reasons for this.
Massive price swings
Huge ATR spikes
Flat market conditions
Gaps in price action
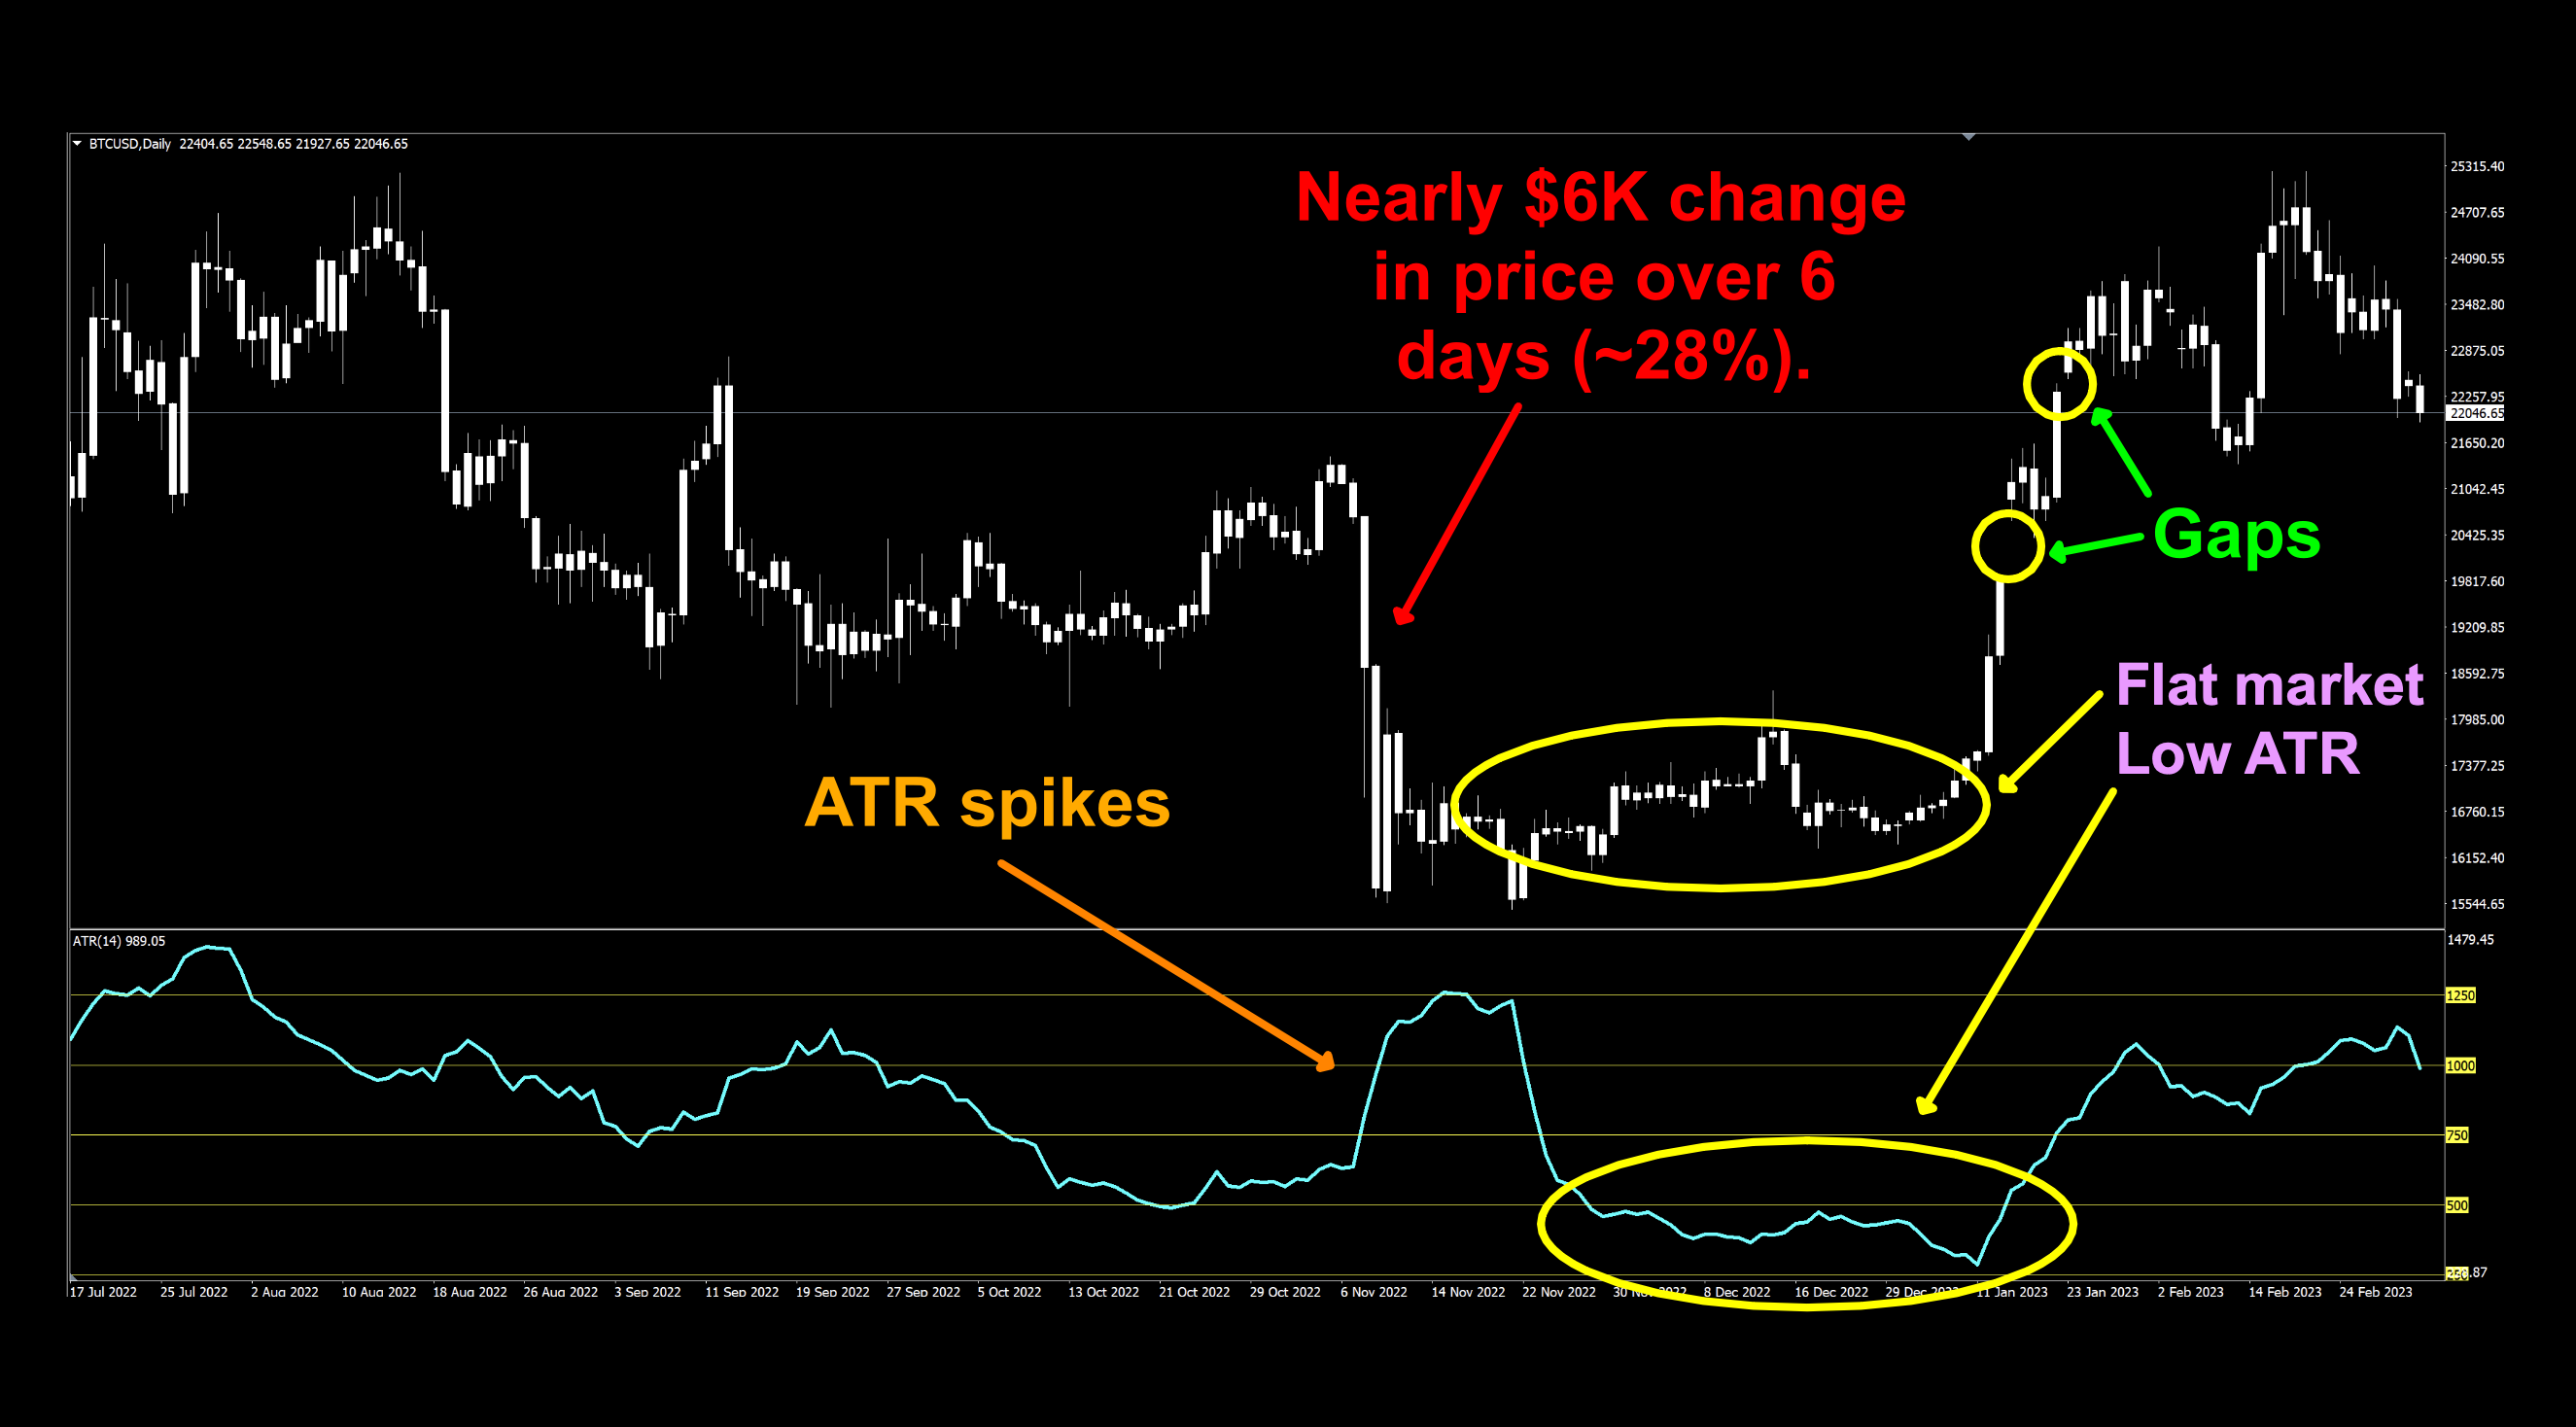
Daily ATR levels are on the right side (in yellow); $250, $500, $750, $1000, $1250 to demonstrate just how wide the ATR range really is.
Dynamically Insane
All of these conditions over short time spans during extended periods of time will create very different conditions (relationships) with most indicators. It’s just the way things are. The trick is to find indicators that handle the changes well…or the market presents a better trading environment. We aim for the former, since we certainly cannot control the latter.
Trust In Yourself
Remember, the overall NNFX philosophy of taking profit, risk, and drawdown is that YOU are creating a system which YOU will be trading. Don’t let anybody else take that away from you. Part of the learning process is digging in and doing the work yourself. To learn more about these topics, check out the Advanced Course!
That being said, the results we post in these blogs should never be considered specific trading advice.
***Note: Remember, never use just this one indicator as your decision of whether to open or close a trade. It should be part of a system.
Money Management
If you are curious as to what money management is used on our tests; we have a certain way of determining wins and losses, which can be found in the Advanced Course. Our goal here is to determine how well the indicator reacts to price with respect to producing a long or short signal. Your system, with its risk profile, will dictate individual returns.
Resources
As we did with past indicator studies, we’ve made the Grucha Percentage Index is available for download on our site from the indicator library. We will keep adding better indicators with each study for your use, at no charge. When you’re ready to get it, click HERE.
More to Come
There’s a lot more to come. We are excited to provide more trading tips in the near future. Sign up on our contacts page or subscribe to our YouTube channel. Receive early notifications as we continue to publish helpful, relevant, and informative Forex related material to support your quest to become a better trader.
And, now you are aware of another indicator that many traders don’t know or use.
Our only goal is to make you a better trader.
BTW – Any information communicated by Stonehill Forex Limited is solely for educational purposes. The information contained within the courses and on the website neither constitutes investment advice nor a general recommendation on investments. It is not intended to be and should not be interpreted as investment advice or a general recommendation on investment. Any person who places trades, orders or makes other types of trades and investments etc. is responsible for their own investment decisions and does so at their own risk. It is recommended that any person taking investment decisions consults with an independent financial advisor. Stonehill Forex Limited training courses and blogs are for educational purposes only, not a financial advisory service, and does not give financial advice or make general recommendations on investment.