Second Cousins
When we found out where this indicator came from, we immediately thought of a family reunion where one might meet distant relatives. This is kind of like that. Interestingly enough, one of its cousins lives in the default version of the MT4 platform. The cousin we’re going to look at does not. Onward!
Who’s Your Family
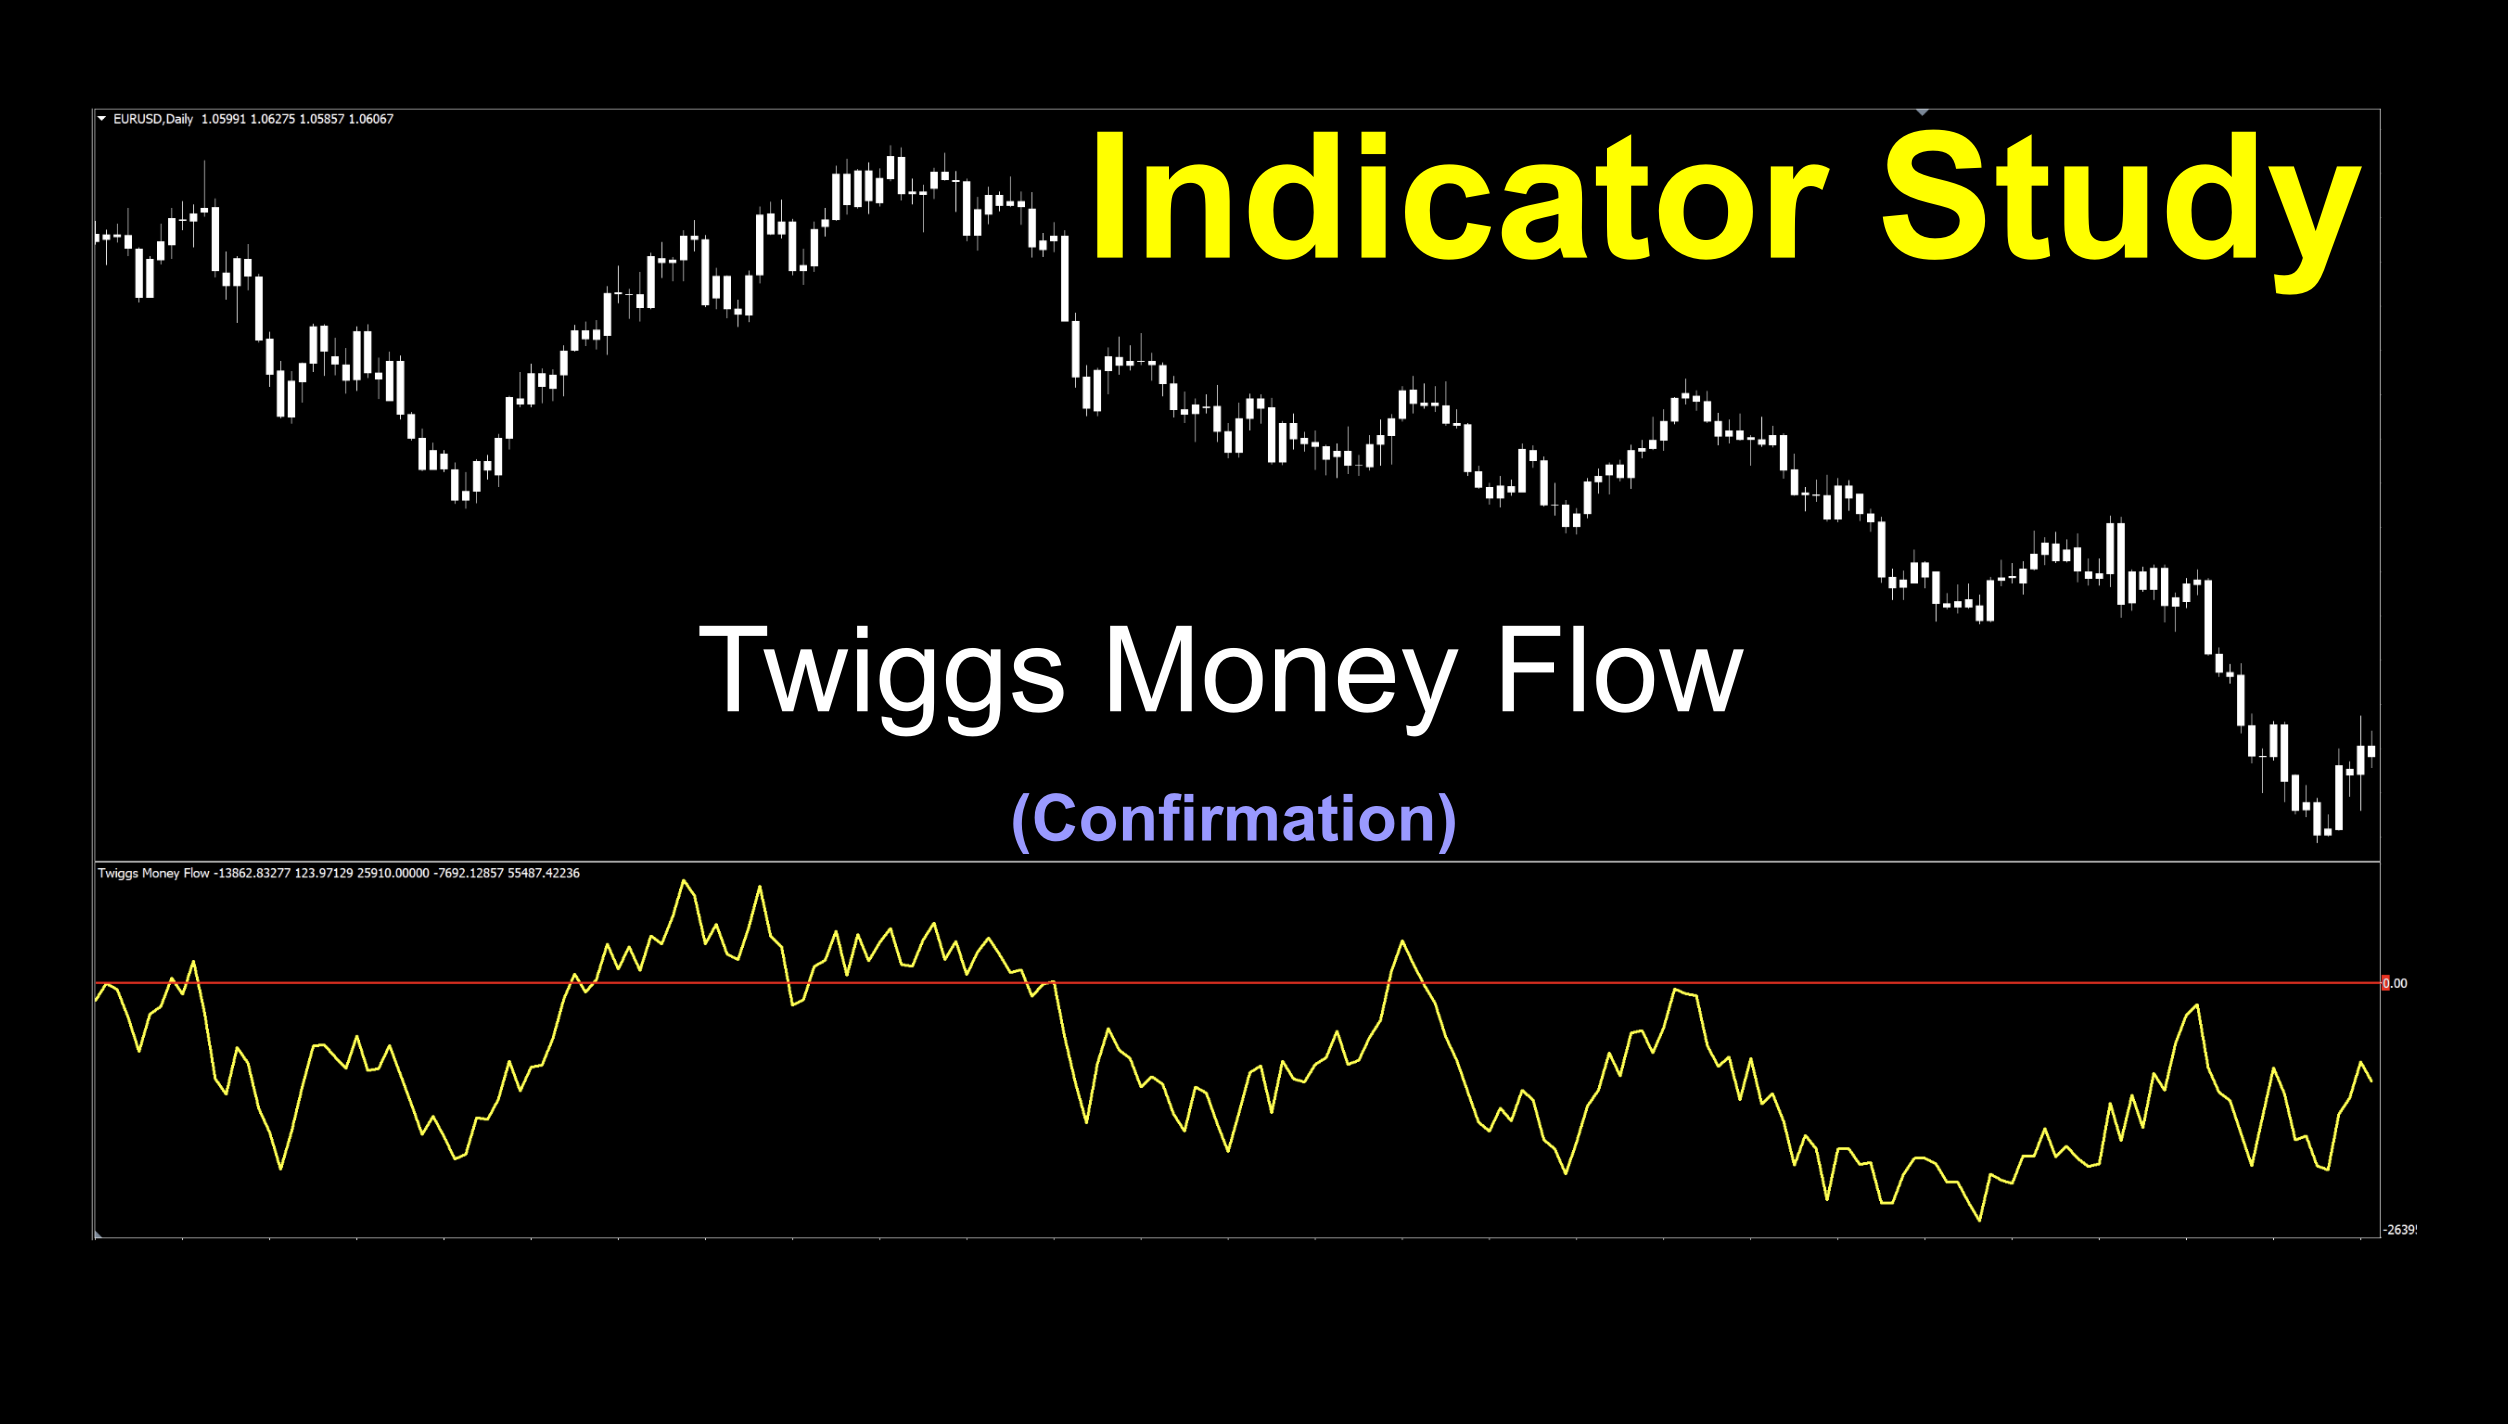
We’re going to look at the Twiggs Money Flow indicator. Developed in 2009 by Colin Twiggs, this indicator is a derivation of the Chaikin Money Flow, which in turn is derived from the Accumulation Distribution line (found on MT4). There are a couple of differences which we’ll examine briefly so, in a sense, you’ll learn a little something else along the way.
By the way, Mr. Twiggs is one accomplished individual. During our research, we discovered that he’s originally from South Africa and then moved to Australia in the late 90s. He forecasted the October 2007 bear market, a full eight months ahead of the sub-prime crisis and to balance all that out, he’s an enthusiastic golfer, surfer and swimmer, among other things.
Simple as a Dimple
The math involved is actually not that complicated and while it finds roots in Chaiken Money Flow, the differences are as follows:
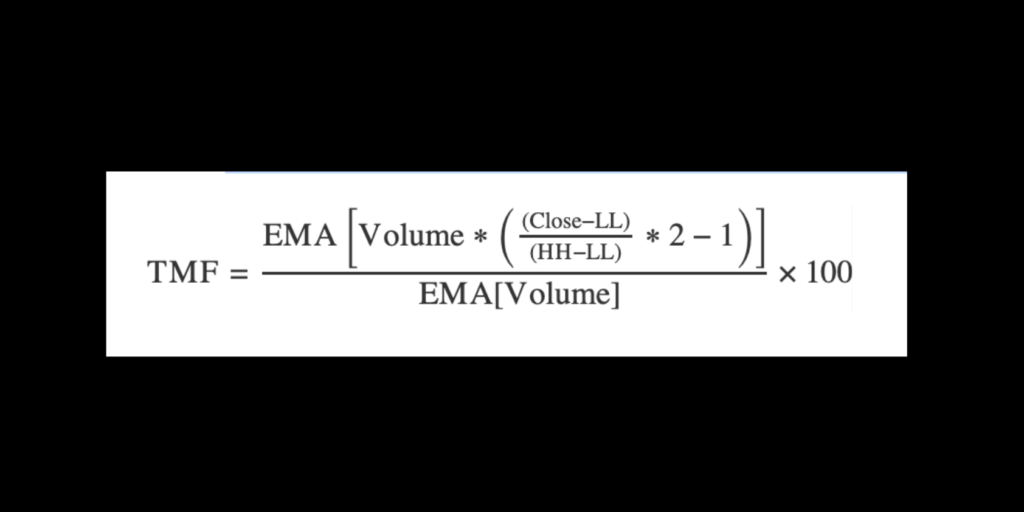
Twiggs’ Money Flow uses true range, and moving averages (EMA specifically) to determine direction and strength, while Chaiken Money flow relies on close location value (for volume) to determine bull versus bear price movement over a specified period. Clever, no?
Below are the variables used in the calculations:
EMA – Exponential Moving Average; applies price value data to more recent periods.
LL – Lowest Low; the lowest value of either the current low price or the previous day’s close.
HH – Highest High; the highest value of either the current high price or the previous day’s close.
Below you’ll find the formula in all its glory…
Confirmation Indicator
This indicator is considered an oscillating mid-line (and in this case zero-cross) that lives below your chart. It can make a great C1 or C2, depending on your algorithm. As an exit indicator, it has possibilities – but as you know, that can be somewhat subjective as each has their favorites. Who knows, this may be your new favorite!
Fresh
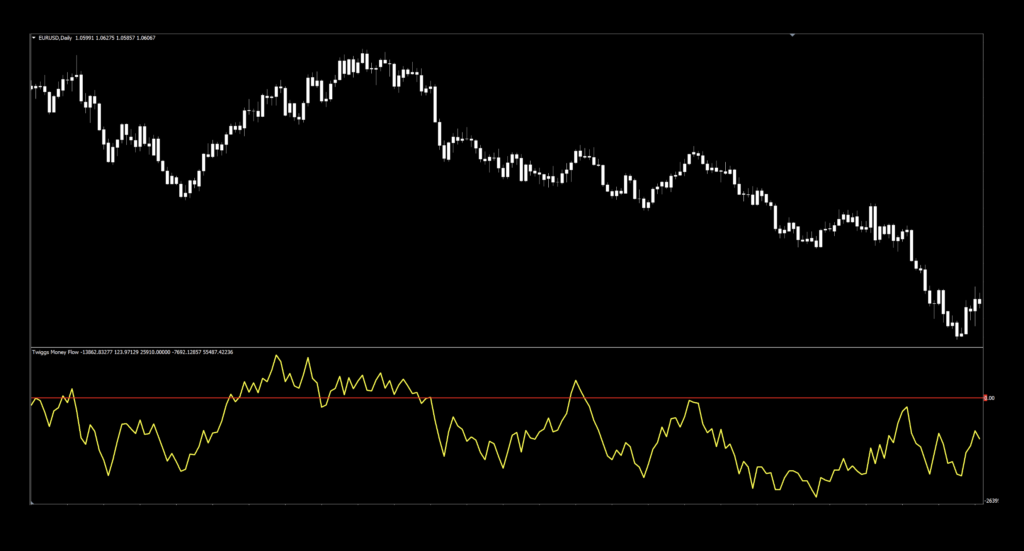
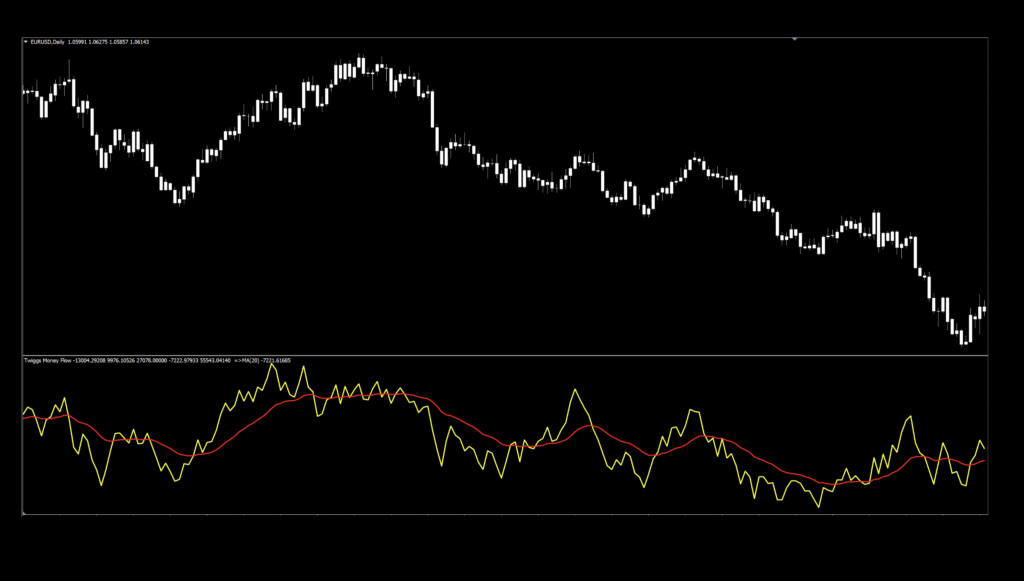
In the screenshot below, we’ve left the original yellow color but added a little dimension to the indicator to make it easier to see (we fattened it up). We also added a zero line in red. If you need reminding of how to add a zero line, check out last week’s Laguerre blog HERE for some tips. Naturally, we left price all white to minimize all those distracting colors, so we can concentrate on what’s important.
Settings
There is only one variable, which makes this an easy indicator to adjust.
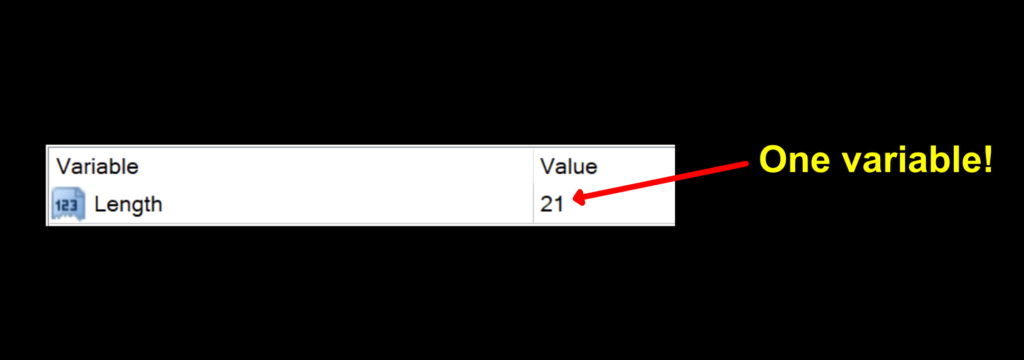
Length: The number of periods used to calculate the signal line. The default setting is 21.
Advantages
* One Level Cross creates easy to identify signals.
* Narrow testing across one variable.
* Can be used in more than one fashion.
How We Use It
This is going to be a two part conversation, if you happen to pick up on that third advantage.
We’ll talk about the first suggestion as a matter of interest, but we advocate using it the second way (as a zero cross), which is the way we’ll be testing it.
There were a few who suggested overlaying a moving average on top of the signal line and creating a two-lines-cross indicator, which looks like this.
Did I just hear, “How did you do that!?” from the audience? It just so happens that NNFX and SHF are all about education, and we’ll show you.
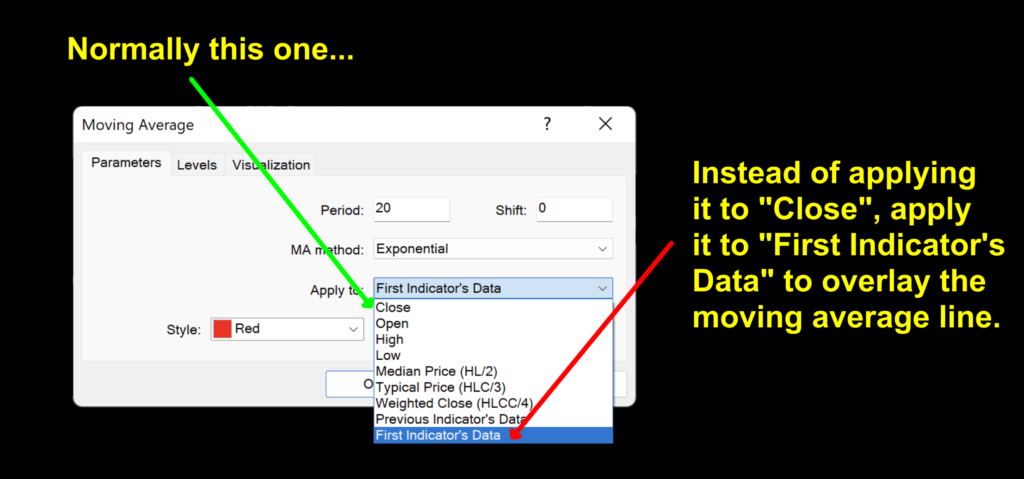
You’re going to add a moving line to the chart from the indicator menu on your platform – one that comes pre-installed. The cool thing here is that you now have more variables to play with. What kind of moving average line do you want? What period do you want to use? A new playground!
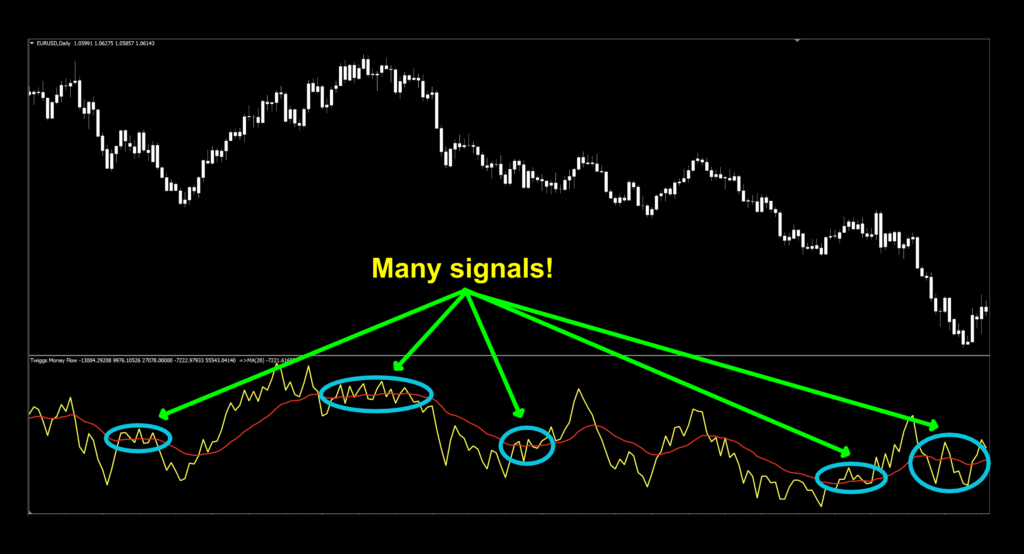
However, you need to be aware of problematic areas, as noted below.
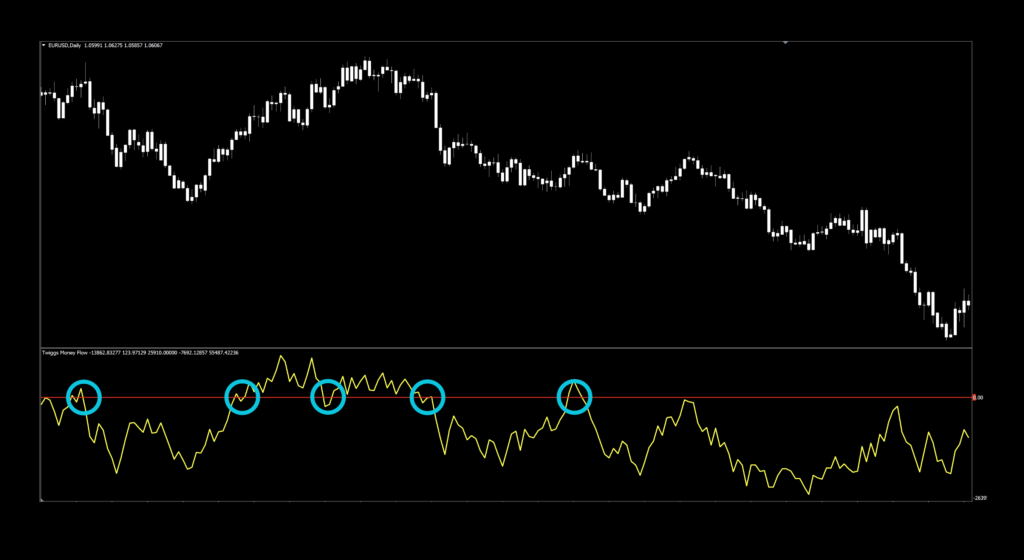
As we specified earlier, we’re going to use it as a zero-cross…and that being said, our signals are as follows;
Long signal – When the yellow signal line crosses and closes above the zero-line, the entry occurs on the open of the next candle.
Short signal – When the yellow signal line crosses and closes below the zero-line, the entry occurs on the open of the next candle.
Let’s see how this method compares…
Testing…Testing…Testing…
Remember, comprehensive analysis is strongly suggested, and we advocate backwards and forward testing indicators or systems prior to trading actual funds. We propose conducting your tests on the following pairs.
EUR/USD
AUD/NZD
EUR/GBP
AUD/CAD
CHF/JPY
CAD/SGD
If it doesn’t work on these 6 pairs, chances are it won’t work on other pairs. This is not an absolute, but we’ve found this rule is reliable in most cases.
The markets we test our indicators are the:
EUR/USD (Euro/US Dollar)
BTC/USD (Bitcoin/US Dollar)
XAU/USD (Gold/US Dollar)
SPX500 (S&P500 Index)
Timeframes and Results
In our initial test, we’ll run the Twiggs Money Flow indicator on the EUR/USD, BTC/USD, XAU/USD, and the SPX500 using the default settings across the daily and 4-hour timeframes on the MT4 strategy tester. We use the fast method of testing the indicator to get a general idea; however, you may also run the tick-by-tick data set for a more precise result (which takes considerably more time).
As No Nonsense Traders – and therefore Swing Traders, we will not examine shorter time frames in these studies. We will also run an additional test, using different values for the settings, to analyze which one may work better and examine the following results:
Total trades
Win/Loss ratio
ROI (return on investment)
There are other metrics included in the strategy tester report, which can be compared, but these three metrics provide the necessary gauge to make quick decisions as to the usefulness of a particular indicator and its settings.
Next, for comparison, we’ll explore the following;
Daily – 1 year
4-hour – 3 months
The reason exceptionally long (or short) testing periods are not included is due to changing market conditions, which might return irrelevant information. A balance of statistically significant data is necessary for accurate results.
And the Outcome…
Below are the spreadsheets illustrating the results from our tests.
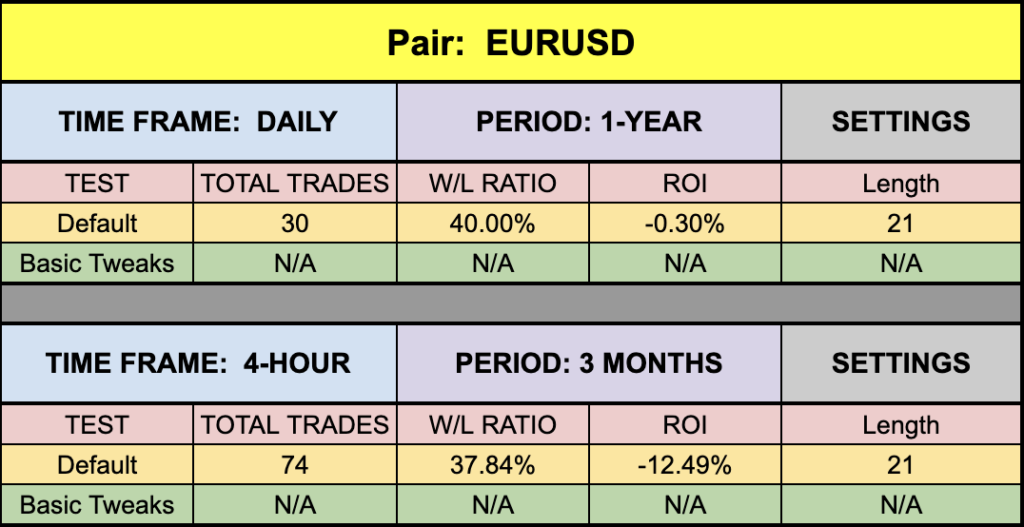
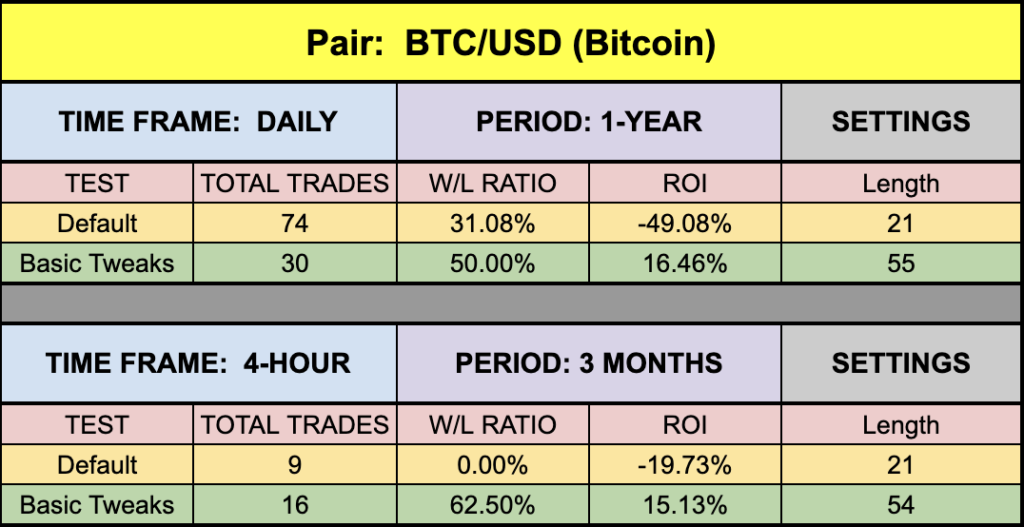
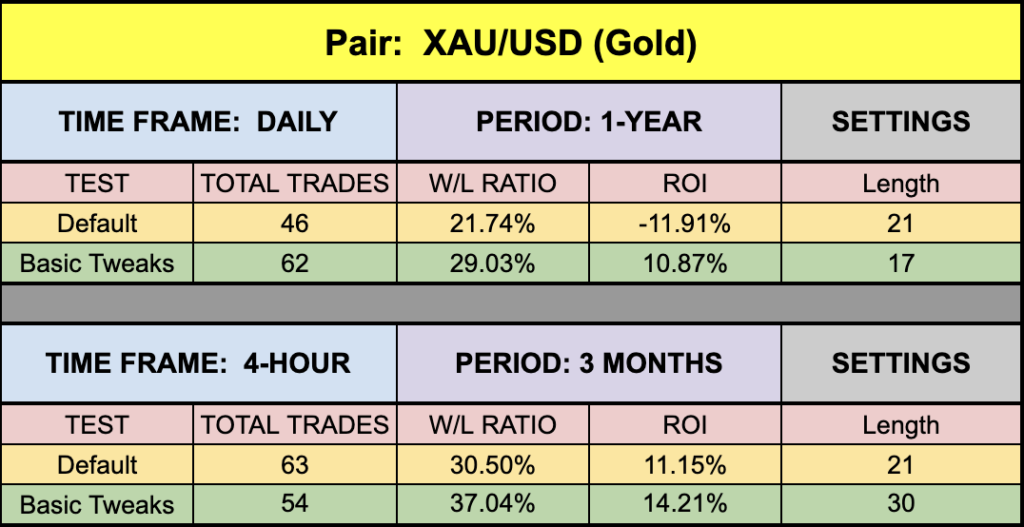
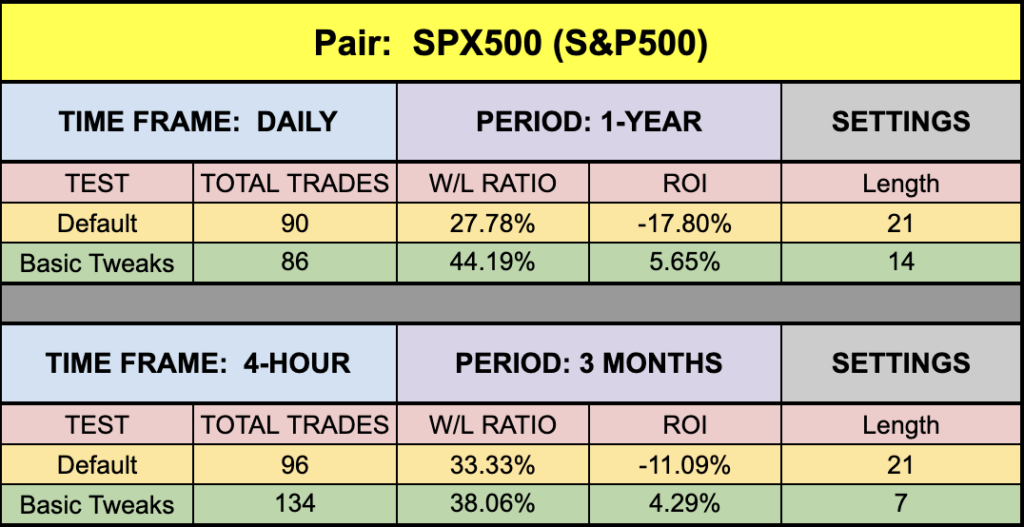
The green highlighted rows represent “basic tweaks” on the settings which returned better results. Are these the best? Not necessarily. Given that variables including testing date range and broker data are different from person to person, you may find better settings.
Oddly Weird
Interesting…for the first time, we were not able to find a winning combination for the EUR/USD for the time span tested. Does that always mean it won’t work? Not hardly. The market moves and shakes, and a time will come when it does work better on specific pairs. But if you’re a bitcoin or gold trader, this is a great one to experiment with!
Trust In Yourself
Remember, the overall NNFX philosophy of taking profit, risk, and drawdown is that YOU are creating a system which YOU will be trading. Don’t let anybody else take that away from you. Part of the learning process is digging in and doing the work yourself. To learn more about these topics, check out the Advanced Course!
That being said, the results we post in these blogs should never be considered specific trading advice.
***Note: Remember, never use just this one indicator as your decision of whether to open or close a trade. It should be part of a system.
Money Management
If you are curious as to what money management is used on our tests; we have a certain way of determining wins and losses, which can be found in the Advanced Course. Our goal here is to determine how well the indicator reacts to price with respect to producing a long or short signal. Your system, with its risk profile, will dictate individual returns.
Resources
As we did with past indicator studies, we’ve made the Twiggs Money Flow indicator is available for download on our site from the indicator library. We will keep adding better indicators with each study for your use, at no charge. When you’re ready to get it, click HERE.
More to Come
There’s a lot more to come. We are excited to provide more trading tips in the near future. Sign up on our contacts page or subscribe to our YouTube channel. Receive early notifications as we continue to publish helpful, relevant, and informative Forex related material to support your quest to become a better trader.
And, now you are aware of another indicator that many traders don’t know or use.
Our only goal is to make you a better trader.
BTW – Any information communicated by Stonehill Forex Limited is solely for educational purposes. The information contained within the courses and on the website neither constitutes investment advice nor a general recommendation on investments. It is not intended to be and should not be interpreted as investment advice or a general recommendation on investment. Any person who places trades, orders or makes other types of trades and investments etc. is responsible for their own investment decisions and does so at their own risk. It is recommended that any person taking investment decisions consults with an independent financial advisor. Stonehill Forex Limited training courses and blogs are for educational purposes only, not a financial advisory service, and does not give financial advice or make general recommendations on investment.