Welcome
Welcome to the next Stonehill Forex indicator study. We’ve been busy finding indicators which return better signals than the “boxed set” found on the Metatrader 4 platform. We feel that these indicators may yield superior results than older indicators, better suited for different markets.
Our Next Choice…
We want to introduce The Trend Trigger Factor (TTF), which has made its way onto our radar; with a few adjustments for easier signal identification. The origin of this indicator can be traced back to the December 2004 edition of the Technical Analysis of Stocks and Commodities magazine by M. H. Pee, who developed an indicator similar to a Laguerre indicator, displaying comparable characteristics.
Arithmetic and Other Goodies
Math is what makes our world go round, and this indicator is no different. Interestingly, the actual computations are not complicated, but discovering how to put them together is magic…
Step One
First, we need to calculate buying and selling “power”. By the way, the default TTF value is “8”, so we’ll be using that in the formula:
8 day buy power = Highest high of (day 1 to day 8 inclusive) / Lowest low of (day 9 to day 16 inclusive)
8 day sell power = Highest high of (day 9 to day 16) / Lowest low of (day 1 to day 8)
Step Two
After calculating these variables, you can now calculate the TTF:
8-day TTF = ((Buy power / sell power)/(0.5*(Buy power + sell power))) * 100
The denominator of the TTF is the average range of two 8-day periods, where the first period refers to days 1-8, and the second period refers to day 9-16:
0.5*(Buy power + sell power)=
0.5*((Highest high of first period / Lowest low of second period) + (Highest high of second period / Lowest low of first period)) =
0.5*((Highest high of first period / Lowest low of first period) + (Highest high of second period / Lowest low of second period)) =
((Range of first period) + (Range of second period))/2 =
Average of the ranges in the first and second periods.
***
Manually calculating this indicator by hand would be no small feat, therefore, we once again thank the computer processing gods for their help.
Confirmation Indicator
As a “confirmation indicator”, its job is to serve as an initial checkpoint AFTER the baseline indicator provides you with the anchor of your algorithm. You’ll also notice that this indicator is a below-chart “zero-line” cross.
Exit Here?
This indicator can be used as an exit indicator; however, is it the best choice? It depends. For some, the exit signal may come too early or too late and for others, just right. The point of finding a good exit indicator can only be discovered through back testing. If you find a different indicator which provides better exits, use that. No one will think any less of you. In fact, it demonstrates that you are a true indicator scout.
Such an Alluring Portrait
In the screenshot below, we’ve plotted the indicator in its original form, before we make our changes. We’ve changed the candle colors to white to remove bias from the chart, which allows focusing strictly on the indicator. The default view is somewhat difficult to see against a black background, so we’ll be changing things to better illustrate how we use this indicator.
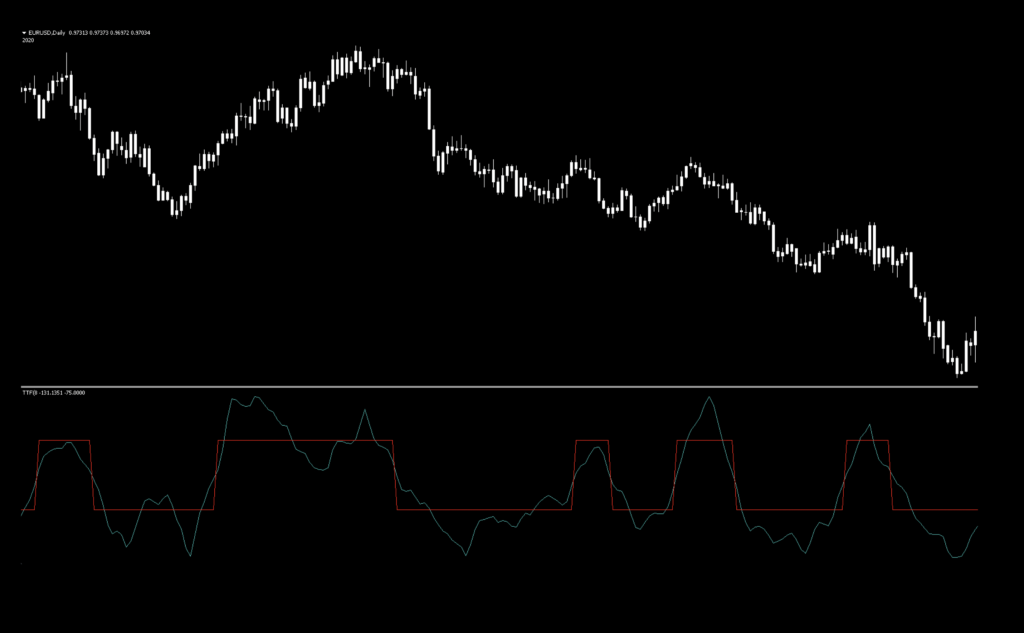
One of These is Not Like the Other
First, we’re going to remove the blue line. You may ask why, after all, it’s part of the Mr. Pee’s work. We’ve discovered that the signals are easier to decipher and, overall, gave us better entries. The default settings with the blue line attempt to identify overbought/oversold areas, foretelling reversals, but since we don’t subscribe to crystal ball shenanigans, we’re just going to stick with the red signal line. However, you are more than welcome to use it as it was originally designed.
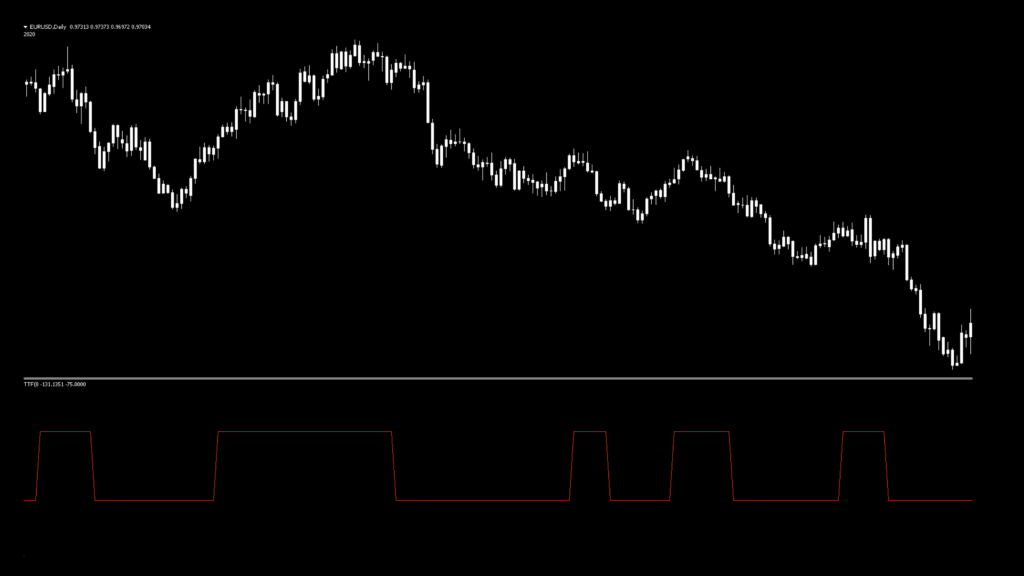
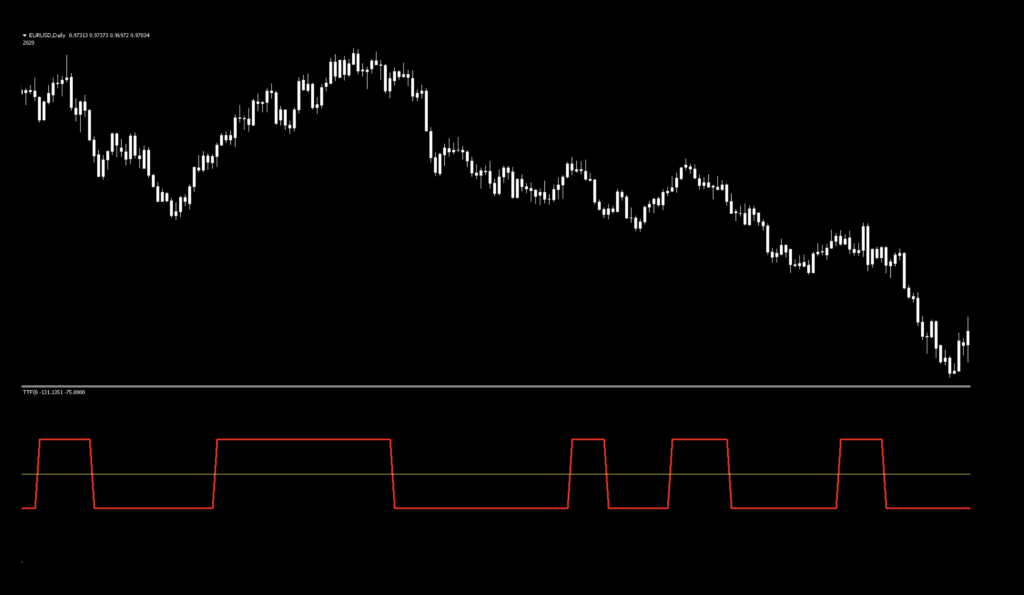
Now, we’re going to add the “zero line” in yellow and lastly, we’ll brighten up the red signal line for better visibility.
Settings
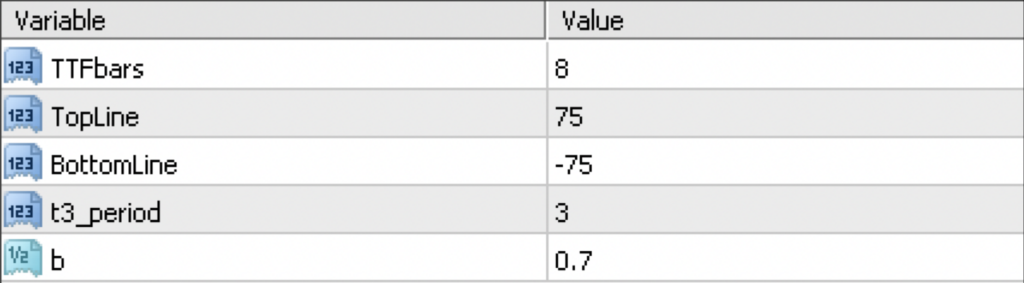
TFF Bars: The number of bars is what determines the look back period in the calculations. The lower the number, the more false signals. The default setting is 8.
BottomLine: The most extreme distance of the red signal line from the zero line. Since we’re not using the signal line with filter line, you can leave these on their default values of “75” and “-75”.
t3_period: This is a smoothing filter which smooths out the signal. The original version in 2004 did not have this, so it makes for an additional setting to help tweak for better results. The default value is 3.
b: This setting adjusts the reactivity, or sensitivity, of the signal line. The higher the number, the more sensitive the indicator is to price change. The default setting is 0.7.
Advantages
* One Level Cross create easy to identify signals.
* Can be used as an exit signals.
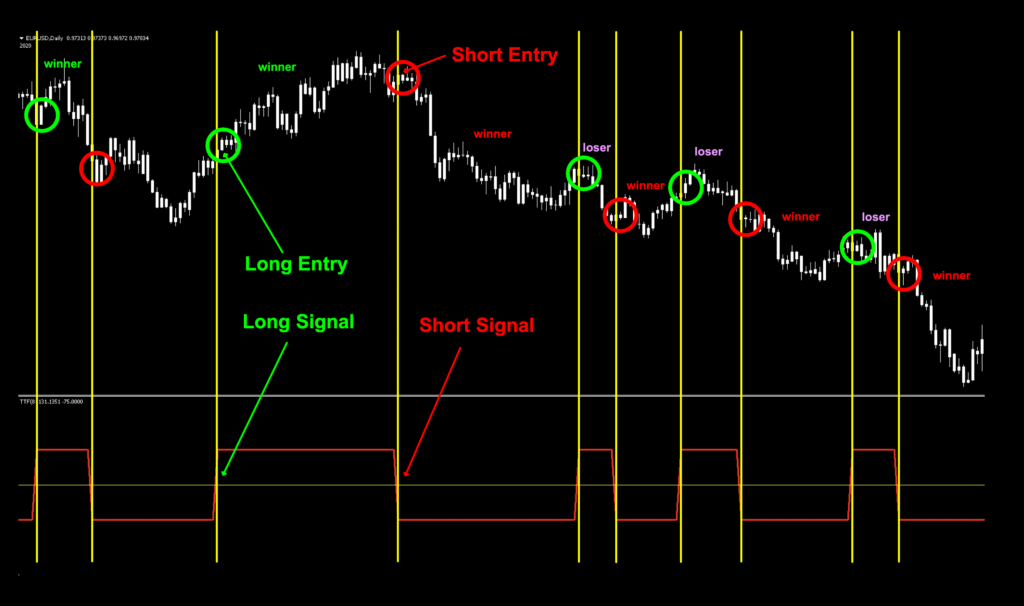
How we use it
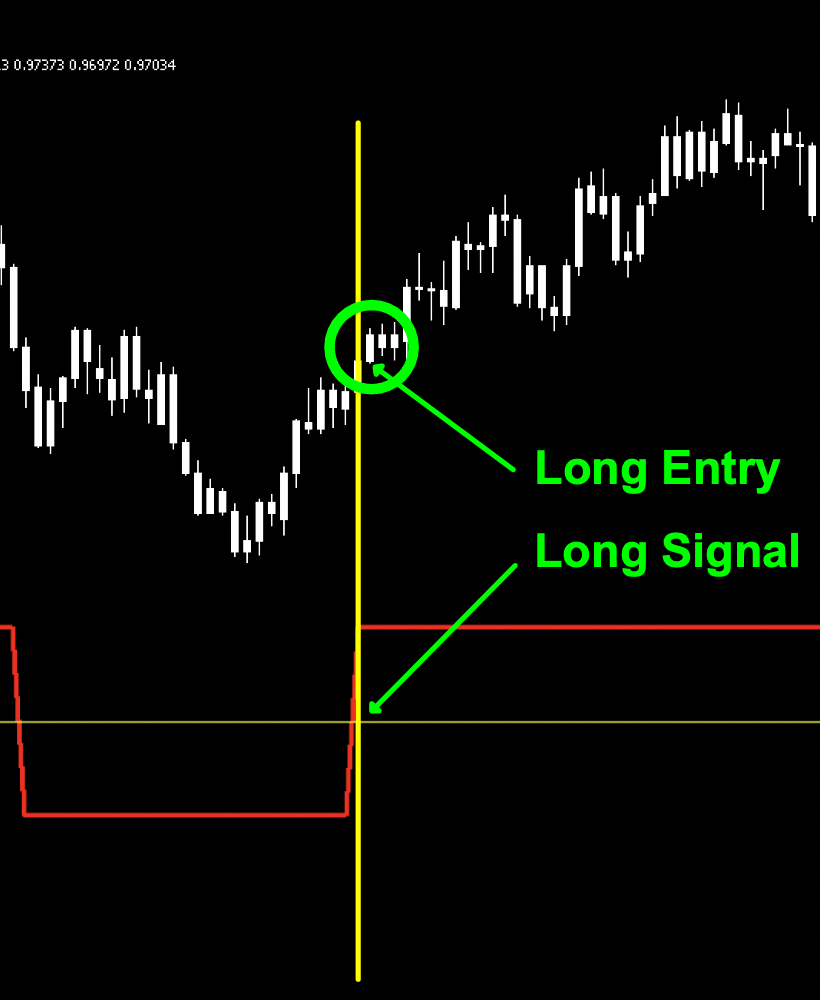
Long signal – When the red signal line crosses above the “zero line”, the entry occurs on the open of the next candle.
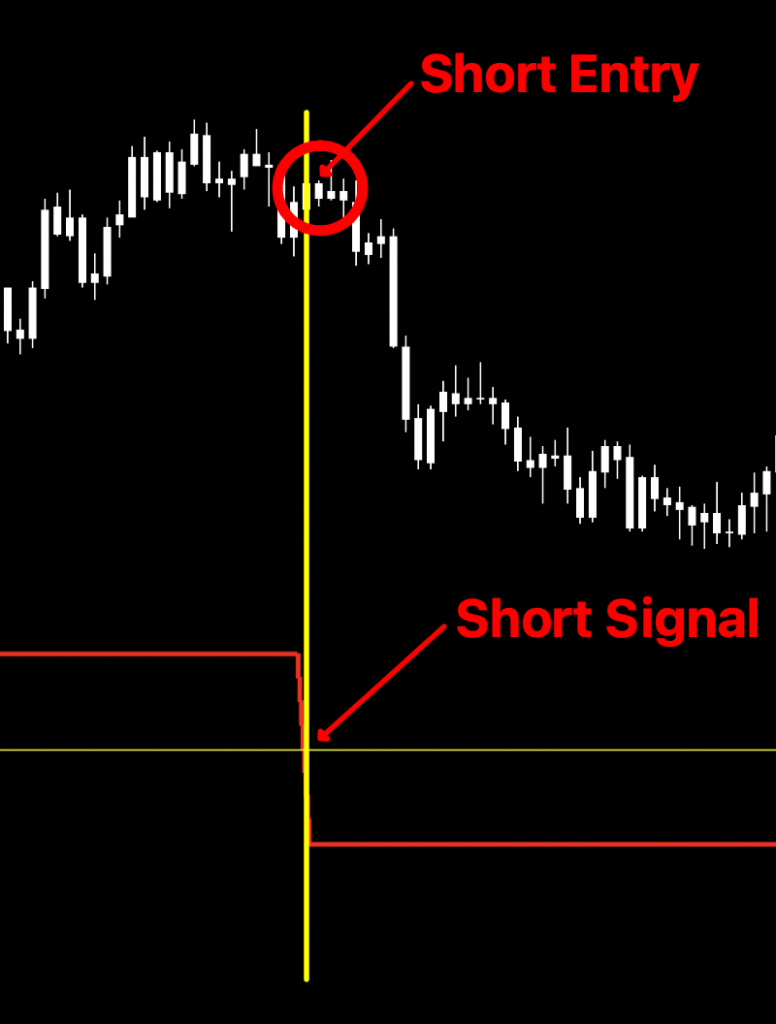
Short signal – When the red signal line crosses below the “zero line”, the entry occurs on the open of the next candle.
Let’s take a look at a marked up chart to see what we’re talking about.
Zoomies!
Let’s take a quick look at one long and one short signal and trade entry. We’ll compress the chart and indicator to provide us with a clear understanding.
We’re Long!
We’re Short!
Why We Remove Components
This is not the first indicator where we’ve removed, ignored, or changed specific components. Is this a bad thing? Are we breaking any rules? Nope. The beauty of indicators is they can be used in different ways. For example, let’s briefly review the standard stochastic oscillator. It’s been around since the 1950s and has been used as;
1. Overbought/oversold – attempting to call reversals based on trader (or market) sentiment.
2. Two line cross – traders use the indicator line and signal line to provide long/short signals based on which line crosses over which.
3. Divergence – as discussed in the prior blog, divergence is suggested when the highs/lows of an indicator are opposite of price. This attempts to foretell reversals in price may be on the horizon.
4. Zero-line cross – when one or both of the lines crossed above and below zero.
In the DiNapoli Stochastic blog, we did just that – used the indicator a little differently than it was originally intended.
Testing…Testing…Testing
Remember, comprehensive analysis is strongly suggested, and we advocate backwards and forward testing indicators or systems prior to trading actual funds. We propose conducting your tests on the following five pairs.
EUR/USD
AUD/NZD
EUR/GBP
AUD/CAD
CHF/JPY
If it doesn’t work on these five pairs, chances are it won’t work on other pairs. This is not an absolute, but we’ve found this rule is reliable in most cases.
We’ve added two other pairs to our testing sequence based on feedback we’ve received from our community. They are the:
BTC/USD (Bitcoin/US Dollar)
XAU/USD (Gold/US Dollar)
Timeframes and Results
In our initial test, we’ll run the Trend Trigger Factor indicator on the EUR/USD, the BTC/USD and XAU/USD using the default settings across the daily and 4-hour timeframes on the MT4 strategy tester. We use the fast method of testing the indicator to get a general idea; however, you may also run the tick-by-tick data set for a more precise result (which takes considerably more time).
As No Nonsense Traders – and therefore Swing Traders, we will not examine shorter time frames in these studies. We will also run an additional test, using different values for the settings, to analyze which one may work better and examine the following results:
Total trades
Win/Loss ratio
ROI (return on investment)
There are other metrics included in the strategy tester report, which can be compared, but these three metrics provide the necessary gauge to make quick decisions as to the usefulness of a particular indicator and its settings.
Next, for comparison, we’ll explore the following;
Daily – 1 year
4-hour – 3 months
The reason exceptionally long (or short) testing periods are not included is due to changing market conditions, which might return irrelevant information. A balance of statistically significant data is necessary for accurate results.
And the Outcome…
Below are the spreadsheets listing the results from our tests.
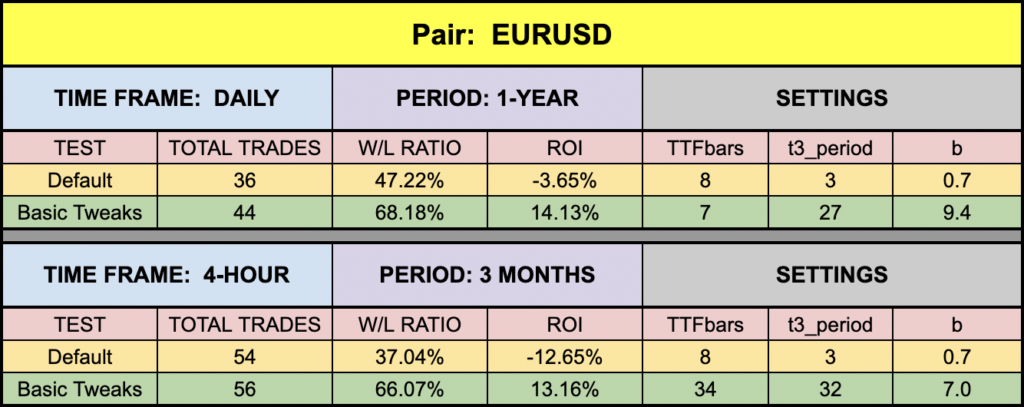
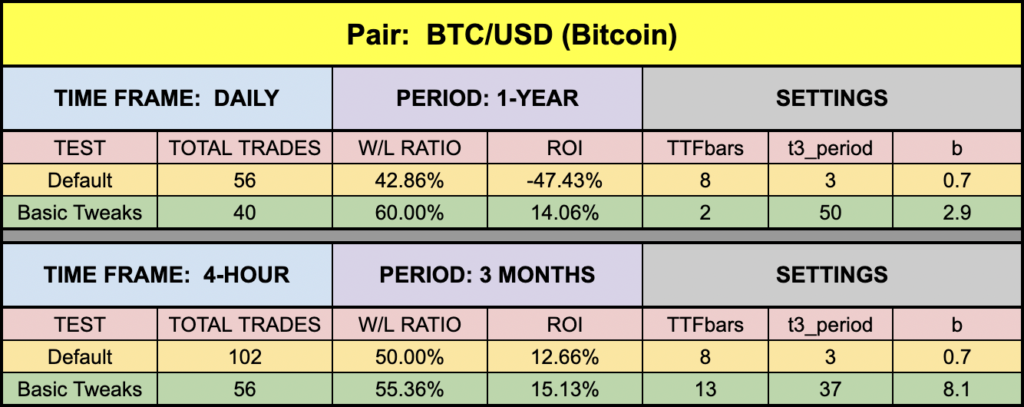
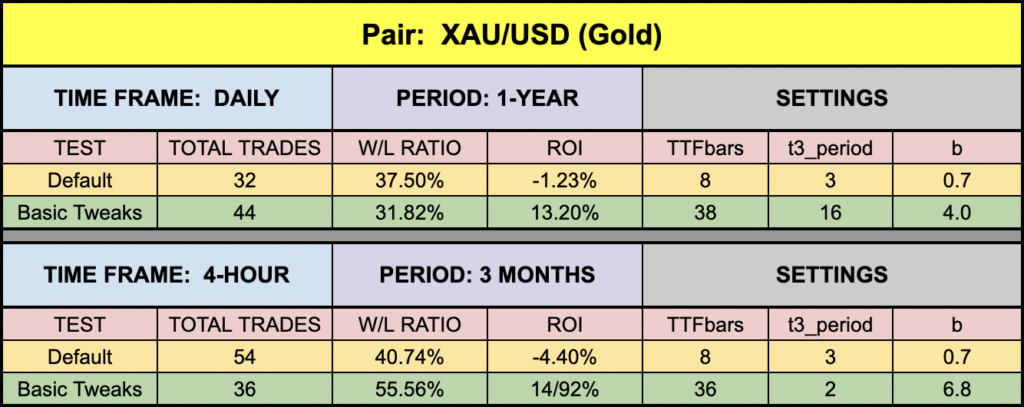
The green highlighted rows represent “basic tweaks” on the settings which returned better results. Are these the best? Not necessarily. Given that variables including testing date range and broker data are different from person to person, you may find better settings.
Trust in Yourself
Remember, the overall NNFX philosophy of taking profit, risk, and drawdown is that YOU are creating a system which YOU will be trading. Don’t let anybody else take that away from you. Part of the learning process is digging in and doing the work yourself. To learn more about these topics, check out the Advanced Course!
That beings said, the results we post in these blogs should never be considered specific trading advice.
***Note: Remember, never use just this one indicator as your decision of whether to open or close a trade. It should be part of a system.
Money Management
If you are curious as to what money management is used on our tests; we have a certain way of determining wins and losses, which can be found in the Advanced Course. Our goal here is to determine how well the indicator reacts to price with respect to producing a long or short signal. Your system, with its risk profile, will dictate individual returns.
Resources
As we did with past indicator studies, we’ve made the Trend Trigger Factor indicator available for download on our site from the indicator library. We will keep adding better indicators with each study for your use, at no charge. When you’re ready to get it, click HERE.
More to Come
There’s a lot more to come. We are excited to provide more trading tips in the near future. Sign up on our contacts page or subscribe to our YouTube channel. Receive early notifications as we continue to publish helpful, relevant, and informative Forex related material to support your quest to become a better trader.
And, now you are aware of another indicator that many traders don’t know or use.
Our only goal is to make you a better trader.
BTW – Any information communicated by Stonehill Forex Limited is solely for educational purposes. The information contained within the courses and on the website neither constitutes investment advice nor a general recommendation on investments. It is not intended to be and should not be interpreted as investment advice or a general recommendation on investment. Any person who places trades, orders or makes other types of trades and investments etc. is responsible for their own investment decisions and does so at their own risk. It is recommended that any person taking investment decisions consults with an independent financial advisor. Stonehill Forex Limited training courses and blogs are for educational purposes only, not a financial advisory service, and does not give financial advice or make general recommendations on investment.