Welcome to the next Stonehill Forex Indicator Study. This research represents an investigative look into how and why some indicators work and some don’t work as well.
New Versus Old
We are introducing indicators not included with the MT4 platform to find more efficient indicators which may yield superior results than older indicators better suited for different markets.
Presenting…
We’re spotlighting a familiar type of indicator this week, called the DiNapoli Stochastic. There are different ways traders use this indicator; however, we’re going to make it easy for you by demonstrating what we think is the clearest. We’re also going to explain a few key components of the indicator, so you have a better understanding of what this indicator can and cannot do.
Two Stage Development
The original concept of a Stochastic Oscillator was developed in the late 1950s by George Lane. Throughout the decades, it has provided a foundational base for traders and coders to further develop many variations which are better suited to the Forex market. If you’re interested in reading a more in-depth study of Mr. Lane, click HERE.
The version we’re going to look at was developed by a long time trader named Joe DiNapoli in 1998 and described in his book, “Trading With DiNapoli Levels”. The advantage of his design was to create a smoother response than the original version, which provides more reliable signals. If you’d like to read more about his book, click HERE.
Magic and Wizardry?
How did he do this? In DiNapoli’s version, something called “noise filtering” is used which is a slower reaction to price…and anything slower means more lag, so be aware of this when changing the settings. There is an advantage to a smooth line – less false signals. That’s a good thing. We’ll explore this further…
Parts & Components
Before we get into the indicator, you should probably know a few components which make up the indicator. It has two lines; the indicator itself, is termed “%K” and reflects momentum measurement, comparing closing price to the trading range over a given period. The Signal line is a 3-day simple moving average of %K, and called “%D”.
Go Math!
We’re going to take a quick look at the difference between the standard stochastic and DiNapoli’s stochastic.
The standard stochastic is as follows:
To calculate the %K (using a period of 8): 100[(C – L8) / H8 – L8)]
Where:
C = Latest Close
L8 = Lowest low for the last 8 periods.
H8 = Highest high for the same 8 periods
To calculate the signal line – %D:
Simple moving average of %K (3 period simple moving average)
***
In DiNapoli’s version, the math looks like this…
Fast%Dt(H,L,C,nFastk,nFastD) = EMAt(Fast%K(H,L,C,nFastK),nFastD)
Slow%Dt(H,L,C,nFastK,nFastD,nSlowD) = Slow%Dt-1(H,L,C,nFastK,nFastD,nSlowD) + (Fast%Dt(H,L,C,nFastK,nFastD) – Slow%Dt-1(H,L,C,nFastK,nFastD,nSlowD))/nSlowD
Essentially, he uses a smoothing method to filter out noise in the price movement. Bottom line – Let’s all thank our computers for doing the math, so we don’t have to!
Confirmation Indicator
Don’t forget, this indicator is considered a “confirmation indicator” which falls into the category of indicators that serve as an initial checkpoint after the baseline indicator provides you with a foundational signal. You’ll also notice that the default view of the DiNapoli Stochastic, is an “below-chart two lines cross” but we’re going to test it as a One Level cross. Confused? Don’t be – we’re going to explain it. The way we use it is the easiest.
Exit, Stage Left?
One Level Cross signals make decent exit signals, so you can certainly test this in when performing your back testing work. Of course, you may find better indicators, but, this might make a good place to start. Just looking at the default settings, it can be a bit choppy so in this instance, it might not make the best exit indicator. The results your algorithm returns will help you decide if this is the best exit indicator for your system.
We’ve Got The Blues
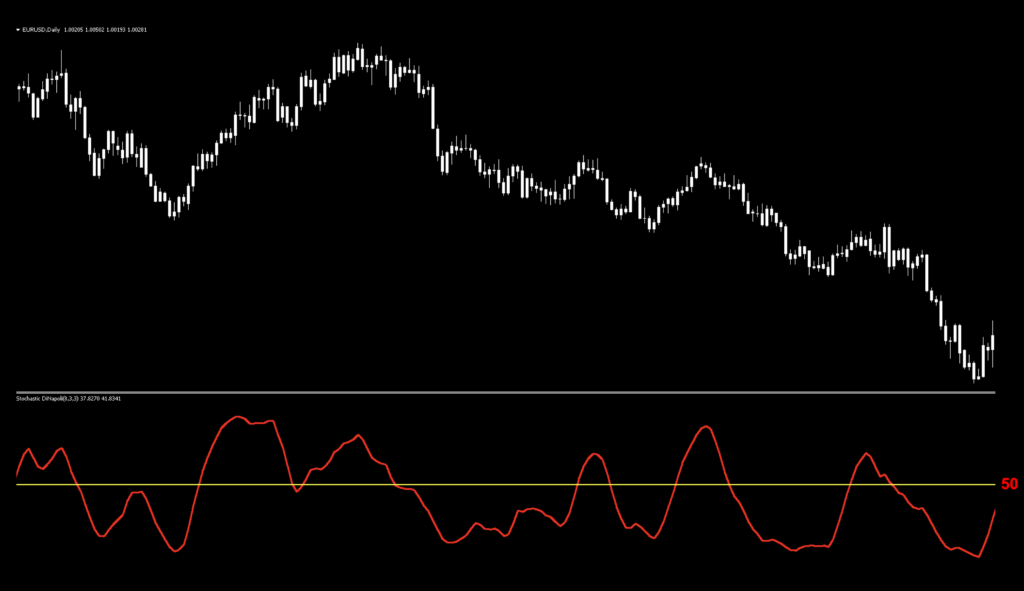
Below is a screenshot of what the original indicator looks like on the daily time frame. Note that we’ve changed the color of the candles to white to remove any emotional bias and that only the indicator is prominent. Unfortunately, the default colors don’t print well on a black chart, so we’ll be changing things as we go along to create a much clearer view.
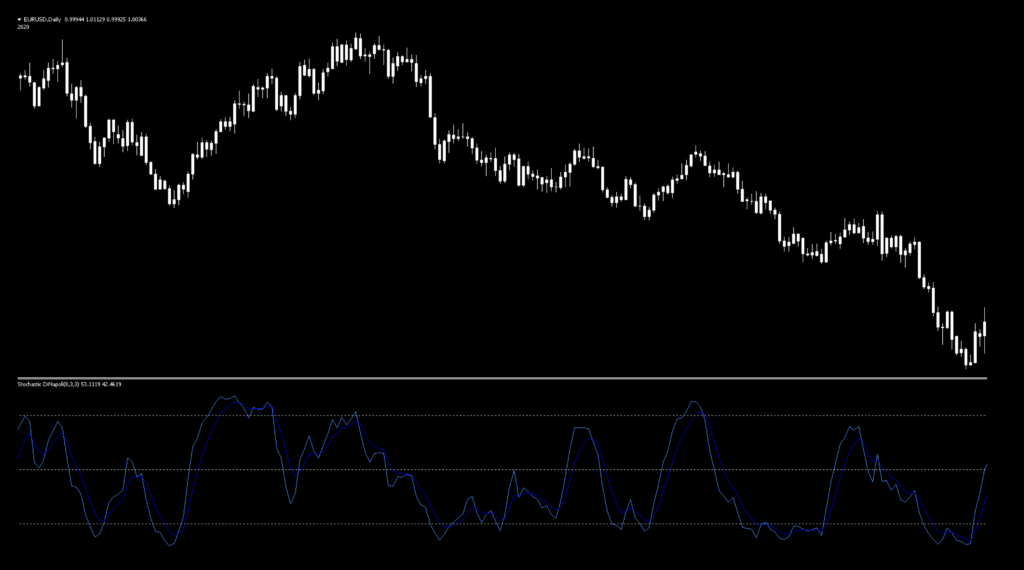
The first thing we’re going to do is get rid of the %K line (that’s the lighter blue line) and we’ll brighten up the %D line (the darker blue line) to an easy to see red – which is what we’ll use for our signaling purposes.
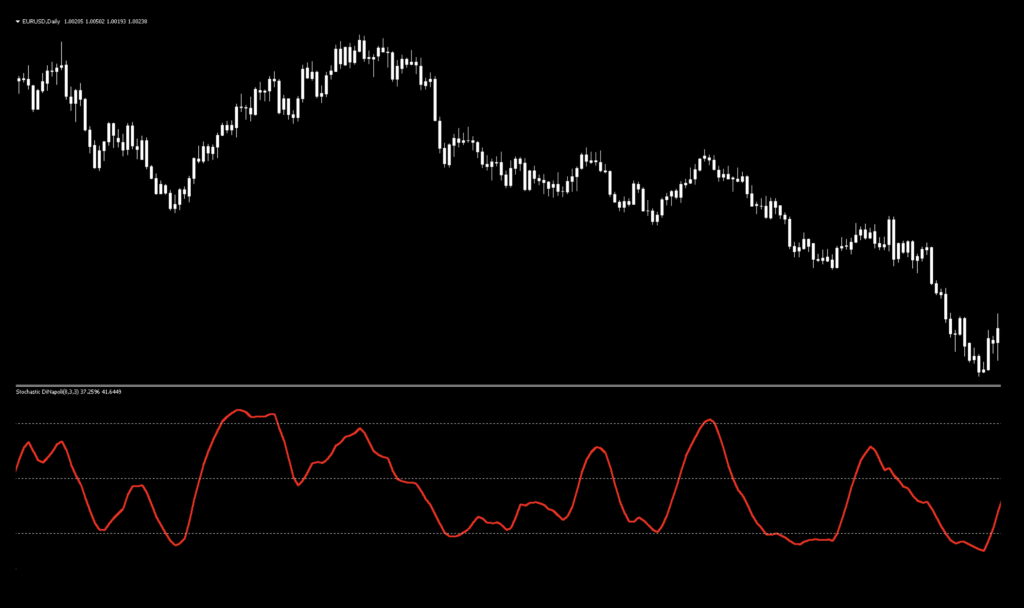
Better, no?
How we don’t use it
This part is a little bit of a departure from our normal discussion. But, it is important. This indicator, as an oscillator (meaning it cycles up and down), was originally thought to foretell “overbought” and “oversold” conditions. That may work in stocks, commodities where trader sentiment exists, but in Forex, overbought and oversold just isn’t a thing. We actually have a lesson on that very topic in the Advanced Course. That being said, we take out the 20 and 80 levels in the settings and use the indicator strictly as a One Level Cross (using the “50” line). Keep it simple…you’ll thank us later.
Removing the 20 and 80 Levels
Open the properties window for the indicator and click on the “levels” tab. You’ll want to remove just the 20 and 80 levels and click “OK” as noted in the images below. We also changed the color of the level to yellow to make it easier to see for our example.
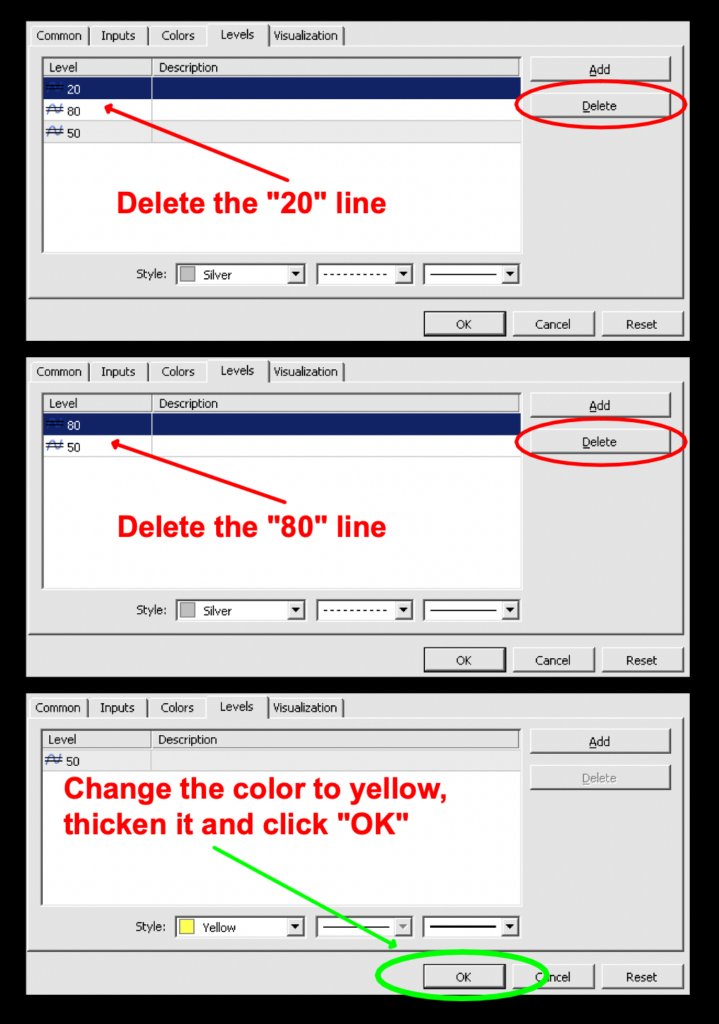
Once you have removed the levels, your chart will look cleaner, like this.
Another Thing We Don’t Do
Divergence: The price moves in the opposite direction of an indicator. It attempts to foretell the current price trend may be weakening, and in some cases may lead to the price changing direction. We don’t use divergence when trading. You are not a wizard, warlock, or witch.
And this means?
In a word, reversals. We are NOT reversal traders, remember? We are TREND traders. That means, we don’t guess when price is going to reverse. It could be the next period, or it could be in 20 periods…or even more. Trying to catch a top or bottom is dangerous business. Stick to what you can see and act upon, not what you think might happen.
How We Use It
As a One Level Cross, we get our signals when the line crosses the center line (50). The signal is confirmed at the close of the candle, which means, you make your move on the open of the next candle. In the image below, we’ve compressed the chart and indicator to make it easier to see the signals.
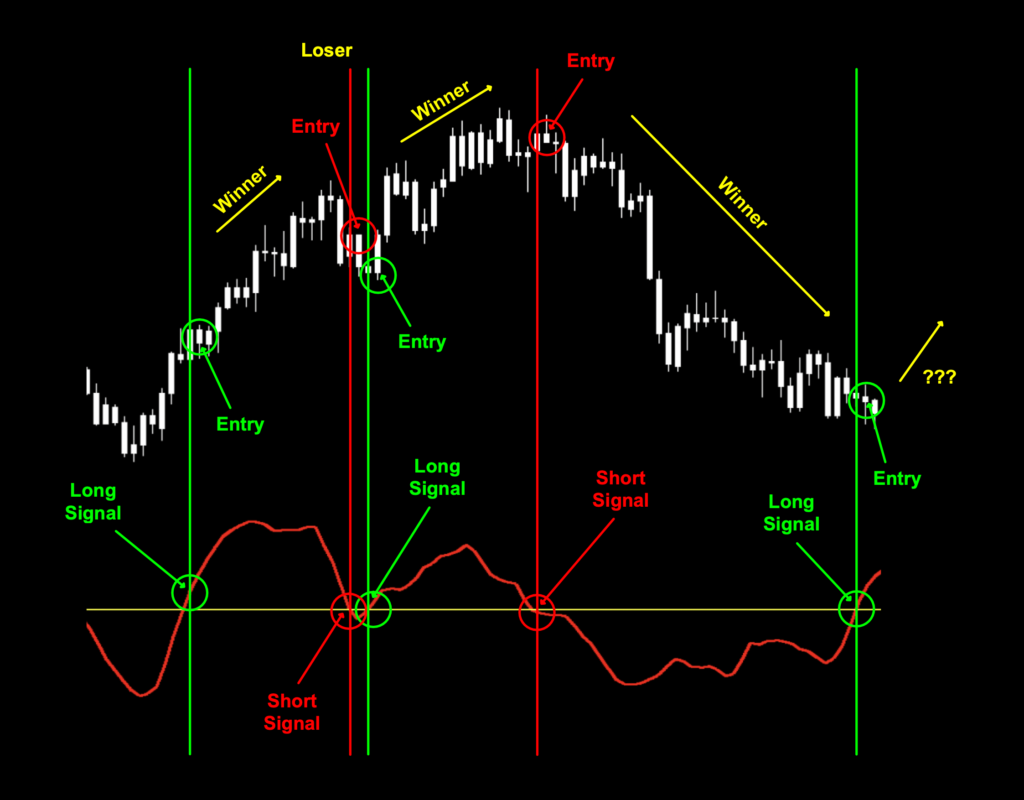
Signals
Long – The signal is when the red line crosses above the “50”. The entry is the open of the period immediately following the close of the signal candle.
Short – The signal is when the red line crosses below the “50”. The entry is the open of the period immediately following the close of the signal candle.
Zoom Zoom
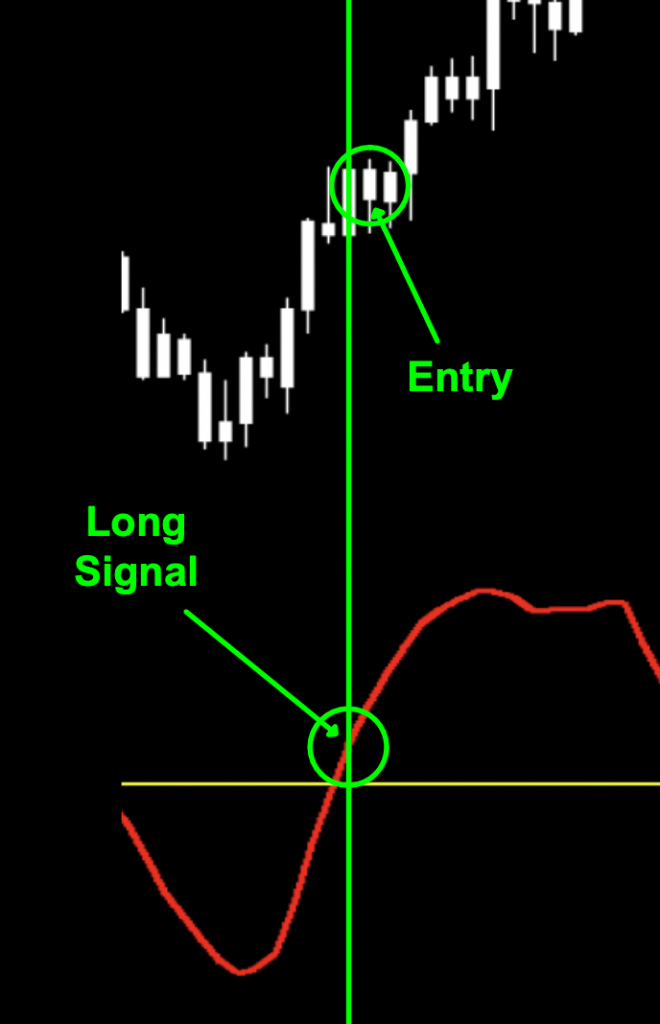
Let’s zoom in on that long signal.
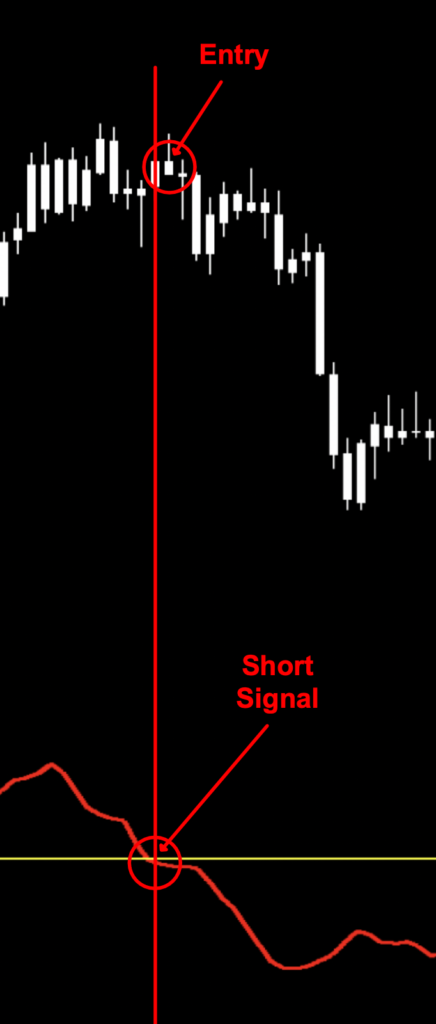
While we’re at it, let’s take a look at a short signal.
Advantages
* One Level Cross signals make good entry signals
* Can be used as an exit signals.
* Easy to interpret.
Settings
FastK: Fast K% measures the closing price compared to specified look back periods. The default setting is 8.
SlowK: Slow K%, is a shorter-term look back period with less smoothing. The default setting is 3.
SlowD: D% is a second smoothing average. The default setting is 3.
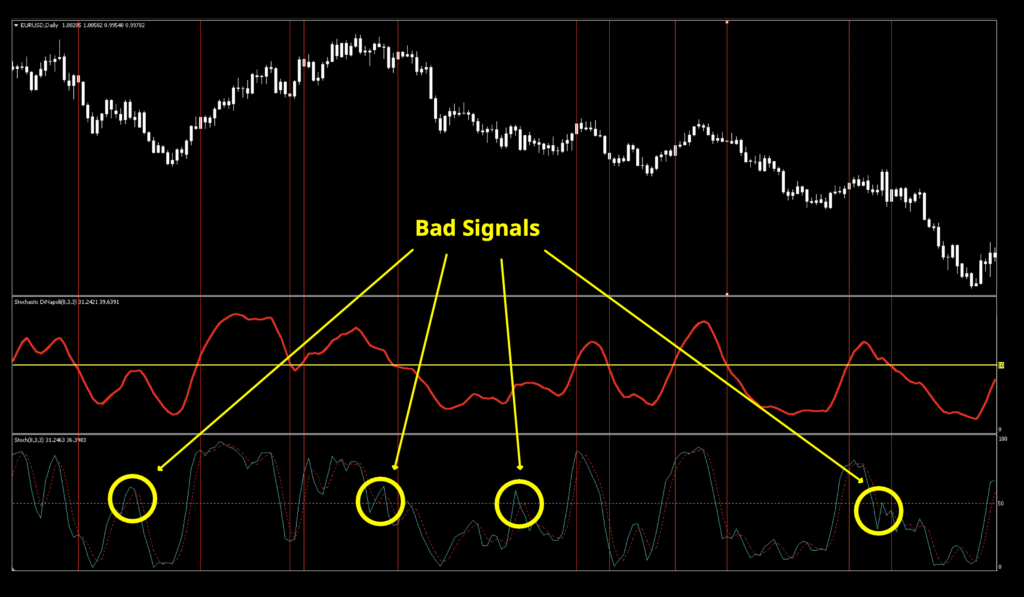
Some of you may be asking – how different does it look than the standard stochastic. We’ve got a marked up screenshot illustrating that DiNapoli’s version is smoother, with less false signals.
Testing…Testing…Testing
Remember, comprehensive analysis is strongly suggested, and we advocate backwards and forward testing indicators or systems prior to trading actual funds. We propose conducting your tests on the following five pairs.
EUR/USD
AUD/NZD
EUR/GBP
AUD/CAD
CHF/JPY
If it doesn’t work on these five pairs, chances are it won’t work on other pairs. This is not an absolute, but we’ve found this rule is reliable in most cases.
We’ve added two other pairs to our testing sequence based on feedback we’ve received from our community. They are the:
BTC/USD (Bitcoin/US Dollar)
XAU/USD (Gold/US Dollar)
Timeframes and Results
In our initial test, we’ll run the DiNapoli Stochastic Indicator on the EUR/USD, the BTC/USD and XAU/USD using the default settings across the daily and 4-hour timeframes on the MT4 strategy tester. We use the fast method of testing the indicator to get a general idea; however, you may also run the tick-by-tick data set for a more precise result (which takes considerably more time).
As No Nonsense Traders – and therefore Swing Traders, we will not examine shorter time frames in these studies. We will also run an additional test, using different values for the settings, to analyze which one may work better and examine the following results:
Total trades
Win/Loss ratio
ROI (return on investment)
There are other metrics included in the strategy tester report, which can be compared, but these three metrics provide the necessary gauge to make quick decisions as to the usefulness of a particular indicator and its settings.
Next, for comparison, we’ll explore the following;
Daily – 1 year
4-hour – 3 months
The reason exceptionally long (or short) testing periods are not included is due to changing market conditions, which might return irrelevant information. A balance of statistically significant data is necessary for accurate results.
And the Outcome…
Below are the spreadsheets listing the results from our tests.
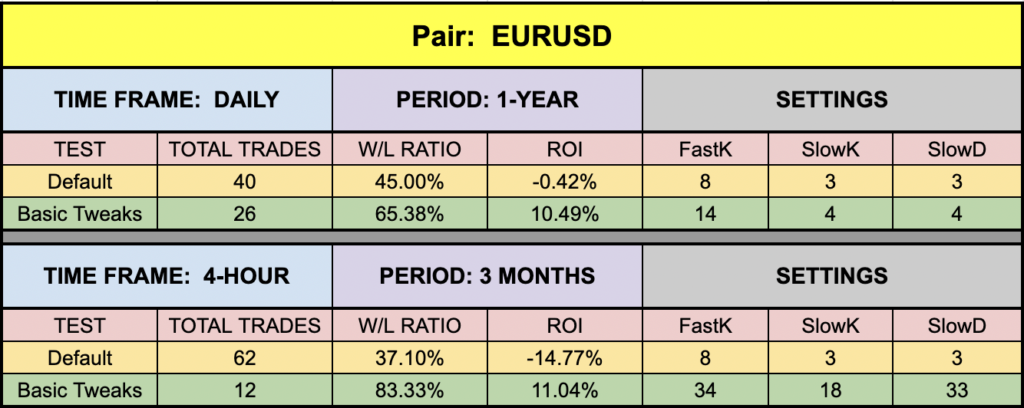
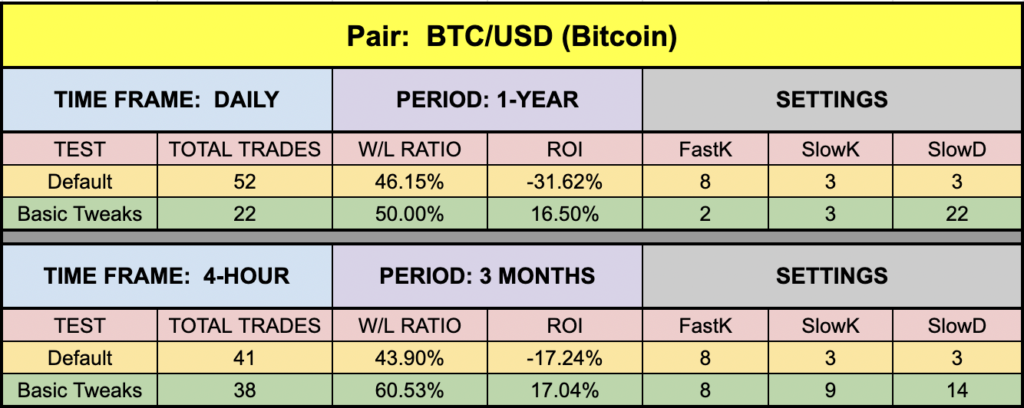

The green highlighted rows represent “basic tweaks” on the settings which returned better results. Are these the best? Not necessarily. Given that variables including testing date range and broker data are different from person to person, you may find better settings.
Trust in Yourself
Remember, the overall NNFX philosophy of taking profit, risk, and drawdown is that YOU are creating a system which YOU will be trading. Don’t let anybody else take that away from you. Part of the learning process is digging in and doing the work yourself. To learn more about these topics, check out the Advanced Course!
That beings said, the results we post in these blogs should never be considered specific trading advice.
***Note: Remember, never use just this one indicator as your decision of whether to open or close a trade. It should be part of a system.
Money Management
If you are curious as to what money management is used on our tests; we have a certain way of determining wins and losses, which can be found in the Advanced Course. Our goal here is to determine how well the indicator reacts to price with respect to producing a long or short signal. Your system, with its risk profile, will dictate individual returns.
Resources
As we did with past indicator studies, we’ve made the DiNapoli Stochastic indicator available for download on our site from the indicator library. We will keep adding better indicators with each study for your use, at no charge. When you’re ready to get it, click HERE.
More to Come
There’s a lot more to come. We are excited to provide more trading tips in the near future. Sign up on our contacts page or subscribe to our YouTube channel. Receive early notifications as we continue to publish helpful, relevant, and informative Forex related material to support your quest to become a better trader.
And, now you are aware of another indicator that many traders don’t know or use.
Our only goal is to make you a better trader.
BTW – Any information communicated by Stonehill Forex Limited is solely for educational purposes. The information contained within the courses and on the website neither constitutes investment advice nor a general recommendation on investments. It is not intended to be and should not be interpreted as investment advice or a general recommendation on investment. Any person who places trades, orders or makes other types of trades and investments etc. is responsible for their own investment decisions and does so at their own risk. It is recommended that any person taking investment decisions consults with an independent financial advisor. Stonehill Forex Limited training courses and blogs are for educational purposes only, not a financial advisory service, and does not give financial advice or make general recommendations on investment.