
Welcome to the next Stonehill Forex Indicator Study. This research represents an investigative look into how and why some indicators work and some don’t work as well.
Increased Efficiency
We introduce indicators not included with the MT4 platform to find more efficient indicators which may yield superior results than many of those found as part of the “boxed set” on the trading platform.
Our Next Indicator Choice is…
Larry Williams Proxy Index (LWPI), sometimes just called one the Larry Williams Indicators is our next confirmation indicator choice. This indicator is a slight departure from the usual indicators we have featured. First and foremost, Larry Williams has been revered as one of the founding father’s of modern trading, his career spanning over 40 years. He has published multiple books on trading, and his material featured in various trading magazine.
Days of Yore
This particular indicator began its life as a tool associated with the Commitment of Traders (COT) in 1924 which, when boiled down to its essence, is the attempt to decode where traders were positioned in a particular market through speculative approximation.
The Guy Put in a Full Day’s Work
Our hero took those concepts and created a more modern approach to the COT by creating a series of indicators called the “Larry Williams Indicators”; some of which are the;
~ Williams COT – net positions
~ Williams COT Large Speculator Index
~ Williams WILLCO
~ Williams Insider Accumulation, and so on.
Many articles have been written about the man, his indicators and his trading systems. He has also published a few books as well. If you’re interested in investigating him further, click HERE.
Class is in Session
Let’s drill down to the LWPI. The original concept was specifically based on Trader (or Market) Sentiment and predicting market reversals. If you’re not sure what that means, we’ve included a link HERE to help you. Mr. Williams discusses and develops the concept of the Proxy Index in his 2005 book, “Trade Stocks and Commodities with the Insiders: Secrets of the COT Report”.
What, Me Worry?
Since we as NNFX traders don’t subscribe to the notion of sentiment, picking tops & bottoms, and reversals due to its inability to provide reliable actionable signals (remember – we’re not wizards and witches), we found that this indicator can actually help identify a trend which has been established. This is the lens we’ll be looking through.
Let’s go to the White Board
Before we get into the indicator itself, let’s look at the math for a moment to see how all that magnificent history came together, so we as retail trend traders might profit from it. The calculations used to compute the indicator line are relatively simple:
MovingAvg(Open-Close, bars used in average)/MovingAvg(Range, bars used in average)*50+50
Original Gangster
What’s interesting is that the original COT was based on much longer time horizons, annually, in fact, and primarily in commodities and then monthly beginning in 1962. He looked at other markets on a much shorter time frame, specifically creating the Proxy Index as a banded oscillator on the 1M (1-minute) and plotted it against a 200 period moving average to make his trading decisions. So, as you may have noticed, he transitioned the COT from a fundamental style of trading to one of a technical nature. That’s the stuff we like.
Confirmation Indicator
Oh, and by the way…recall that a “confirmation indicator” falls into the category of indicators that serve as an initial checkpoint after the baseline indicator provides you with a foundational signal. You’ll also notice that the LWPI, is a “below chart” indicator, which helps keep your price chart free of those bothersome distractions. These concepts are explained in great detail in the Stonehill Forex Advanced Course HERE.
Advantages
* A single line crossing signal
* Easy to identify – just remember it’s opposite!
Simple, Yet Profound
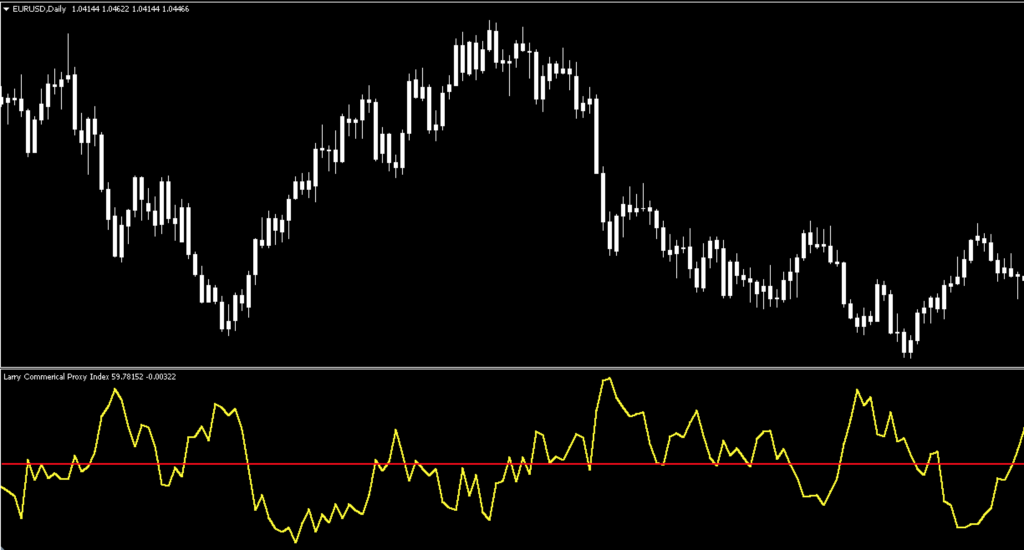
Below is a screenshot of what the indicator looks like on the daily time frame. Note that we’ve changed the color of the candles to white to remove any emotional bias and that only the indicator is prominent. The default view of the indicator is pretty clear, so all we did was thicken up the signal line. Thanks, coders!
How We Use It
Unlike Mr. Williams, we have simplified the signals because of our strictly technical approach to trading decisions. As previously mentioned, he used it as a banded oscillator, meaning that decisions were assessed when the oscillating line crossed over a low and high level, indicating the mass psychology of market sentiment. Since we use it as a single line, or zero-cross style of indicator, that’s what our approach will consist of.
But, it’s Upside Down and “50”!
You’re not seeing things. First, we use “50” as our cross-over signal line because the range spans between 25 and 75 (generally speaking). It changes over time, so it may need to be adjusted accordingly; i.e., if the upper range is 70 and the lower range is 20, set your mid-line to 45.
Second, when a long signal is given the indicator crosses BELOW the signal line and conversely, ABOVE when a possible short signal is on the horizon.
Chop Suey
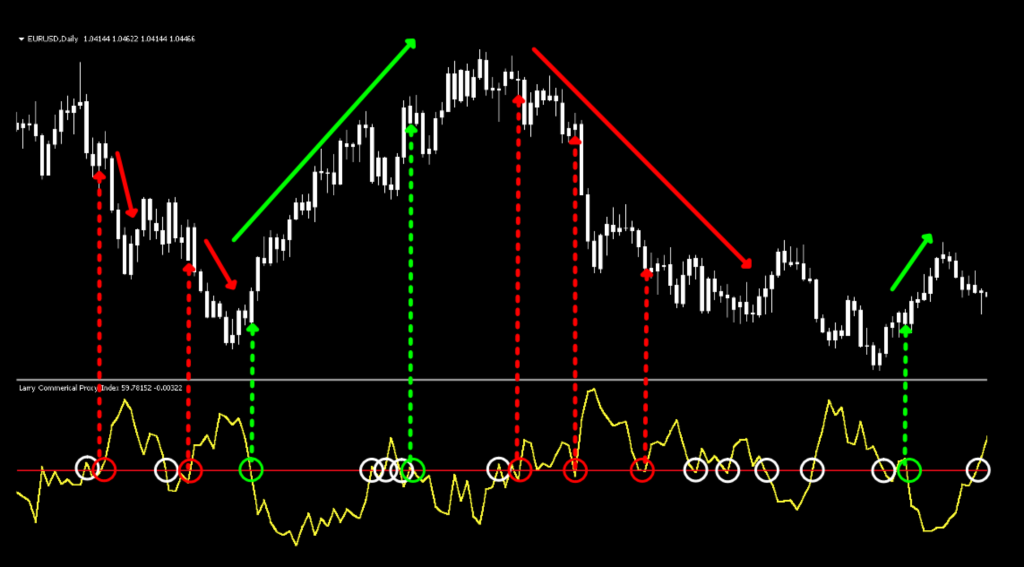
Our initial view of the chart displays the indicator on its default settings. It looks somewhat erratic and choppy, so remember the battle cry; “BE RELENTLESS!”…we say it for a reason. Besides, we never take a trade just on one or two indicators. Now, let’s take a look at the chart with the signals marked up. Your algo should keep you out of the chop, as noted by the white circles.
Signals
Long = Signal line (yellow) crosses below red line. Enter on the opening of the next period immediately following the close of the signal.
Short = Signal line (yellow) crosses above red line. Enter on the opening of the next period immediately following the close of the signal.
The green (long) and red (short) circles represent better entries and signify that a trend has been established for consideration.
Setting
There is only one setting for the LWPI; the Length. The default setting is 8 periods.
Length: The Length is similar to the “period” of a moving average. This setting determines the number of periods used for data collection.
Testing…Testing…Testing
Remember, comprehensive analysis is strongly suggested, and we advocate backwards and forward testing indicators or systems prior to trading actual funds. We propose conducting your tests on the following five pairs.
EUR/USD
AUD/NZD
EUR/GBP
AUD/CAD
CHF/JPY
If it doesn’t work on these five pairs, chances are it won’t work on other pairs. This is not an absolute, but we’ve found this rule is reliable in most cases.
We’ve added two other pairs to our testing sequence based on feedback we’ve received from our community. They are the:
BTC/USD (Bitcoin/US Dollar)
XAU/USD (Gold/US Dollar)
Timeframes and Results
In our initial test, we’ll run the Larry Williams Proxy Index Indicator on the EUR/USD, the BTC/USD and XAU/USD using the default settings across the daily and 4-hour timeframes on the MT4 strategy tester. We use the fast method of testing the indicator to get a general idea; however, you may also run the tick-by-tick data set for a more precise result (which takes considerably more time).
As No Nonsense Traders – and therefore Swing Traders, we will not examine shorter time frames in these studies. We will also run an additional test, using different values for the settings, to analyze which one may work better and examine the following results:
Total trades
Win/Loss ratio
ROI (return on investment)
There are other metrics included in the strategy tester report, which can be compared, but these three metrics provide the necessary gauge to make quick decisions as to the usefulness of a particular indicator and its settings.
Next, for comparison, we’ll explore the following;
Daily – 1 year
4-hour – 3 months
The reason exceptionally long (or short) testing periods are not included is due to changing market conditions, which might return irrelevant information. A balance of statistically significant data is necessary for accurate results.
And the Outcome…
Below are the spreadsheets listing the results from our tests.
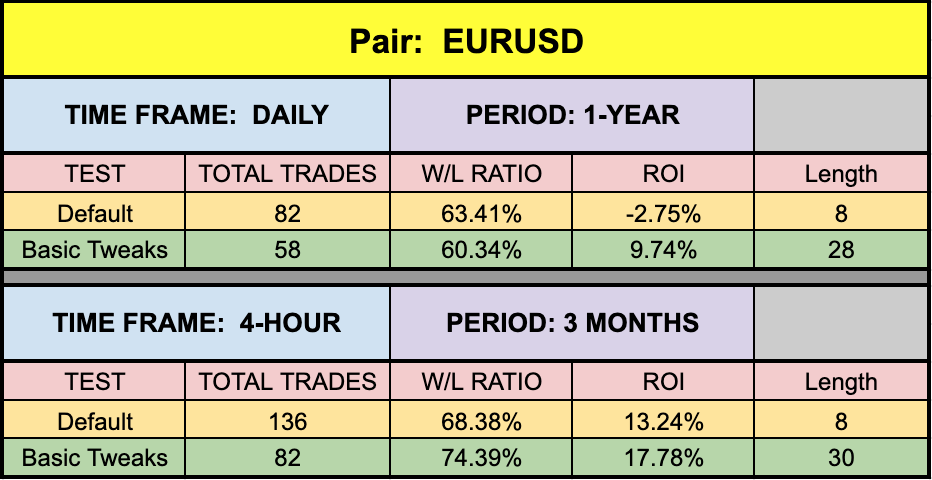
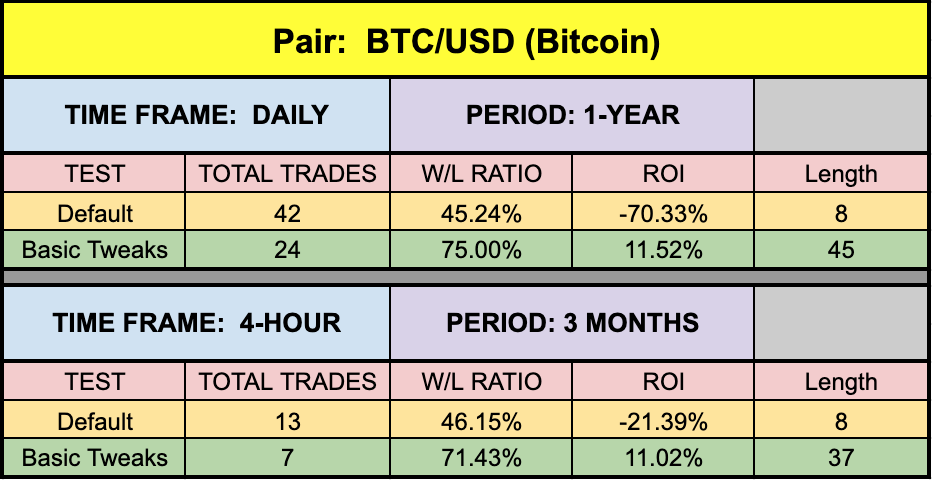
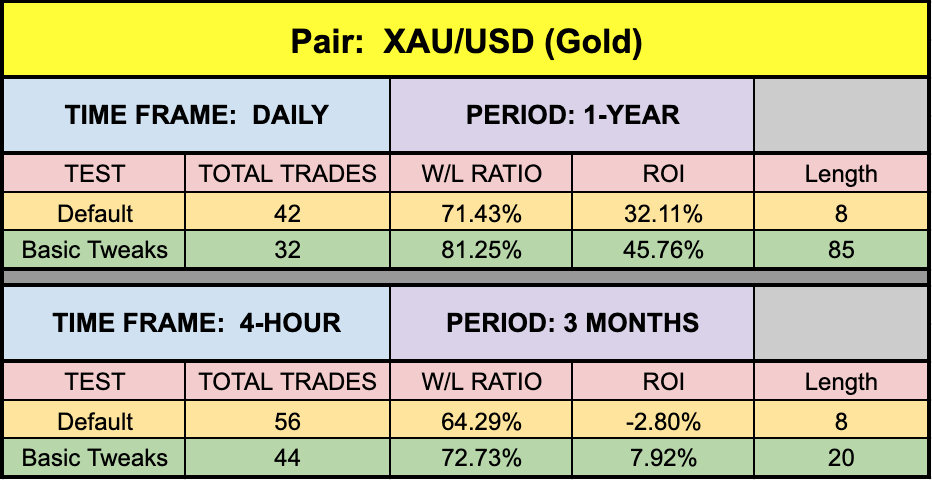
The green highlighted rows represent “basic tweaks” on the settings which returned better results. Are these the best? Not necessarily. Given that variables including testing date range and broker data are different from person to person, you may find better settings.
Stop the Chop
*NOTE: During our testing, we noticed that in every occurrence, increasing the length returned better results. This phenomenon can be clearly attributed to less “chop” of the indicator when price is ranging, or lacking any discernible trend.
Trust in Yourself
Remember, the overall NNFX philosophy of taking profit, risk, and drawdown is that YOU are creating a system which YOU will be trading. Don’t let anybody else take that away from you. Part of the learning process is digging in and doing the work yourself. To learn more about these topics, check out the Advanced Course!
That beings said, the results we post in these blogs should never be considered specific trading advice.
***Note: Remember, never use just this one indicator as your decision of whether to open or close a trade. It should be part of a system.
Money Management
If you are curious as to what money management is used on our tests; we have a certain way of determining wins and losses, which can be found in the Advanced Course. Our goal here is to determine how well the indicator reacts to price with respect to producing a long or short signal. Your system, with its risk profile, will dictate individual returns.
Resources
As we did with past indicator studies, we’ve made the Larry Williams Proxy Index available for download on our site from the indicator library. We will keep adding better indicators with each study for your use, at no charge. When you’re ready to get it, click HERE.
More to Come
There’s a lot more to come. We are excited to provide more trading tips in the near future. Sign up on our contacts page or subscribe to our YouTube channel. Receive early notifications as we continue to publish helpful, relevant, and informative Forex related material to support your quest to become a better trader.
And, now you are aware of another indicator that many traders don’t know or use.
Our only goal is to make you a better trader.
BTW – Any information communicated by Stonehill Forex Limited is solely for educational purposes. The information contained within the courses and on the website neither constitutes investment advice nor a general recommendation on investments. It is not intended to be and should not be interpreted as investment advice or a general recommendation on investment. Any person who places trades, orders or makes other types of trades and investments etc. is responsible for their own investment decisions and does so at their own risk. It is recommended that any person taking investment decisions consults with an independent financial advisor. Stonehill Forex Limited training courses and blogs are for educational purposes only, not a financial advisory service, and does not give financial advice or make general recommendations on investment.