Turn To
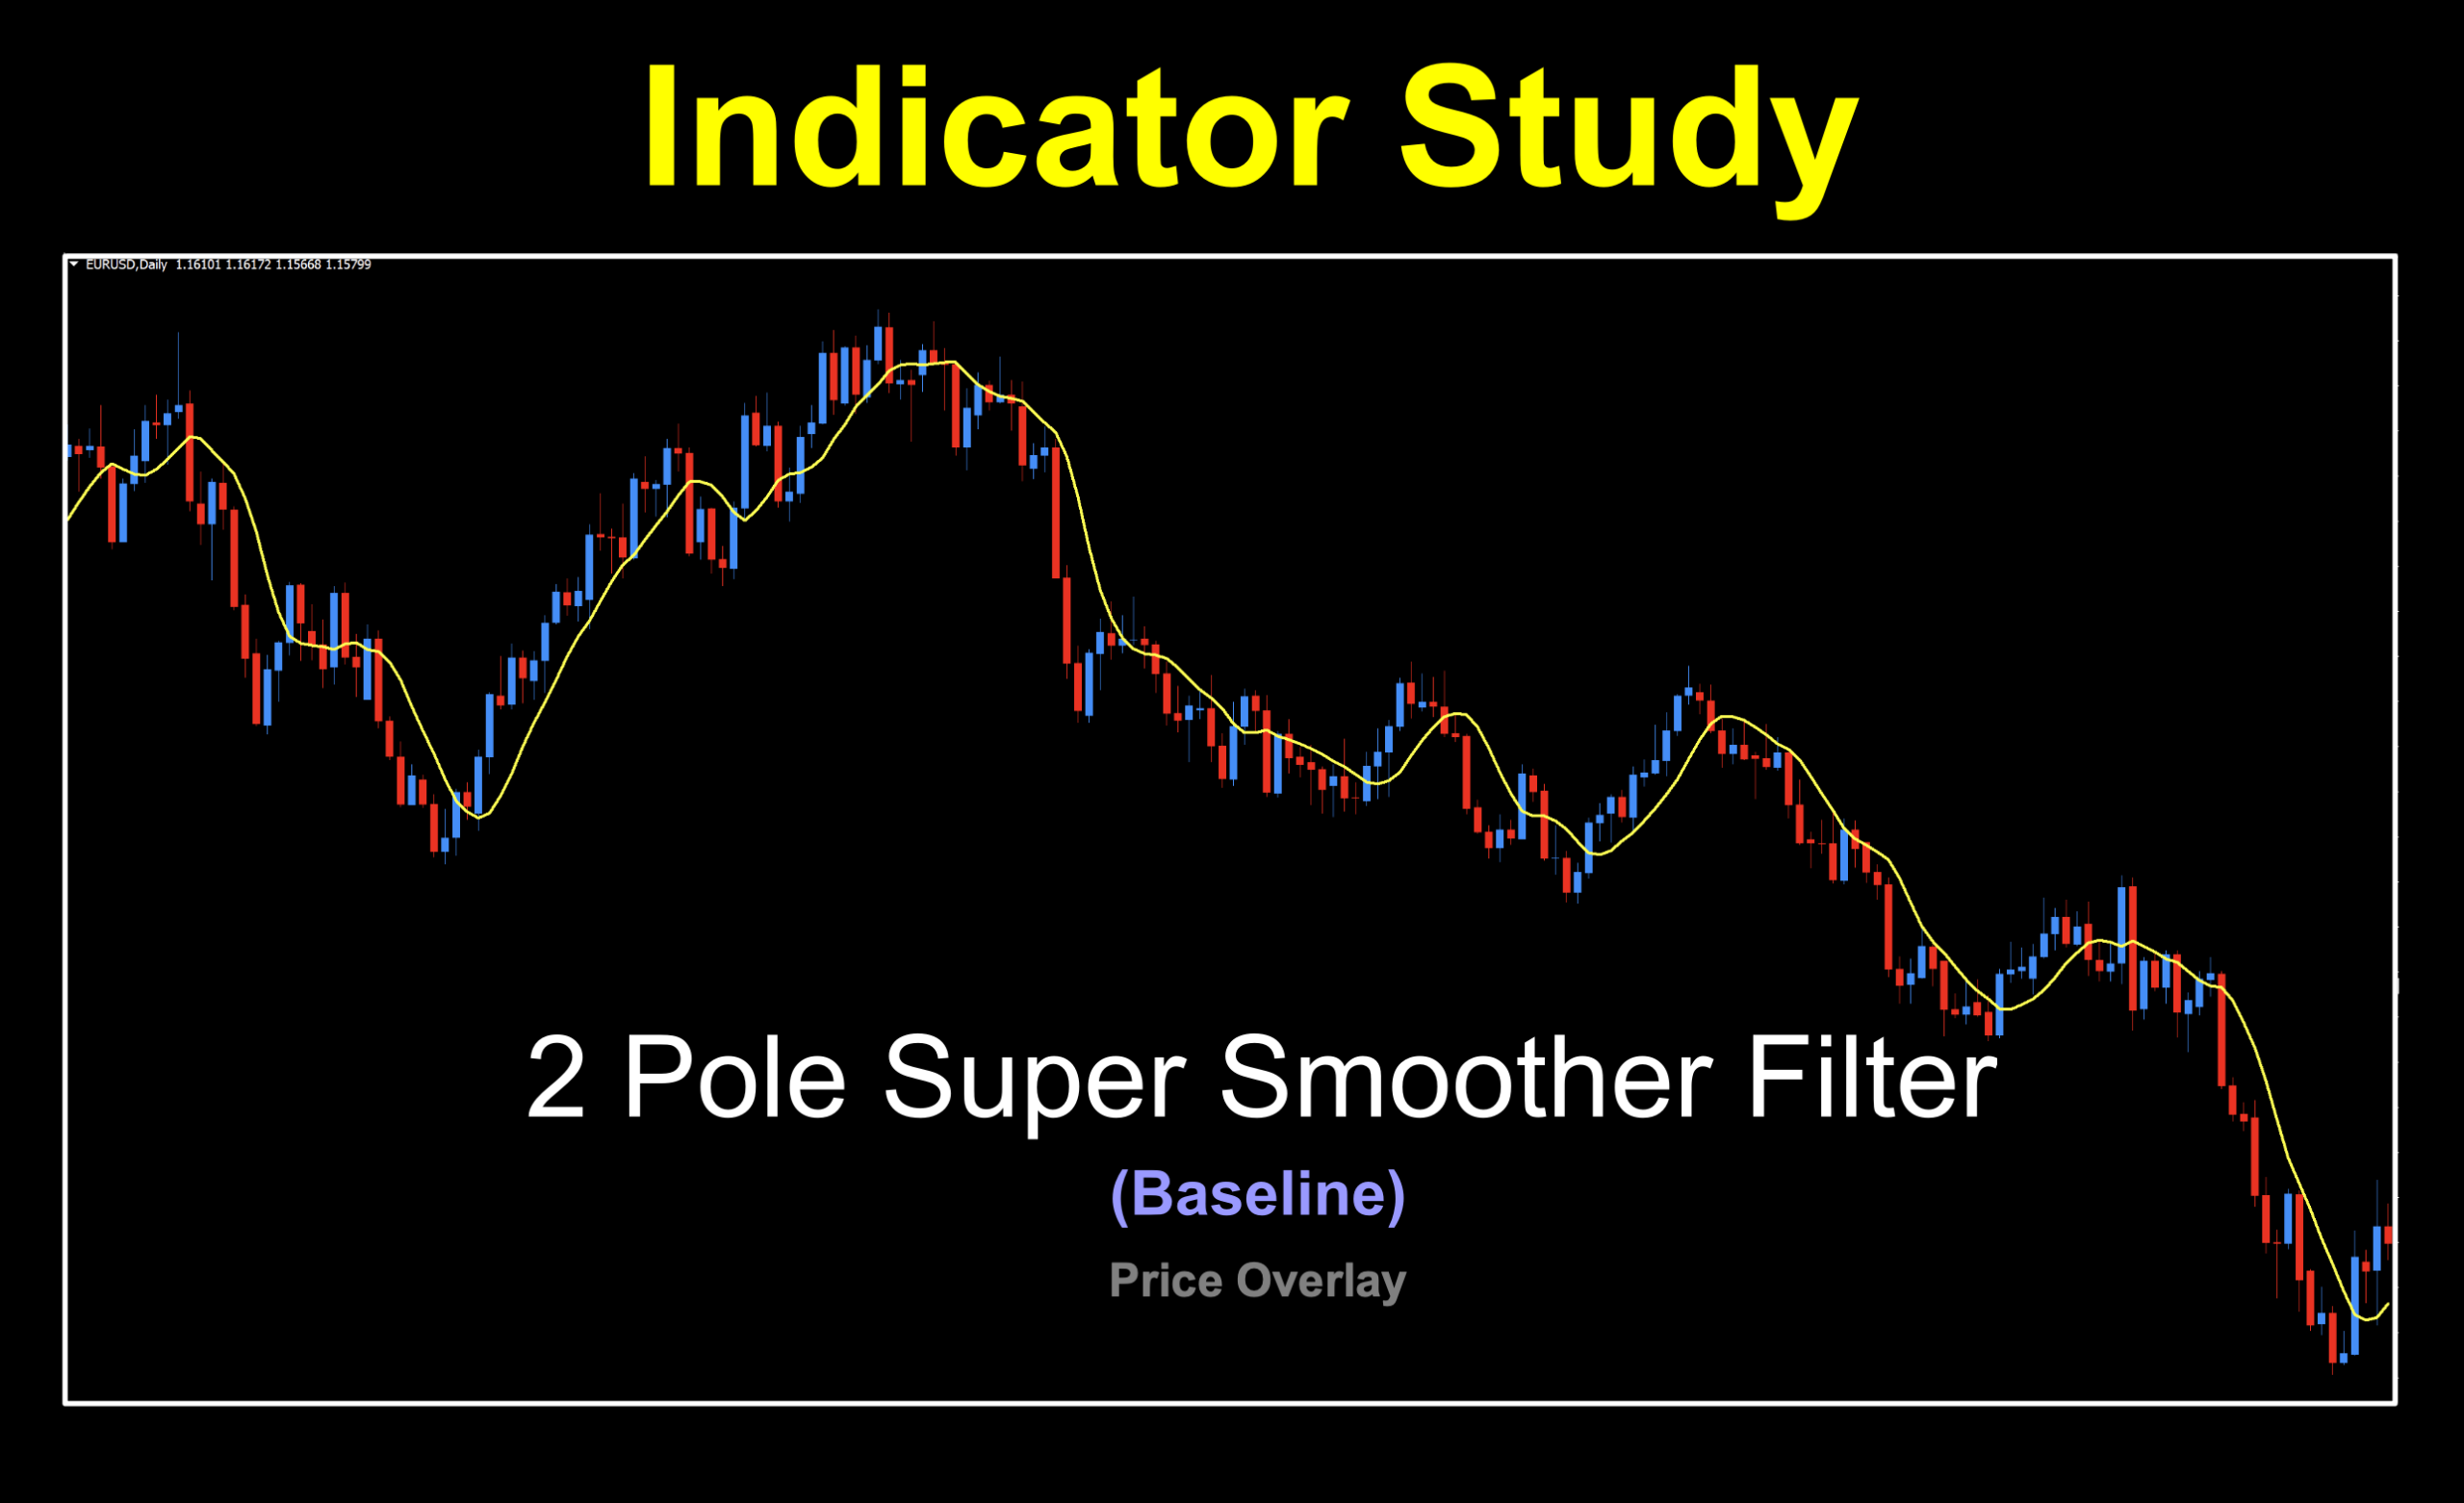
The 2 Pole Super Smoother Filter is our next baseline indicator choice. This indicator was developed by John Ehlers and was discussed at length in his book “Cybernetic Analysis For Stocks And Futures”, published in 2004. His “Smoother” indicators (there are a few) are based on a concept called Butterworth Filters, which is a type of signal processing filter designed to have as flat frequency response as possible and are one of the most commonly used digital filters in motion analysis and in audio circuits.
Filtering Out Noise
For the trading world, Mr. Ehlers has been able to use the mathematical concepts of the Butterworth Filter as an alternative to the EMA (Exponential Moving Average) and SMA (Simple Moving Average) to detect trends. The indicator’s objective is to produce a smoother average with a minimum of lag by filtering out excessive market noise, and providing an indication of market direction.
Heavy Duty Math
The math behind Super Smoother filter indicators is predicated on Butterworth Filters, which served as a basis for his conversion to Multipole Smoothing Filters. The actual computations are quite complex, and a casual look at the actual source coding for the indicator makes us very appreciative that we don’t have to manually plot this on a chart! If you are interested in some of his work, here is the link to purchase the his book. Check out page 202 for the background science behind the indicator.
Simple is the Name of the Game
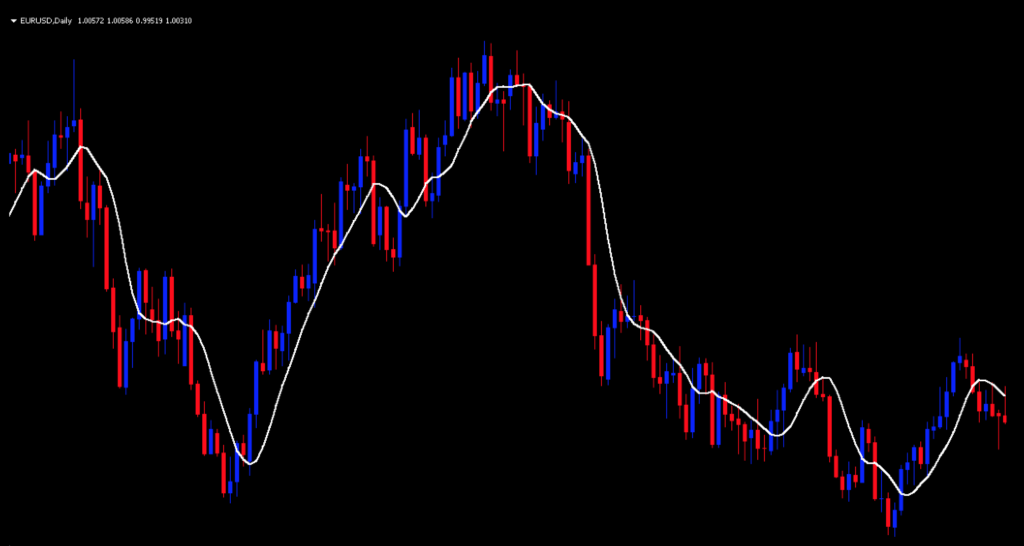
Below is a screenshot of what the indicator looks like on the daily time frame. Note that we’ve changed the candles to “red” (price closed lower) and “blue” (price closed higher) in order to demonstrate the relationship between price and the indicator. We’ve also thickened the indicator line and changed it from red to white to make it more visible.
How We Use It
The signal occurs on the opening of the period following the close of the candle below (long) or above (short) the indicator line, when you see the color change.
Choppy Waters
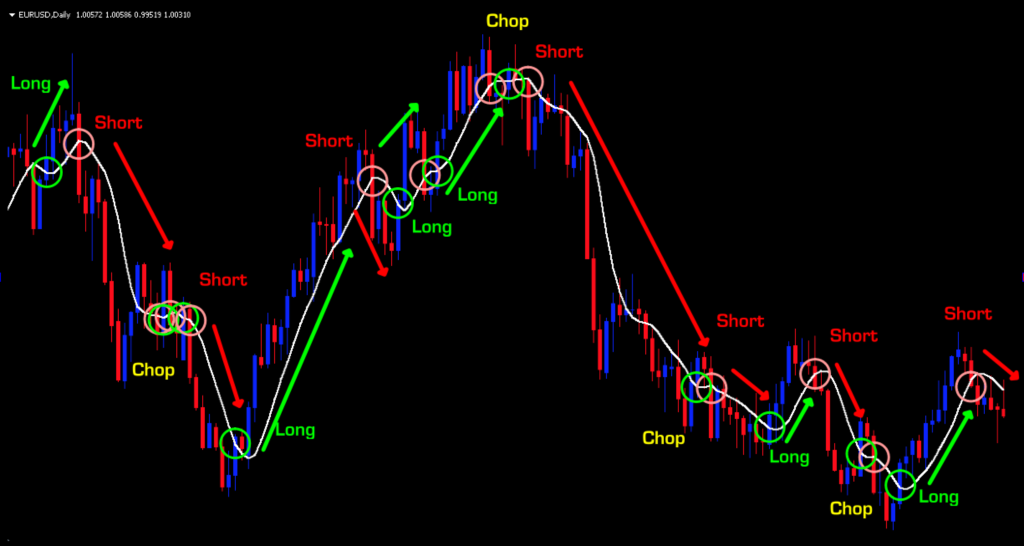
Note that on the default setting, there is “chop” as noted in yellow in the screenshot below. An effective algorithm would have kept you out of those sideways or less volatile markets; however, when a legitimate trend is in place, this indicator has the ability to signal you quite early.
Walk the Line
The irony of this indicator is that so much is going on in the background and yet, the only thing you need to concern yourself is whether price closed above or below the indicator line. How wonderfully simple is that? If you noticed, this indicator appears to “hug” price and react much quicker than other indicators based strictly on moving averages.
Looky Looky
Below is a screenshot of the 2 Pole Super Smoother plotted with SMA and EMA lines to demonstrate Mr. Ehler’s objective.
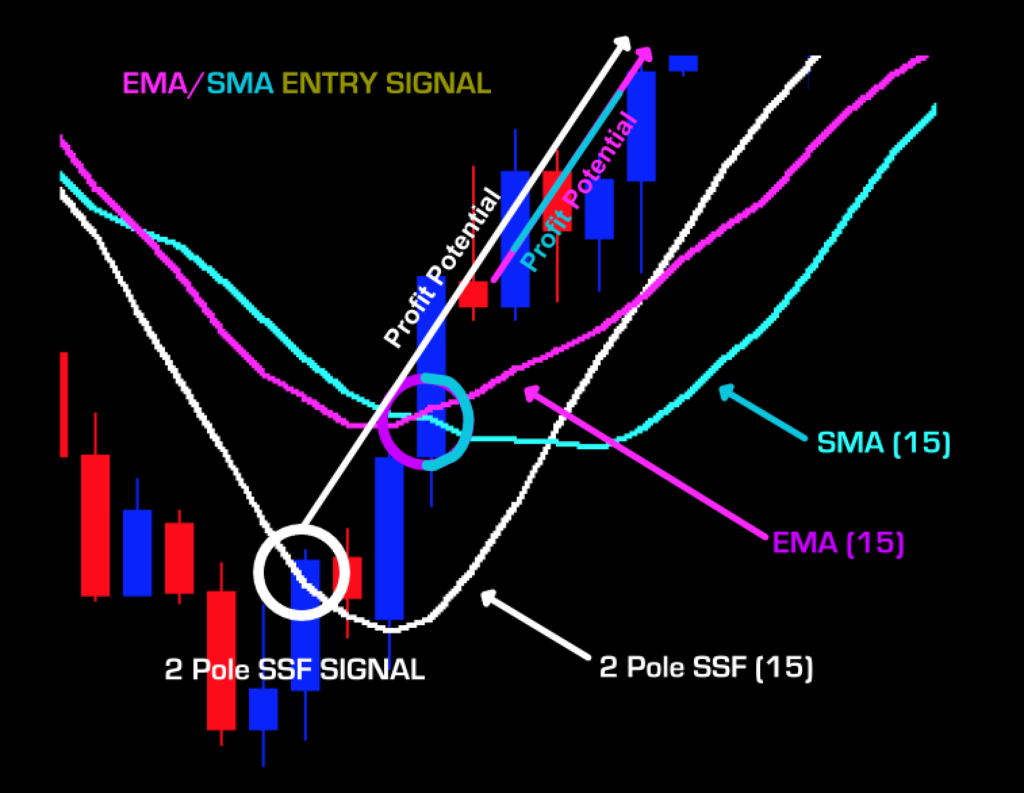
An earlier entry is clearly defined in this example and demonstrates why we continue to find newer and more accurate indicators than those which were created prior to the introduction of spot Forex market in 1996.
Signals
Long: Price closes above the indicator. Entry on next open period.
Short: Price closes below the indicator. Entry on next open period.
Settings
There is only one setting for this indicator which makes it easy for testing.
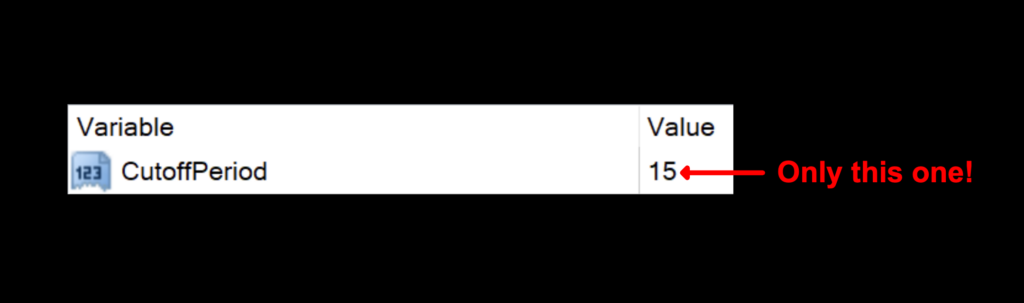
CutoffPeriod: Represents the maximum period for a wave cycle to be considered noise – something which this indicator aims to “filter” out. The default setting is 15.
Once you’re ready to perform daily maintenance on your trades during the last 20–30 minutes of the trading day (1700 New York time), you’ll be presented with one of four options.
- Opening a trade.
- Closing a trade
- Maintaining a trade; i.e.
- Moving a stop loss level.
- Exiting a trade.
- Taking a pass (nothing to do).
And the Outcome…
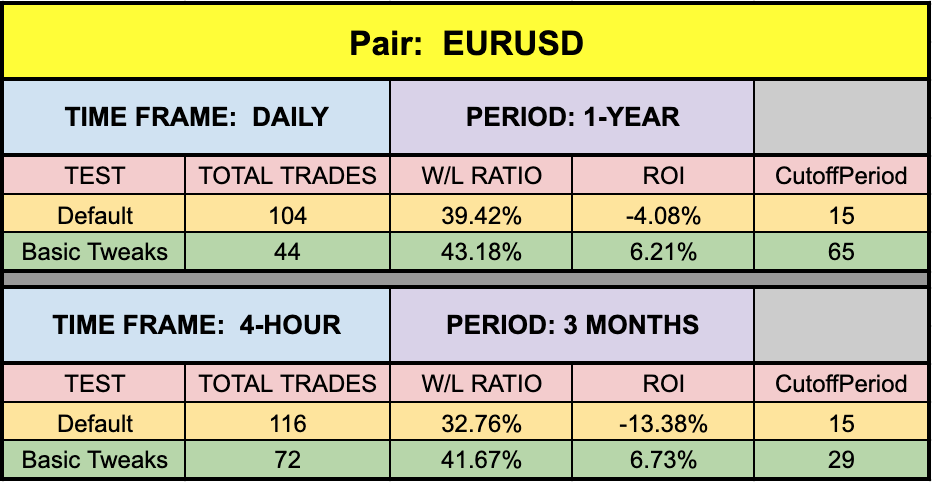
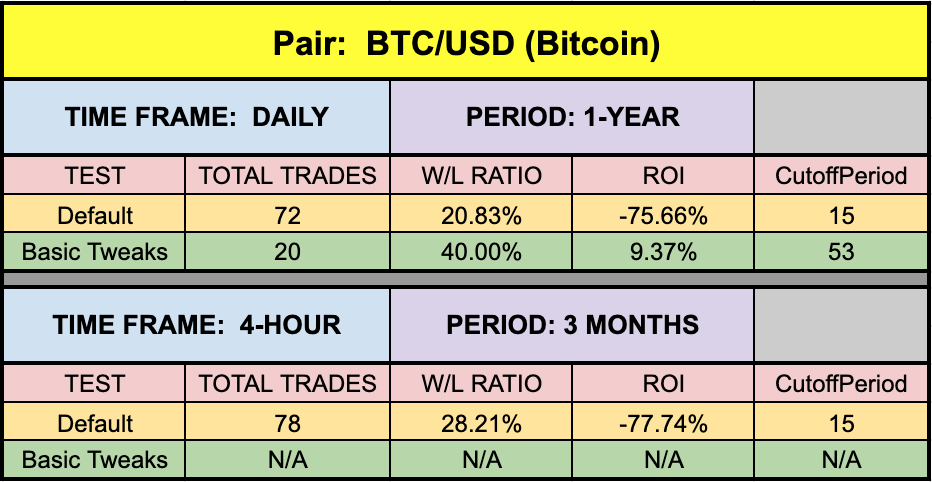
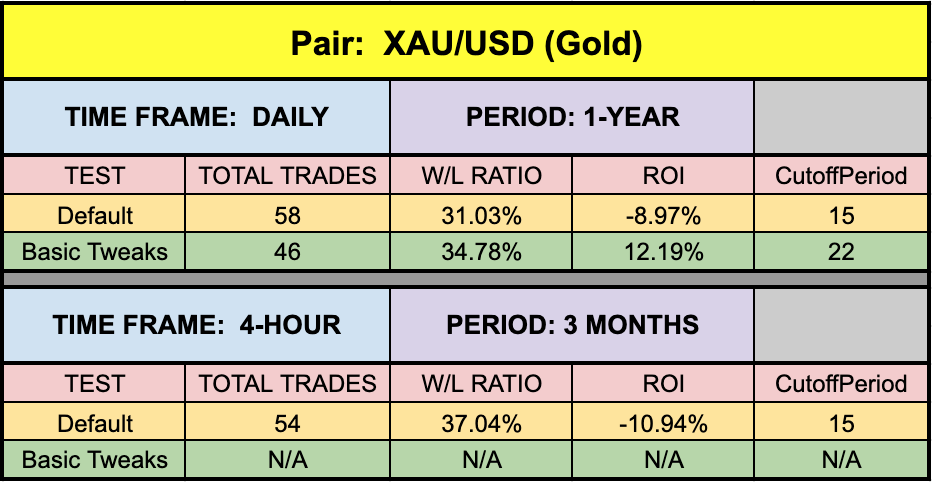
The green highlighted rows represent “basic tweaks” on the settings which returned better results. Are these the best? Not necessarily. Given that variables including testing date range and broker data are different from person to person, you may find better settings.
*NOTE: During the three-month period where we tested the both BTC/USD (Bitcoin) and XAU/USD (Gold) on the 4-hour time frame, there were no possible combination of settings that returned a positive ROI. This was first discussed in the Fisher No-Repaint blog and again in VP’s corresponding indicator profile YouTube Video.
C’est La Vie
It happens. It’s okay. Some pairs move differently and indicators react differently to price over time. That’s the beauty of the Forex market. Trending, channeling, dead, and extreme volatility conditions exist…and flex over time; further proof that you should never become fixated on only a couple of pairs. Understanding this concept puts you head and shoulders above other “uninformed” traders.
Resources
As we did with past indicator studies, we’ve made the 2 Pole Super Smoother Filter indicator available for download on our site from the indicator library. We will keep adding better indicators with each study for your use, at no charge. When you’re ready to get it, click HERE.
Our only goal is to make you a better trader.
*Our published testing results are based on money management strategies employed by the NNFX system and depend on varying external factors, which may be different between individuals and their specific broker conditions. No guarantee, trading recommendations, or other market suggestions are implied. Your results and subsequent trading activities are solely your own responsibility.
BTW – Any information communicated by Stonehill Forex Limited is solely for educational purposes. The information contained within the courses and on the website neither constitutes investment advice nor a general recommendation on investments. It is not intended to be and should not be interpreted as investment advice or a general recommendation on investment. Any person who places trades, orders or makes other types of trades and investments etc. is responsible for their own investment decisions and does so at their own risk. It is recommended that any person taking investment decisions consults with an independent financial advisor. Stonehill Forex Limited training courses and blogs are for educational purposes only, not a financial advisory service, and does not give financial advice or make general recommendations on investment.