Welcome to the next indicator study. This research represents an investigative look into how and why some indicators work and some don’t work as well.
New Versus Old
Volume indicators can be difficult to find. Especially those which are easy to understand and actually help us traders. There are a small handful of volume indicators which come with the MT4 trading platform. They’re not great, but a good place to start. Why not try something better?
Presenting This Week’s Star
In this study, we’re going to examine the Normalized Volume Indicator. This indicator helps traders objectively assess the volume of trades over a given time horizon. It has a very simple algorithm which sums up the total volume traded over a given number of periods.
This indicator is an offshoot of a concept developed by John Forman and featured in Stocks & Commodities magazine in 2006. The original concept was titled, “Cross-Market Evaluations With Normalized Average True Range”. Upon further research, there have been multiple authors who have successfully coded variations of the idea of “normalization” and applied it to volume.
What is Normalization Anyway?
“Normalization” is the ability of an indicator to create visual signals when it rises above a specified average. Normalizing volume exhibits the total volume as a percentage above or below the time period chosen. By this method, its output number is the percentage above 100% or below 100% (i.e. a value of 110 really means the day’s volume is 10% greater than the moving average.) It sounds a little complicated, but you’ll see shortly that it’s quite easy to understand.
Mini Lessons Abound
Fair warning…This blog will be a bit longer than others due to topics we feel are worth discussing. VP may not be discussing some of these concepts in the video in the interest of time, so read on!
Volume – Large, Small, and Bingo (none)
Accurately determining Forex market volume has always been somewhat of a mystery. Volume indicators provide the information we need regarding the strength of a trend, regardless of its direction. No volume equals no fuel for extended trends, and may result in a choppy and difficult market to trade.
It’s Perfectly Fine
Considering the Forex market is wholly decentralized, volume will not enjoy the same degree of precision as a particular security traded on just one exchange or another. That’s perfectly fine. The bottom line is that data you receive from your broker is sufficient for trading purposes.
You Ugly
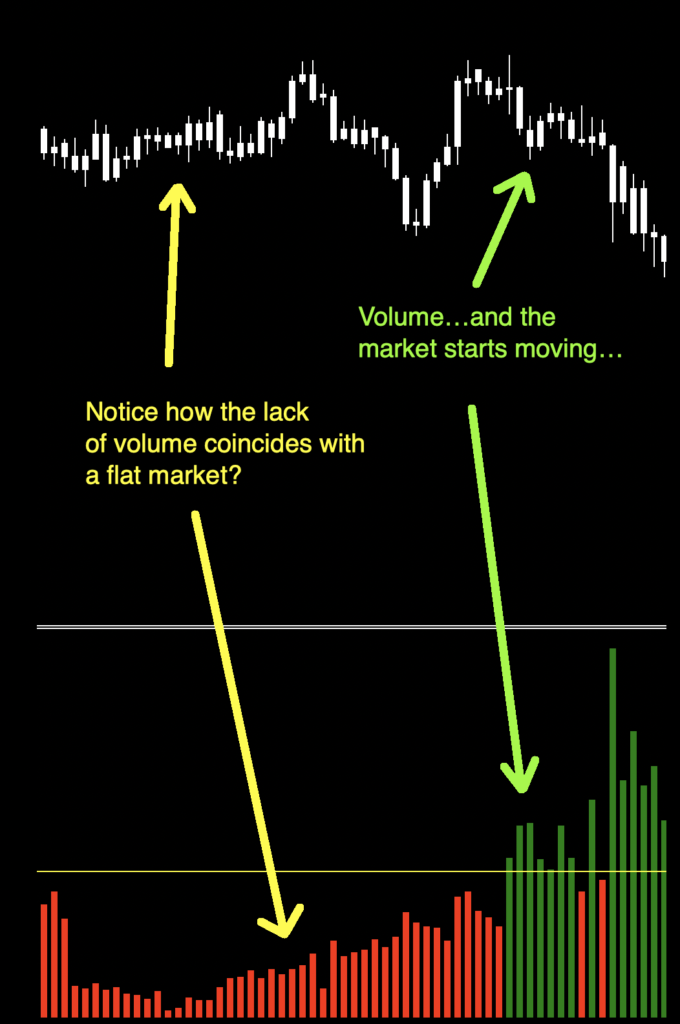
What does a market with little volume look like?
Volume Indicator
A volume indicator falls into the category of indicators that serve as a final checkpoint after the baseline and two confirmation indicator (C1 & C2) conditions have been met (see the blog on McGinley Dynamic Indicator for a baseline indicator and the Vortex Indicator blog for a confirmation indicator) when setting up your algorithm as examples.
Put it on and Take it Off
The one great thing about any volume indicator is that once it has given you the final “go ahead” signal, you can take it off your chart. You don’t need it anymore. Now your algorithm can do its thing with respect to stops/limits, and exits. Fewer things to look at, cleaner charts. That’s a good thing!
Why is Volume such a Big Deal?
Trading volume can help a trader identify momentum of a currency pair and confirm a trend. If trading volume increases, prices generally continue moving in the same direction and can provide a heads-up if volume diminishes. Once volume begins to diminish and the fuel for the trend starts to dry up, a reversal or ranging market may be on the horizon.
The advantages of this particular volume indicator include;
* Only has one setting to adjust
* Signals are easy to interpret: Go/No Go
Looking Good
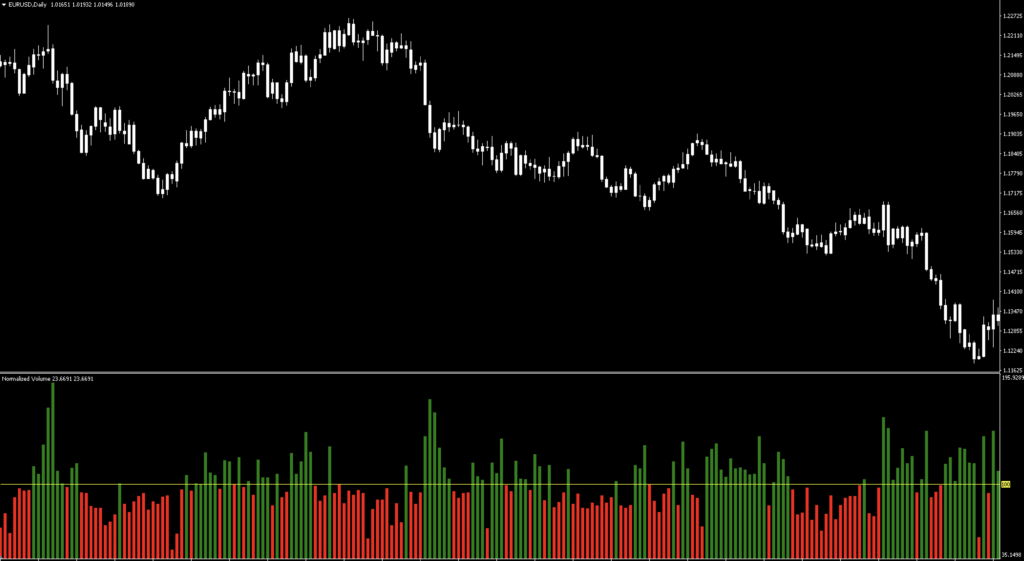
Below is a screenshot of what the indicator looks like on the daily time frame. Note that we’ve changed the color of the candles to white to remove any emotional bias so that only the indicator is prominent.
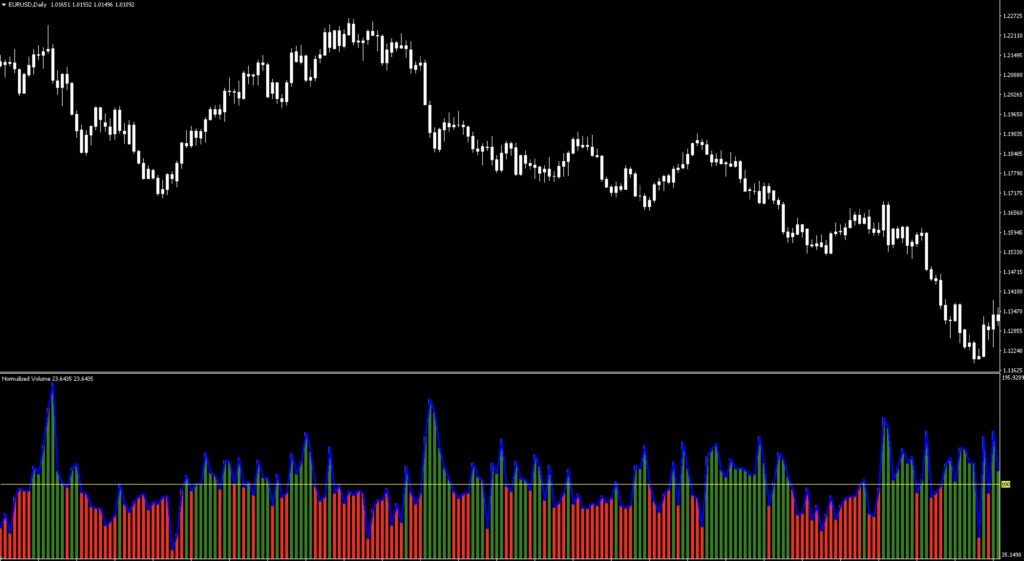
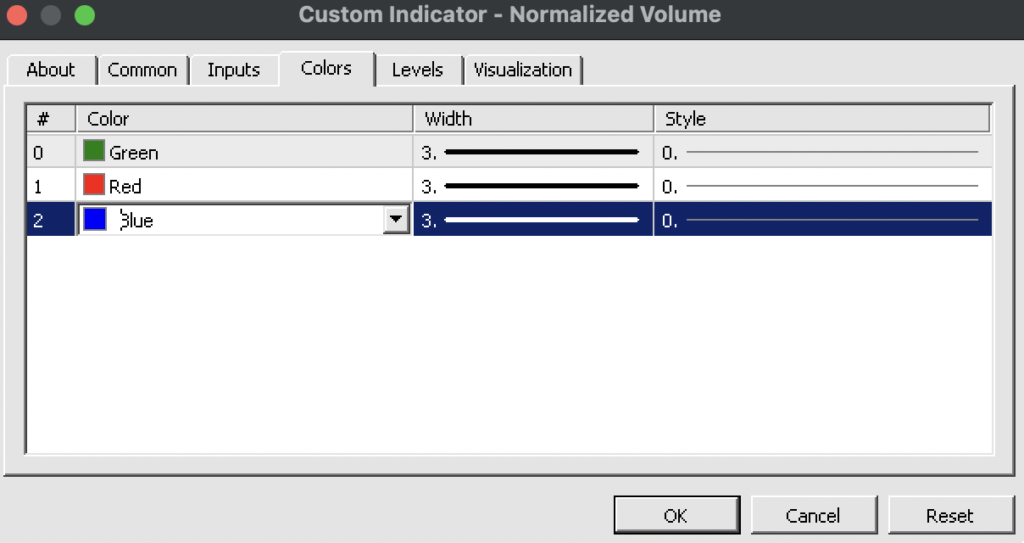
There is a blue line that appears to trace the histogram. This blue line is actually a connect-the-dot line of each data point, which aligns with each histogram line. We’ve opted to remove it for a couple of reasons. First, it’s a distraction and second, it’s not necessary. Now look at the chart below. A little clearer, right? You can remove this line in the settings under the “colors” tab by changing the blue to “none” and clicking OK.
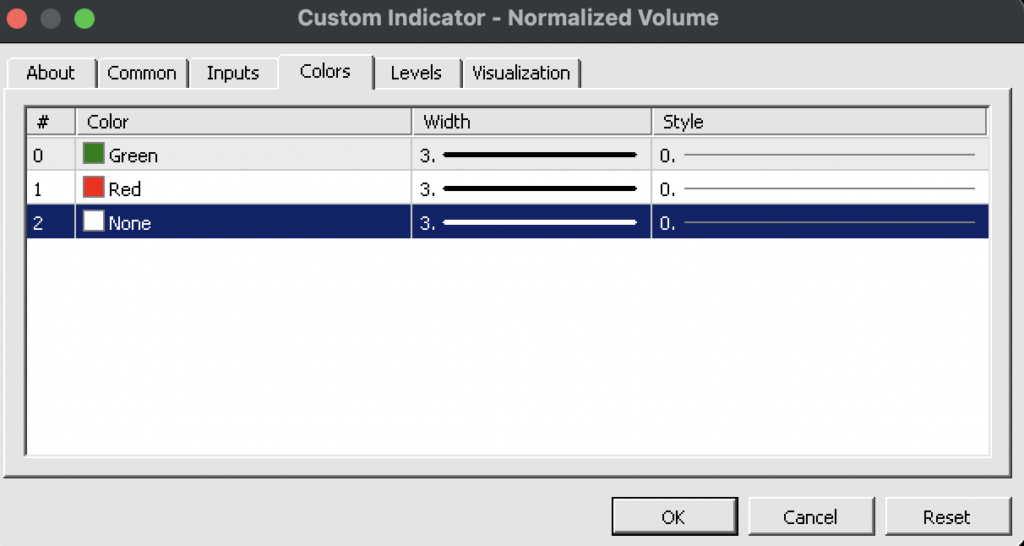
Now, it should look like this!
How it’s Used
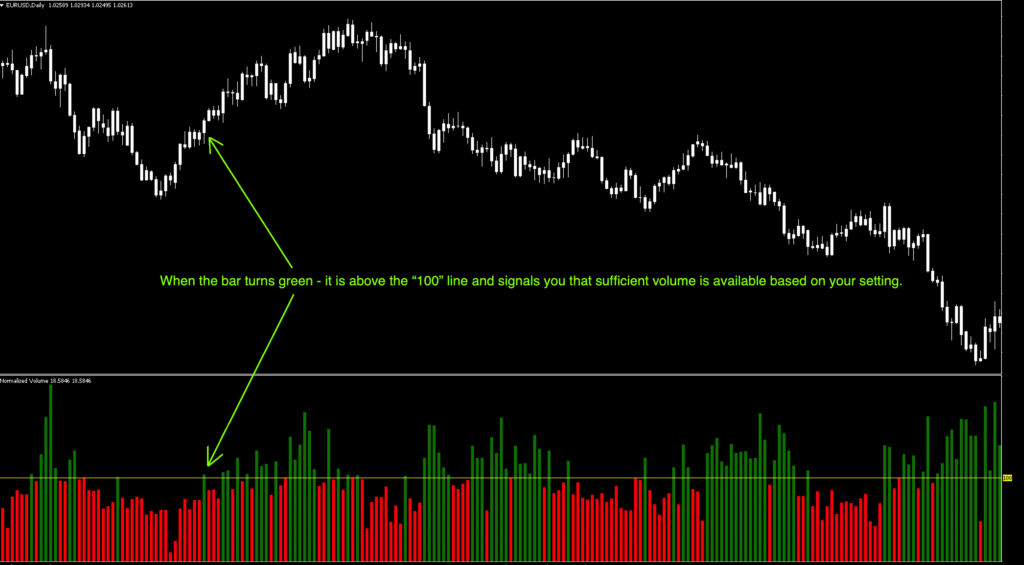
Unlike baseline and confirmation signals which determine the direction of a trade, this indicator just gives you a “green light” to go. Your baseline and confirmation indicators dictate whether you’re looking to open a long or a short trade.
Chart, Marked Up
See the marked up chart below. Where the histogram line first turned green on a closed candle on this uptrend, that would be your final signal to “pull the trigger” on the open of the next candle if your baseline and confirmation indicators are in agreement.
Where Volume Gives You Insight
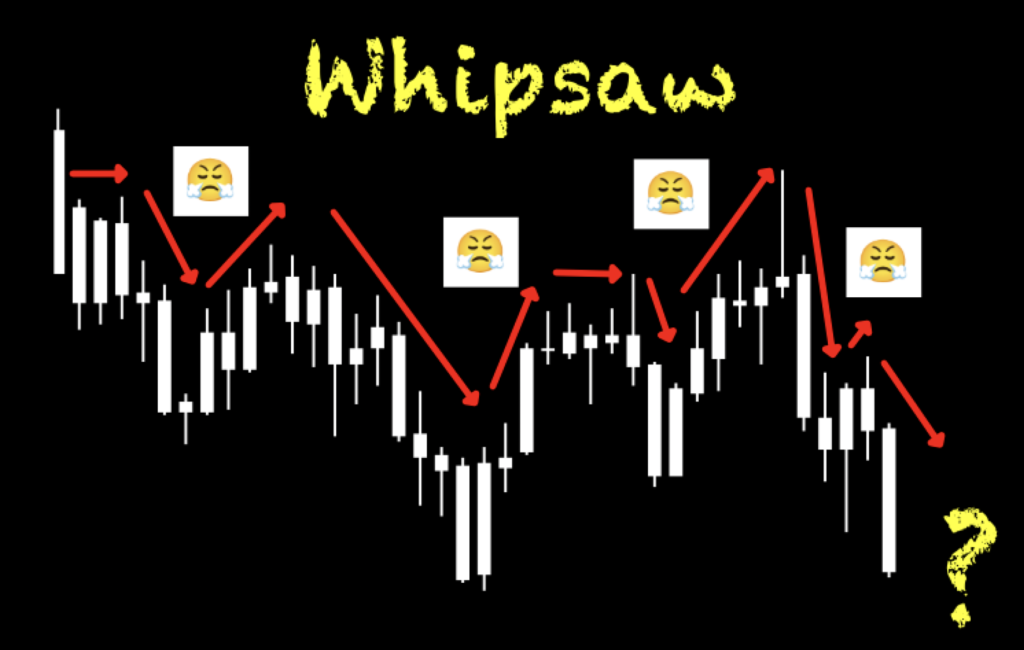
In the screenshot below, notice that the market is ranging…because there is no volume. Your baseline and confirmation indicators may be giving you a signal which could result in getting whipsawed (Remember the picture from above?), but until you get all of them in agreement, no trade.
Settings
“MA_Period” refers to the number of periods the indicator would retrieve the volume data from to calculate for its Normalized Volume. The default value is (14). What this means is that the indicator would add the total value of the past 14 periods and that value is plotted. At the close of the next period, the indicator would advance the line and drop the farthest volume value from the total normalized volume and add the current volume. This cycle repeats as the indicator plots the histogram.
Just Fooling Around
You may be asking…”Okay, cool…why change the setting?” The answer is what you want to consider “normal” volume. By increasing and decreasing the MA_Period, you change the amount of volume for consideration. Let’s compare three settings; 14, 25, and 40.
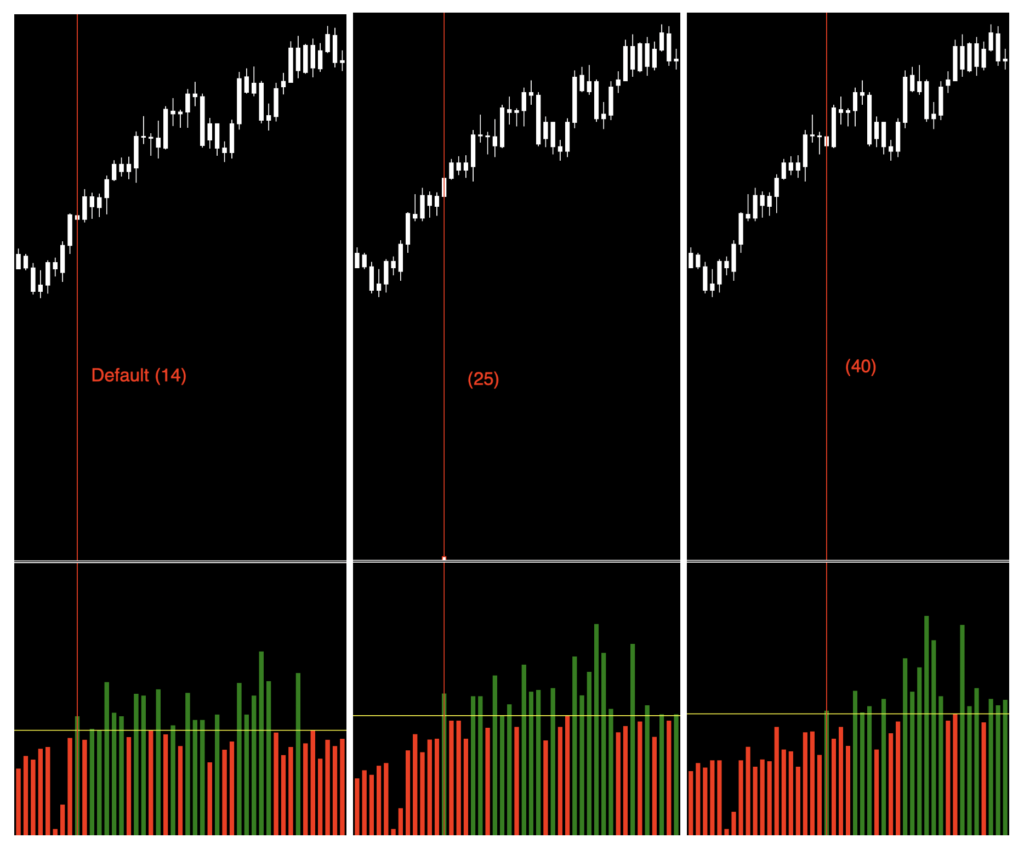
Notice that the higher the setting, the more data has to be considered before a “go” signal is printed. Too low, you may get false signals because not enough volume is considered to confirm that a trend is under way. Finding that sweet spot is your challenge.
Testing Volume?
Testing a volume indicator by itself is not something that happens organically. Remember that it is the last part of your algorithm, so in reality, testing any volume indicator needs to be part of testing all of your pieces together.
But…We’ve Got Something to Offer
In our benchmark tests, we’re going to add the SMA (Simple Moving Average 20) to give us something to compare our volume indicator to. The idea is to see how volume affects signals by combining them with other indicators.
Remember, comprehensive analysis is strongly suggested, and we advocate backwards and forward testing indicators or systems prior to trading actual funds. We propose conducting your tests on the following five pairs.
EUR/USD
AUD/NZD
EUR/GBP
AUD/CAD
CHF/JPY
If it doesn’t work on these five pairs, chances are it won’t work on other pairs. This is not an absolute, but we’ve found this rule is reliable in most cases.
We’ve added two other pairs to our testing sequence based on feedback we’ve received from our community. They are the:
BTC/USD (Bitcoin/US Dollar)
XAU/USD (Gold/US Dollar)
Timeframes and Results
In our initial test, we’ll run the Normalized Volume and SMA on the EUR/USD, the BTC/USD and XAU/USD using the default settings across the daily and 4-hour timeframes on the MT4 strategy tester. We use the fast method of testing the indicator to get a general idea; however, you may also run the tick-by-tick data set for a more precise result (which takes considerably more time).
As No Nonsense Traders – and therefore Swing Traders, we will not examine shorter time frames in these studies. We will also run an additional test, using different values for the settings, to analyze which one may work better and examine the following results:
Total trades
Win/Loss ratio
ROI (return on investment)
There are other metrics included in the strategy tester report, which can be compared, but these three metrics provide the necessary gauge to make quick decisions as to the usefulness of a particular indicator and its settings.
Next, for comparison, we’ll explore the following;
Daily – 1 year
4-hour – 3 months
The reason exceptionally long (or short) testing periods are not included is due to changing market conditions, which might return irrelevant information. A balance of statistically significant data is necessary for accurate results.
And the Outcome…
Below are the spreadsheets listing the results from our tests.
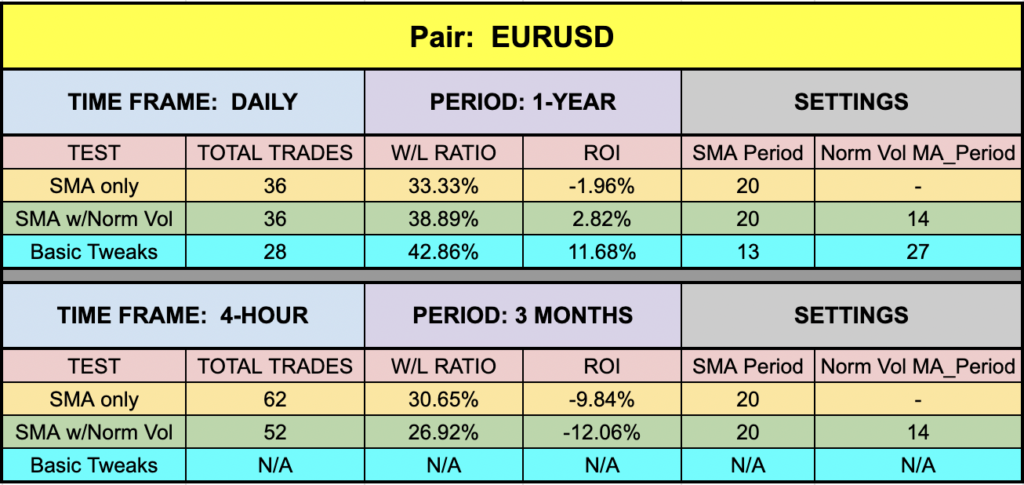
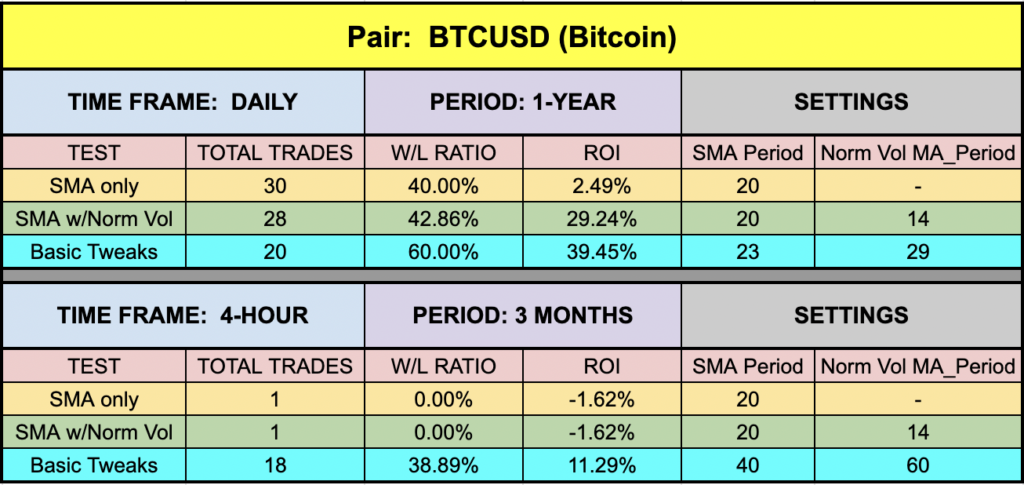
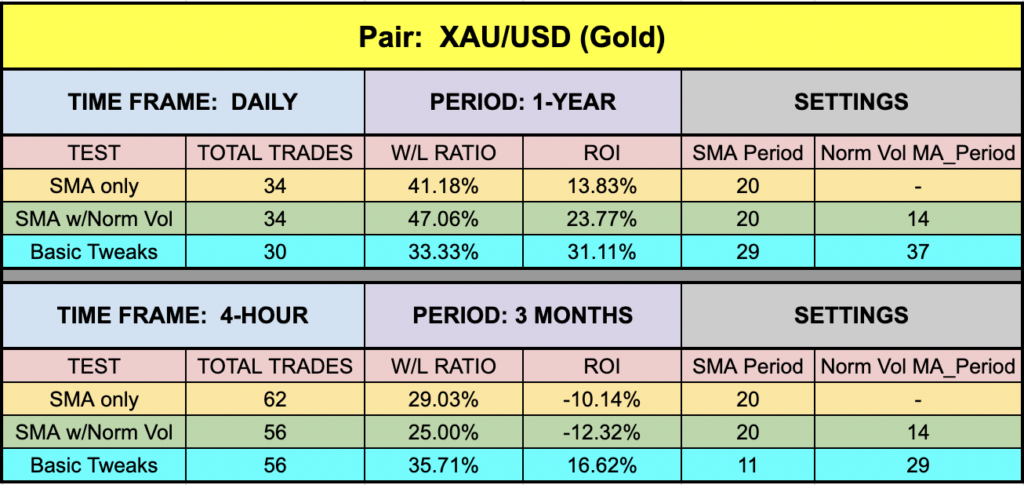
You can see that the yellow highlighted rows represent only the SMA(20). The green highlighted rows represent the SMA(20) with the default Normalized Volume(14) indicator added as a filter. The blue highlighted rows represent “basic tweaks” on both indicator settings which returned better results. Are these the best? Not necessarily. Given that variables including testing date range and broker data are different from person to person, you may find better settings.
*NOTE: During the three-month period where we tested the EUR/USD on the 4-hour time frame, there were no possible combination of settings that returned a positive ROI. This was first discussed in the Fisher No-Repaint blog and in VP’s corresponding indicator profile YouTube Video.
What the Heck?
Not every indicator or even combinations of indicators can return positive results all the time. VP put out a video awhile back about how some indicators by themselves are good, but can be even better when they’re put together, and sometimes they just don’t work, no matter what you do. Our testing results clearly illustrate what he was talking about. With literally thousands available for free, you can certainly find those gems worth spending some quality time with. Embrace the effort. You’ll thank us later.
YOU are the Master of Your Universe
Remember, the overall NNFX philosophy of taking profit, risk, and drawdown is that YOU are creating a system which YOU will be trading. Don’t let anybody else take that away from you. Part of the learning process is digging in and doing the work yourself. To learn more about these topics, check out the Advanced Course!
That beings said, the results we post in these blogs should never be considered specific trading advice, as they change over time.
***Note: Never use just this one indicator as your decision of whether to open or close a trade. It should be part of a system.
Resources
As we did with past indicator studies, we’ve made the Normalized Volume Indicator available for download on our site from the indicator library. We will keep adding better indicators with each study for your use, at no charge. When you’re ready to get it, click HERE.
More to Come
There’s a lot more to come. If you haven’t signed up on our contacts page or subscribed to the YouTube channel, please consider doing so to receive notifications as we continue to publish helpful, relevant, and informative Forex related material to support your quest to becoming a better trader.
And now, you are aware of a volume indicator that may be more efficient.
Our only goal is to make you a better trader.
BTW – Any information communicated by Stonehill Forex Limited is solely for educational purposes. The information contained within the courses and on the website neither constitutes investment advice nor a general recommendation on investments. It is not intended to be and should not be interpreted as investment advice or a general recommendation on investment. Any person who places trades, orders or makes other types of trades and investments etc. is responsible for their own investment decisions and does so at their own risk. It is recommended that any person taking investment decisions consults with an independent financial advisor. Stonehill Forex Limited training courses and blogs are for educational purposes only, not a financial advisory service, and does not give financial advice or make general recommendations on investment.