Welcome to the next indicator study. This research represents an investigative look into how and why some indicators work and some don’t work as well.
New Versus Old
We’ve posted volume blogs and their respective indicators in the resource area. A close cousin of volume indicators are VOLATILITY indicators. They can be used in place of volume indicators when you create your algorithm. We will be posting a series of volatility indicators to help balance out your search. In this study, we’re going to examine the Volatility Ratio Indicator. The indicator was published in the book “Technical Analysis” by Jack Schwager in 1995. You can read more about this remarkable trader HERE.
Let’s Get Mathy
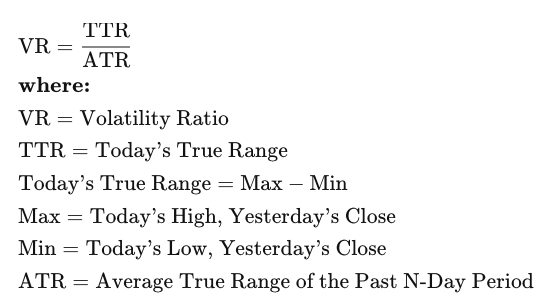
The math behind this indicator is essentially a ratio between current price movement and a defined range of past price movement.
Must I?
Without a volume or volatility indicator, determining if the market has the necessary “fuel” to power a trend is not possible. Unfortunately, many traders either refuse or neglect to trade with this necessary type of indicator because they do not understand it what it is or cannot find a suitable indicator.
Volatility Indicator
A “volatility indicator” falls into the volume category of indicators that serve as a final checkpoint after the baseline and confirmation indicator conditions have been met when setting up your algorithm.
It Has Advantages
Volume and volatility are the primary means to help a trader identify a trend. If trading volume increases, momentum of price generally continues in the same direction. Once volume begins to diminish and the fuel for the trend starts to dry up, a reversal or ranging market may be on the horizon.
Hey Good Looking
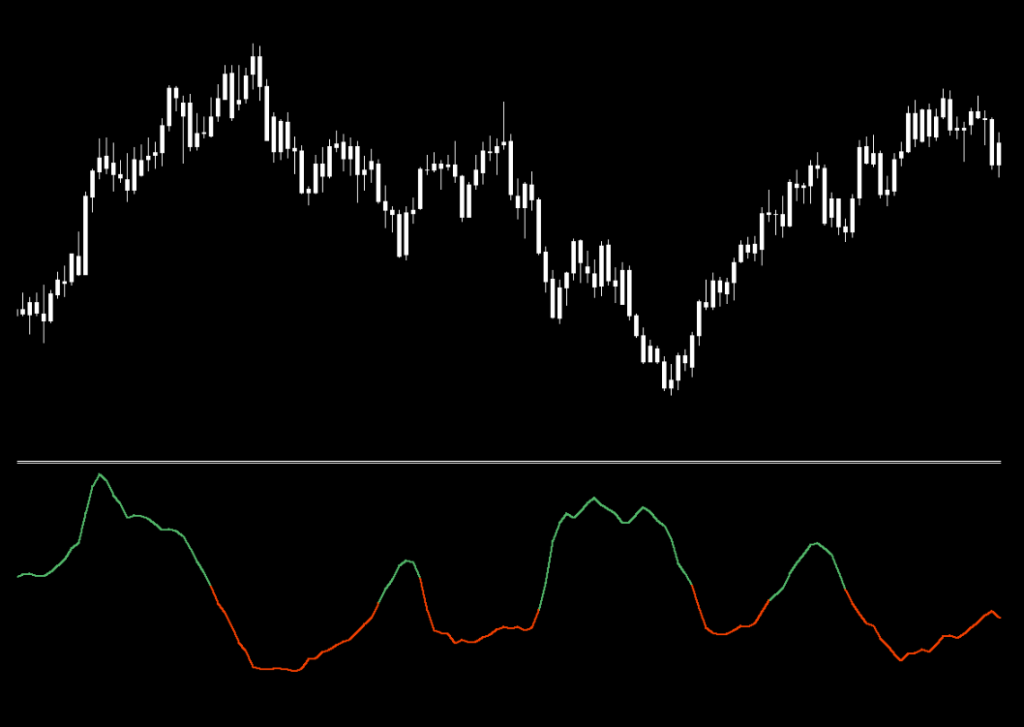
Below is a screenshot of what the indicator looks like on the daily time frame. Note that we’ve changed the color of the candles to white to remove any emotional bias so that only the indicator is prominent.
How it’s Use
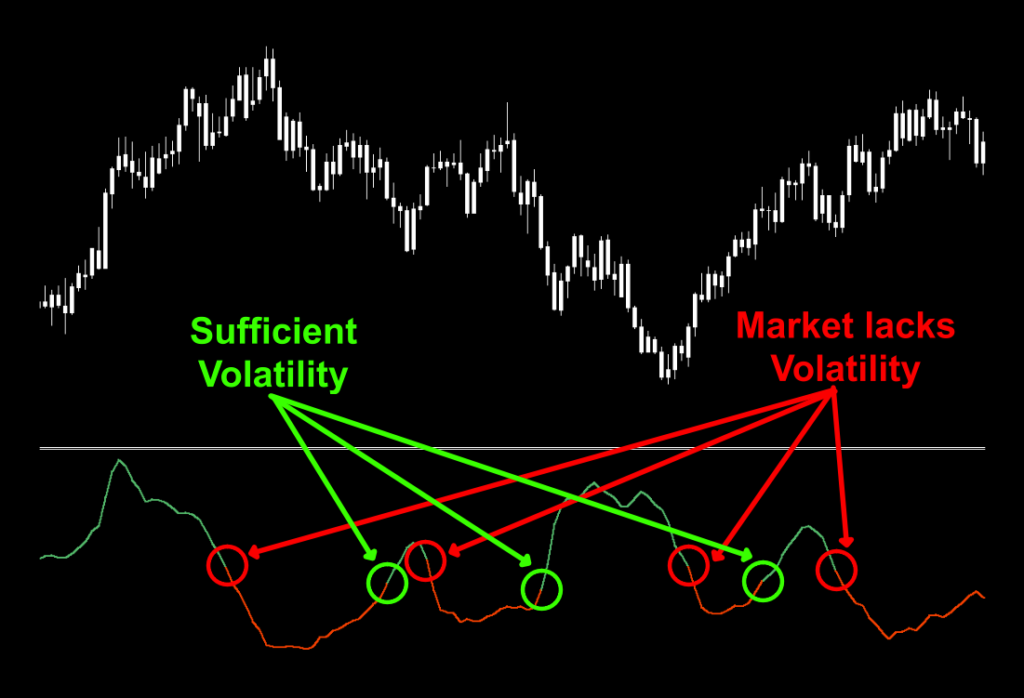
The two colors do not depict long and short, but rather;
Green: Sufficient market volatility exists.
Red: Reduced or lack of market volatility.
This indicator has been described as one which is “used to identify price patterns and breakouts”, something that we do not subscribe to. The reason is that patterns are only visible in hindsight, and breakouts from any trend line or support/resistance areas are just speculative in nature. Price can reverse, and go sideways as well. Just act on signals that the indicators provide for you. No guessing…you’re not a wizard.
Remember, never trade based on volatility indicators alone – always use as part of a system.
Settings
Volatility Period: The number of periods the indicator uses to compare to current volatility. The default value is 25.
Price: The currency pair’s price data set. The default value is “closed”, or the closing price of each period in consideration.
When volatility is used in conjunction with other indicators in your algorithm, confluence (when multiple things in agreement raise the level of confidence) increases your odds of a successful trade.
COMPREHENSIVE TESTING RESULTS ACROSS
CURRENCY PAIRS, BITCOIN, AND GOLD ARE IN
PROCESS AND WILL BE AVAILABLE WHEN THIS
INDICATOR IS HIGHLIGHTED ON THE NNFX CHANNEL
BY VP.
Resources
As we did with previous indicator studies, we’ve made the Volatility Ratio indicator available for download on our site from the indicator library. We will keep adding better indicators with each study for your use, at no charge. When you’re ready to get it, click HERE.
Money Management
For those who are curious as to what money management we’re using on our tests; we’re only using a stop loss of 1.5 x ATR and take profit of 1 x ATR. We’re only determining how well the indicator reacts to price with respect to generating a long or short signal. Your system, with its risk profile, will dictate individual returns. The stop loss and take profit levels are based on the No Nonsense Forex methodology, which can be found in the Advanced Course by clicking HERE.
More to Come
There’s a lot more to come. If you haven’t signed up on our contacts page or subscribed to the YouTube channel, please consider doing so to receive notifications as we continue to publish helpful, relevant, and informative Forex related material to support your quest to becoming a better trader.
And now, you know how to use a volatility indicator to help filter out losing trades.
Our only goal is to make you a better trader.
BTW – Any information communicated by Stonehill Forex Limited is solely for educational purposes. The information contained within the courses and on the website neither constitutes investment advice nor a general recommendation on investments. It is not intended to be and should not be interpreted as investment advice or a general recommendation on investment. Any person who places trades, orders or makes other types of trades and investments etc. is responsible for their own investment decisions and does so at their own risk. It is recommended that any person taking investment decisions consults with an independent financial advisor. Stonehill Forex Limited training courses and blogs are for educational purposes only, not a financial advisory service, and does not give financial advice or make general recommendations on investment.