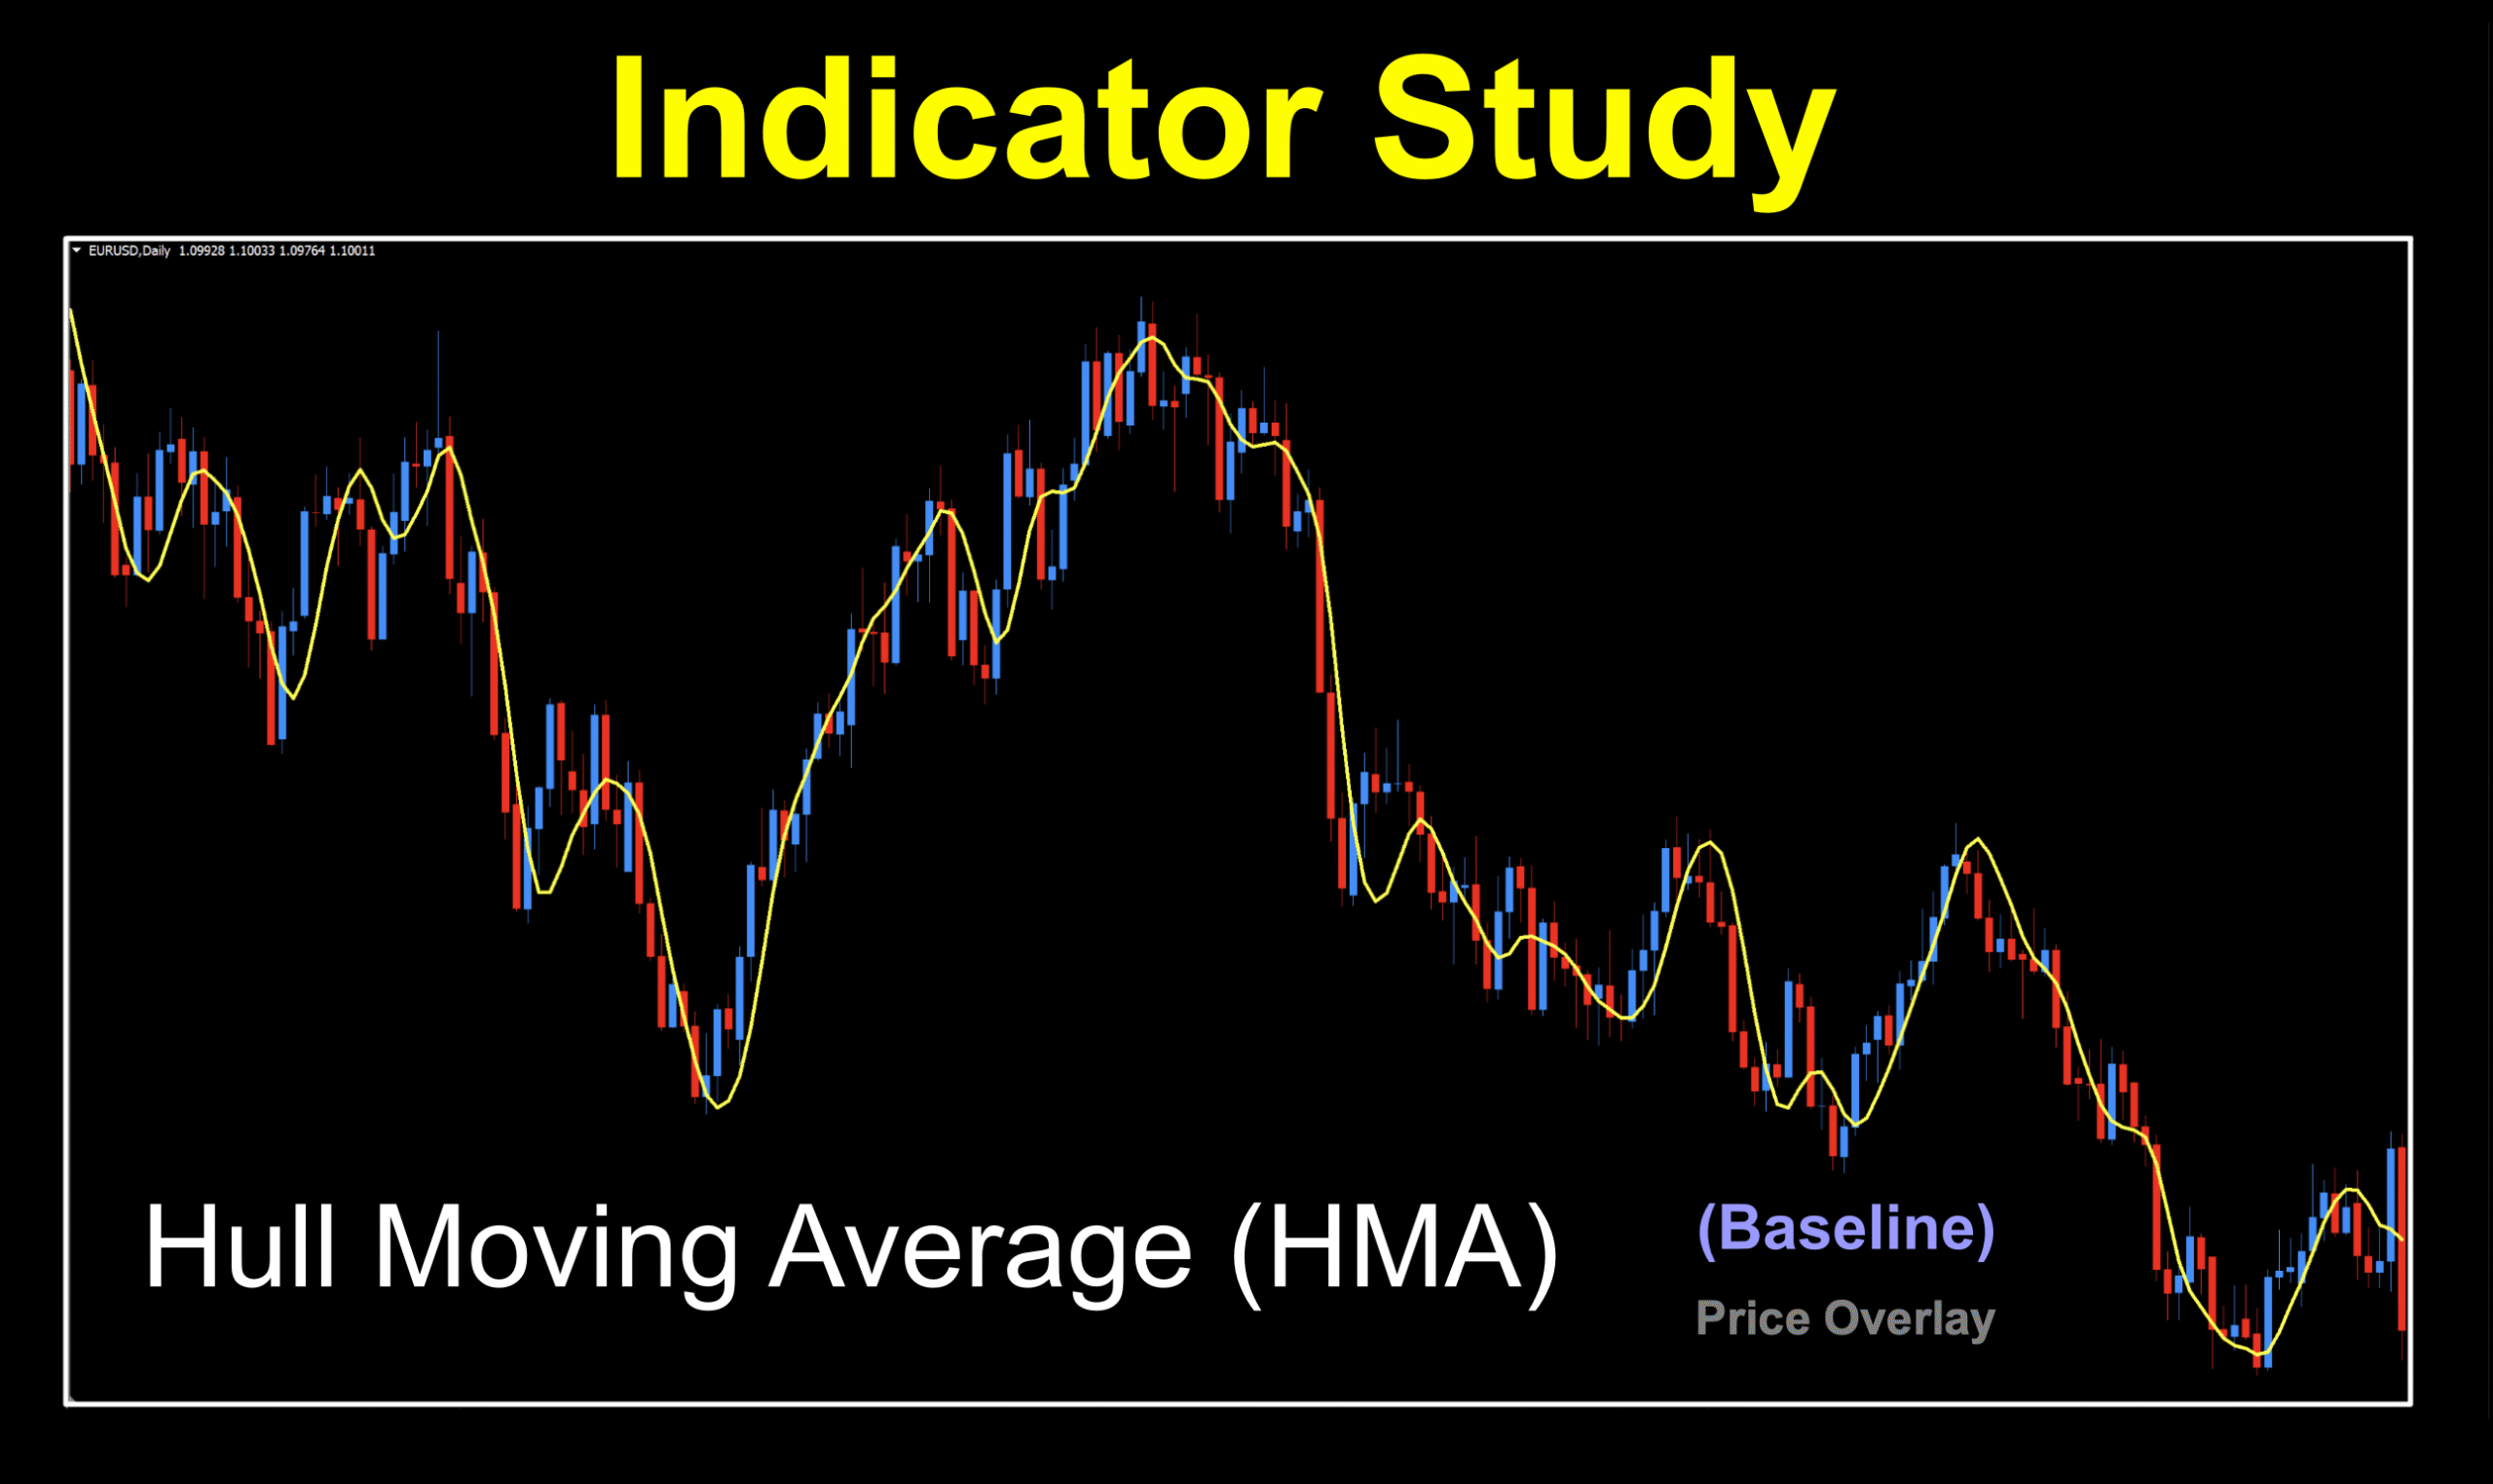
The “Hull” Thing
We’ve received requests to test this indicator for some time, which will not be profiled by VP. Coincidently, it was the first baseline blog we posted nearly two years ago, along with the indicator in the on-line library. Considering its history and the fact that many employ it in their daily trading, we felt it was a good choice for a closer look. That being the case, we’ve updated this blog and created a video. If you’ve never heard of it, we think you’ll appreciate the simpleness of it.
You Da Man
Developed in 2005 by one of Australia’s leading stock experts, Alan Hull, devised a moving average that could react more quickly than other moving averages. Used as a baseline, it may quickly become one of your favorite tools for determining the existence of a trend and the anchor of your algorithm. For those inclined to swan dive into the math, it’s fairly simple.
Dem Bones
The bones of the HMA include using two different Weighted Moving Averages (WMA) of price in addition to a third WMA to smooth the “raw” moving average. There are three parts to the calculation, as noted below.
First Step
Calculating the values of the primary moving weighted moving averages.
WMA1 = WMA(n/2) of price (n = number of periods)
WMA2 = WMA(n) of price
Second Step
Now that we have our two primary moving averages, we need to calculate the raw (non-smoothed) HMA.
Raw HMA = (2 * WMA1) – WMA2
Third Step
Third, smooth the raw HMA with another WMA, this one with the square root of the specified number of periods.
HMA = WMA(sqrt(n)) of Raw HMA (sqrt = square root)
So Fresh
We’re going to pause here for a quick video, watching the HMA at work. Wherever you are, Mr. Hull, we collectively salute you and the impressive work you do. Let us all back away from the keyboard for a few moments and let your eyes do the work for while you engage in deep breathing exercises. We’ll see you on the other side.
Visual Gratuity
We’ll post the HMA on our chart, with blue and red candles to help illustrate where entries would actually occur. We also had to change the default color of blue to yellow and thicken up the line for better visibility. Furthermore, we’ll leave the settings at the default values for initial inspection and commentary.
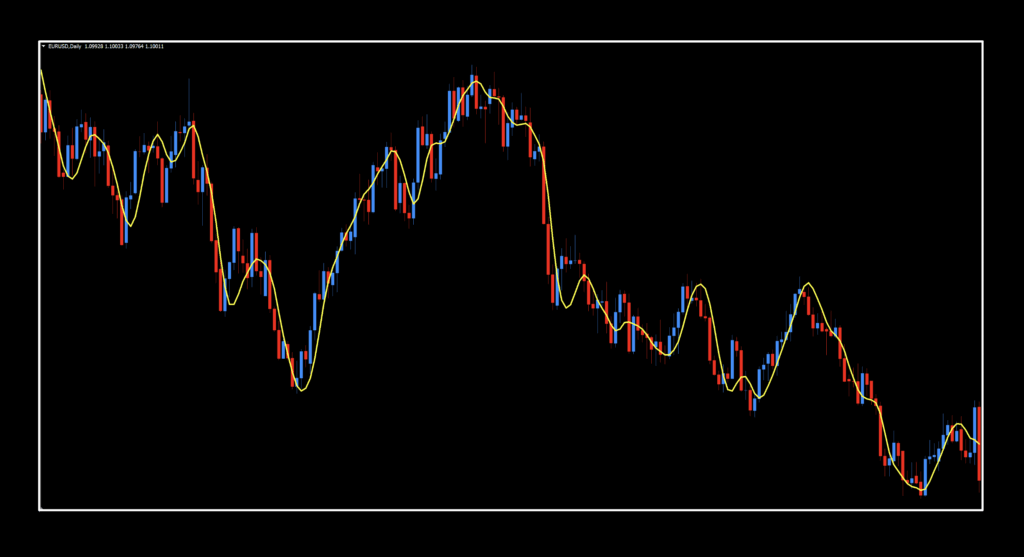
The first thing we immediately noticed is that the signal line follows price like a needy cat on the default settings. Given that the indicator relies on moving averages, it’s actually pretty impressive with regard to reactivity to price. We’ll run our testing on the default settings out of curiosity, but we imagine that some tweaks will be necessary to make it more user-friendly. In fact, for the mark-up, we’ll just plug in some random numbers to relax that cat so we can actually see the individual signals.
Settings
There are four settings in the version we’re looking at. We tested through three of them. We did not include the “Shift” setting, which takes the values and shifts them forward (positive displacement) or back (negative displacement) in time. Advancing an indicator on the chart is kind of like trying to forecast something that we have no ability to actually predict. Pushing it back doesn’t help, as it indicates a cross that has already happened. Not helpful. We generally ignore shift settings on indicators.
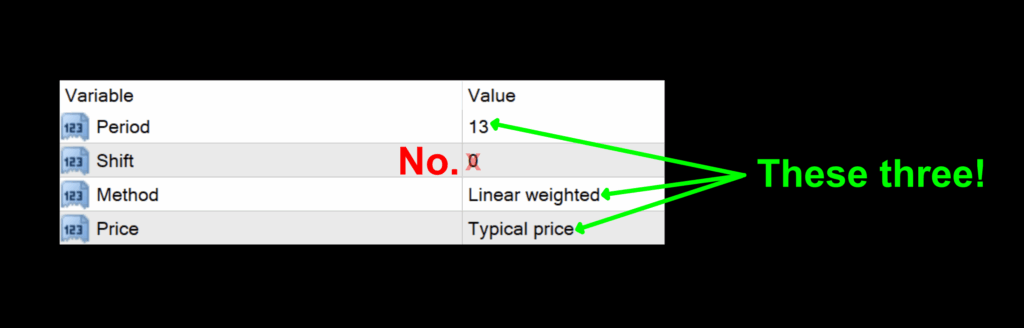
Period: The number of period to calculate the moving average lines. The default value is 13.
Method: The type of moving average line including; Simple, Exponential, Smooth, Linear Weighted – the manner in how data is calculated from price. The default value is Linear Weighted. This is kind of weird, actually, since the original concept was predicated on using the weighted moving average. But whatever, the coder included it, so we’ll test through it.
Price: The specific set of price data the indicator uses to calculate the resultant data and includes Close, Open, High, Low, Median Price, Typical Price, and Linear Weighted. The default value is Typical Price, again weird…mess hair, don’t care.
Advantages
* Reduced lag for increasing responsiveness.
* Helps to eliminate market “noise”.
* Emphasizes more recent market prices.
How we use it.
One of three actions need to happen in the last 30 minutes prior to the close of the trading day. They are; opening, maintaining, or closing a position. This is when you make your trading decisions, and not actually wait for the close at 1700 EST, because we trade on the daily time frame.
Long: When price crosses above the signal line. Entry is in the last 30 minutes of the trading day.
Short: When price crosses below the signal line. Entry is in the last 30 minutes of the trading day.
Gonna Get It
We’re now at the chin scratching portion of the blog, and we’re going to slow it down a bit for clearer signals. No special numbers, just something we pulled out of a box.
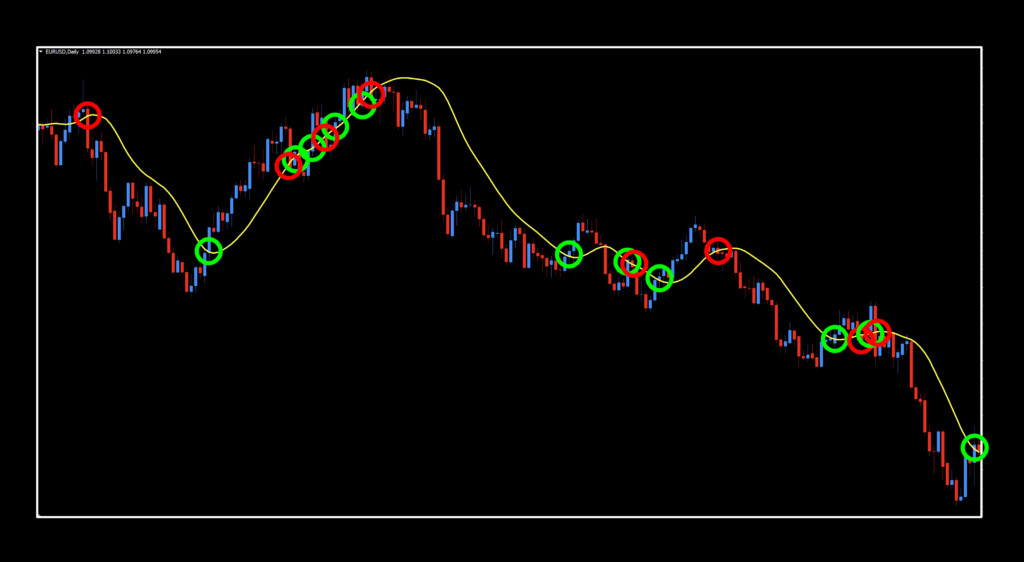
Even after “loosening” it up quite a bit, it still does a very nice job following changes in the market. You’ll notice a bit of congestion and multiple signals on the that first long rise in price towards the left side of the screen. Two things here. The initial signal would have indicated the established trend, and hopefully you’re using a quality indicator as an exit indicator to exit your trade, because why? Yessir…we generally don’t use baselines as our exit indicator because it doesn’t meet the definition of an exit indicator, except in the case of extraordinary circumstances — such as price immediately reversing hard in the other direction. That small pullback in the middle of the trend “shifted” price laterally enough to put the signal line over it. Trying to use the baseline by itself as an entry and as an exit indicator will create multiple signals, increased confusion, and may lead to blowing up your account.
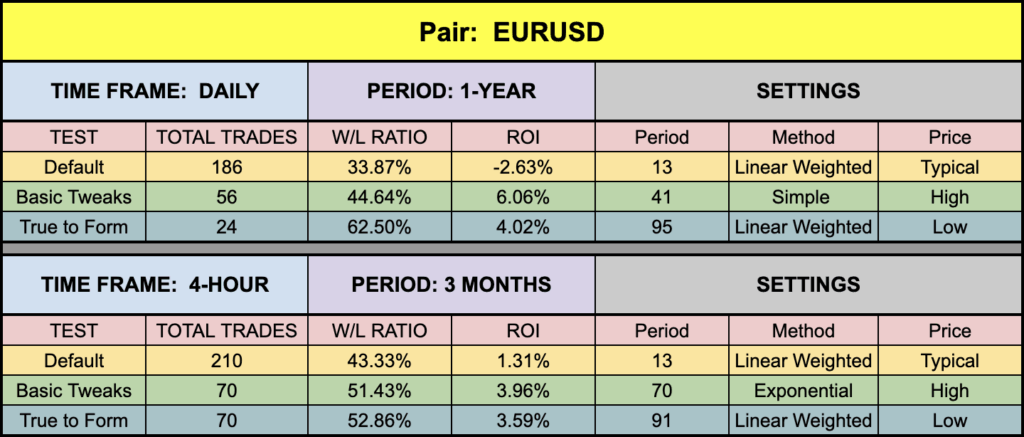
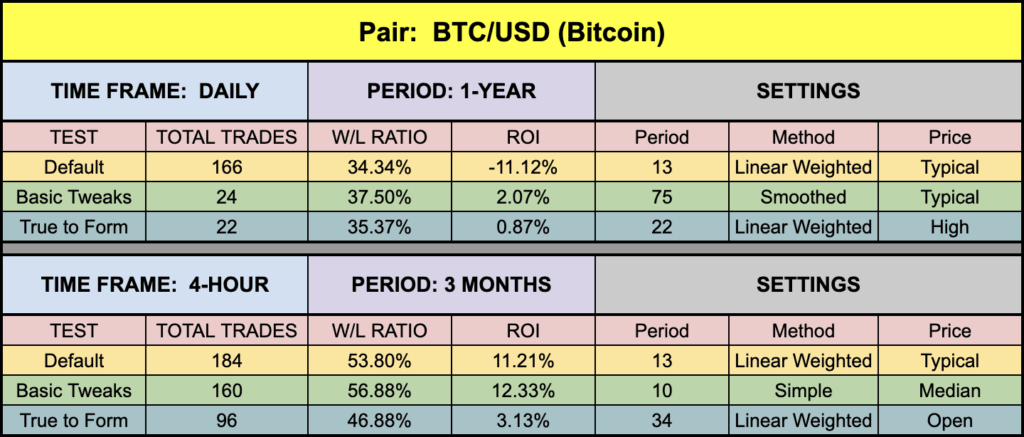
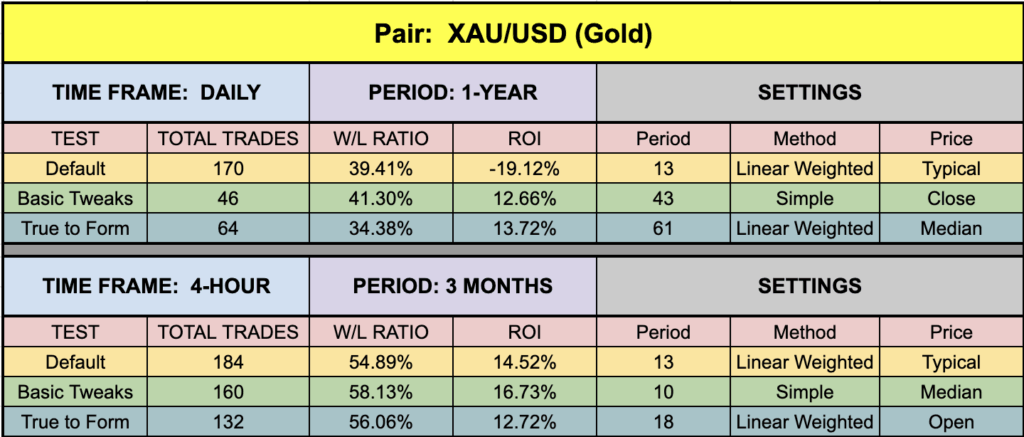
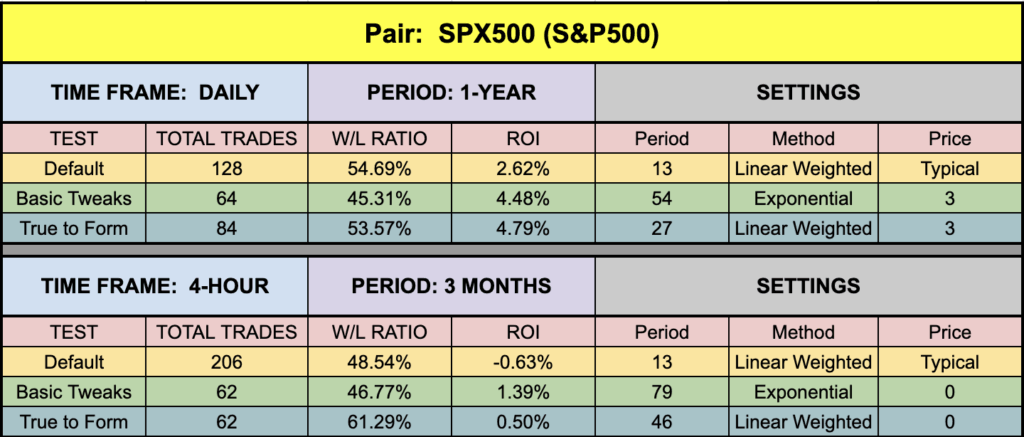
Hull Tests
If you’re new to these studies, we recommend looking at some older blogs to understand how we conduct our testing. We’re going to be using our alternative numbers.
On a Clear Day, You Can See Data Forever
Below is the data from our testing.
Hey, there’s a Third Line!
As we mentioned earlier in the settings, it’s kind of weird that we have choices for the type of moving line, since this Alan Hull specified the Weighted Moving Average in his calculations. So, we tested it a third way, leaving the moving average alone — that’s the blue line. The type of price was never specified, so using the various data sets is cool, although most developers default to the closed price due to end of day (or session) trading.
Tweaker
Now, looking at the tweaked results, what was the first thing you noticed? Yep…the Period setting were generally longer (higher) than the default of 13. Makes sense, right? What we also noticed is the number of trades. Higher ROI percentages were definitely there with shorter Periods, but the number of trades went sky-high.
Your Point Sir?
The point of this is that the HMA can get you on board early. We like this, after all, getting into a trend at the start is like finding gold, no pun intended. The results of the testing shouldn’t be taken too much to heart, as the ROI will be low due to the inherent properties of the indicator. Does that mean it’s not helpful. Quite the contrary. Test this bad boy with your choice of exit indicator and just eyeball the chart. We did, and we were pretty happy with the observable results.
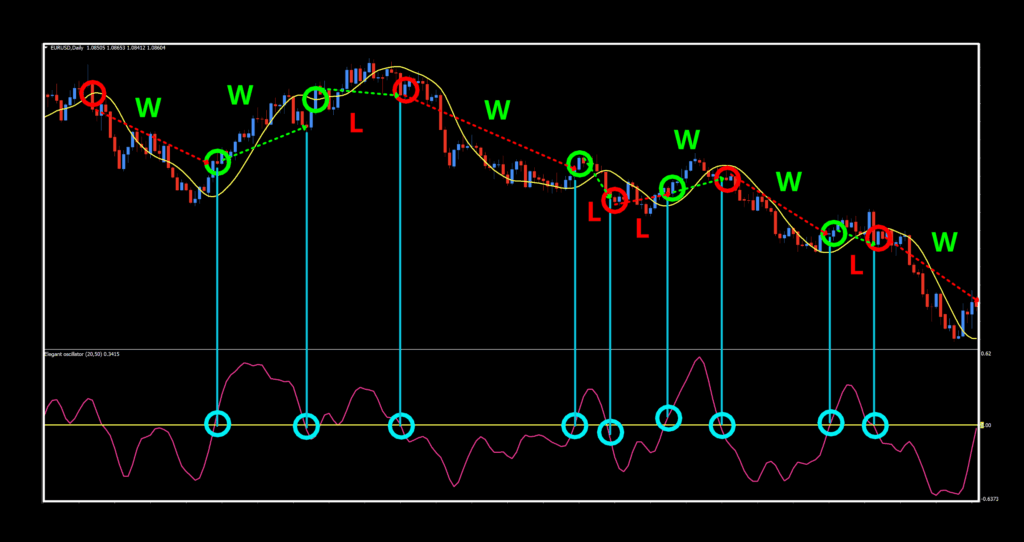
Looky
I mean, just look at this chart where we stuck on the “Elegant Oscillator” as an exit indicator (default values) and changed the HMA to Period (30) to slow it down. We’re disregarding the ATR trailing stop for illustrative purposes. There were instances where your trailing stop would have yielded larger profits. Out of 10 trades, there were six winners and four losers, so a 60% win/loss rate. If you were to look closer at the trades, the wins were also generally larger than the losses. We paired this indicator with a different exit in the video, so now you get to see it different ways. Bonus!
The indicator is in the library for free. When you’re ready to get it, click HERE. Be sure to subscribe to the Stonehill Forex YouTube channel for the technical analysis videos. Sign up for the Advanced NNFX Course HERE.
Our only goal is to make you a better trader.
*Our published testing results are based on money management strategies employed by the NNFX system and depend on varying external factors, which may be different between individuals and their specific broker conditions. No guarantee, trading recommendations, or other market suggestions are implied. Your results and subsequent trading activities are solely your own responsibility.
BTW – Any information communicated by Stonehill Forex Limited is solely for educational purposes. The information contained within the courses and on the website neither constitutes investment advice nor a general recommendation on investments. It is not intended to be and should not be interpreted as investment advice or a general recommendation on investment. Any person who places trades, orders or makes other types of trades and investments etc. is responsible for their own investment decisions and does so at their own risk. It is recommended that any person taking investment decisions consults with an independent financial advisor. Stonehill Forex Limited training courses and blogs are for educational purposes only, not a financial advisory service, and does not give financial advice or make general recommendations on investment.