Our love of indicators can be thought of as favorite foods, served on fine china (charts) and manipulated by exquisite silverware (money management and trading psychology). The trick is to find those indicators which not only appeal to us, but actually serve a useful function; and be tasty too!
It Takes All Types
In this blog, we examine the various types of indicators, what they look like, and why some are less useful than others. While there are various charting platforms including Trading View, Think or Swim, Trade Station, eToro, web based platforms, and so on, we will concentrate on those which are available for the MetaTrader 4 (MT4) platform, the best platform of the bunch.
Settle In
This blog is a bit longer than others, but full of information that will serve you during your trading career. As you progress through your search for better indicators, remember; some will be utterly useless, some will look beautiful (but useless), plain (but immensely helpful), and many with fair to middling qualities. The more research done will ultimately yield the few gems to help you become profitable!
Before I get into the types of indicators we want to find, let’s look at the six types of indicators we can generally ignore. They are, in no particular order:
1. Indicators Which Do Nothing But Follow Price
Notice that the indicator seems to echo price action. There is nothing to help you create your system or provide useful signals.
2) Indicators Which Don’t Work Well in the Example
When coders build an indicator, they want to show off their work, so they tend to cherry-pick charts where the indicator they created worked like a charm. If coders cannot accomplish this, the indicator may not perform well. In this example, there are three wins and five losses based on our trading methodology. By the way, this one was for sale. Not a great deal, right?
3) Too Many Signals
Naturally, some indicators will give you more signals than others – that’s just how they work. However, indicators that give you an unusually high number of signals won’t work due to overtrading. Your account would quickly dwindle down to zero from over trading.
This type of indicator is based on GRAB candles (Green Red And Blue), which had its day, but this indicator is an eyesore. Using this indicator, even combined with better ones, trade frequency would prevent any real profits and most likely exiting too soon. You could tweak the settings and smooth it out, but these indicators are so erratic on the default settings, the chance to make it awesome are slim to none.
4) Indicators Offering Support/Resistance Levels
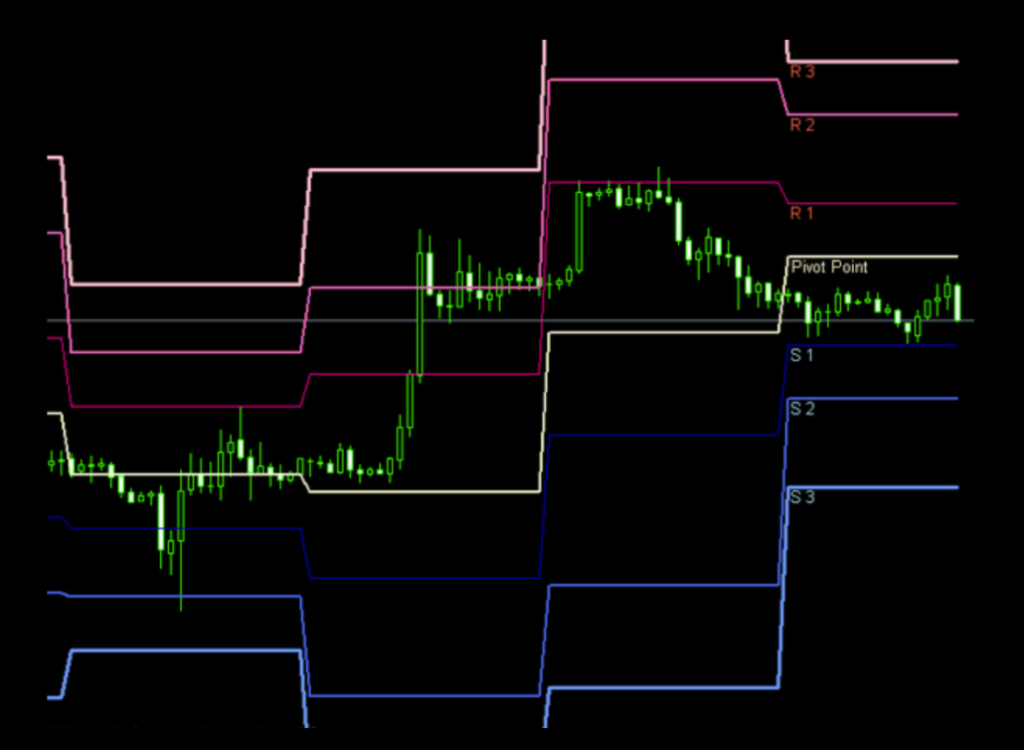
Support and Resistance lines are part of the Dirty Dozen. These indicators attempt to predict points on the chart where price may break out or reverse. VP put out a great video on this…which happens to be discussed in great detail in the Advanced Course.
You cannot know in advance with any degree of certainty. Indicators offering these types of lines on a chart, simply pass and keep looking. Indicators with the words “pivot”, “Gann”, “channel”, “band”, “Fibonacci”, also fall into this category. Additionally, trend lines (horizontal or otherwise), and indicators that create shapes are generally not helpful.
5) Indicators You Cannot Adjust
The most important part of creating an algorithm is the ability to improve what you create. By using indicators whose settings cannot be changed is comparable to making the statement, “This is the best version!”. Oh really? How could it be the best version in a market that always changes? The bottom line; if you can’t adjust it, throw it away.
6) Repainting Indicators
The last type of indicators to watch of are called “repainting”. Many traders fall victim to repainting indicators. These indicators “repaint” or change past values by altering its appearance. This can lead the trader into believing they have an indicator that plots extremely accurate signals. We posted a detailed blog on this kind of indicator with graphics illustrating what it does. The blog is called; “Repainting Indicators…You Ain’t Pretty” and can be found on the Stonehill Forex site by clicking HERE.
Pro-Tip
If you see any of these types of indicators, do not waste your time investigating them; move past and resume your search for better indicators. However, a word of caution; do not surrender to laziness and immediately dismiss an indicator which may prove useful later. It may have value you just don’t see at the moment.
Emotional Baggage
I’m going to put a caveat (provision) right here because there is a good chance someone who reads this blog may be offended, upset, dismayed, flustered, agitated, or mildly annoyed. Some traders become defensive and oversensitive about their *favorite* indicator. Especially Fibonacci traders. Those folks will challenge you to a duel over the virtue of their indicator. That’s perfectly fine. If you have a specific indicator that has performed really well for you, then keep doing what you’re doing. However, for the majority of traders – especially newer ones, the above-mentioned types of indicators may ultimately lead to losses. Remember, we’re just illuminating what may provide you with a quicker, easier, and simpler way to create profit from trading. Furthermore, if you are defending any of the dirty dozen indicators, but you’ve never tested it against any others, then you have no argument. You owe it to yourself to find the best, and you’ll never accomplish that this way.
Let’s Get to the Good Stuff!
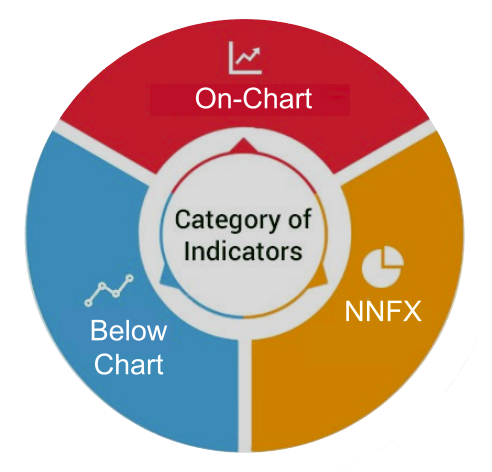
Geographically speaking, indicators reside in two main areas; on-chart, also called price overlay and below price, also called sub-chart. When we investigate indicators in the blogs, we always specify where the data is located. Below are screenshots exhibiting a price overlay indicator, and then we’ll follow with below chart indicators.
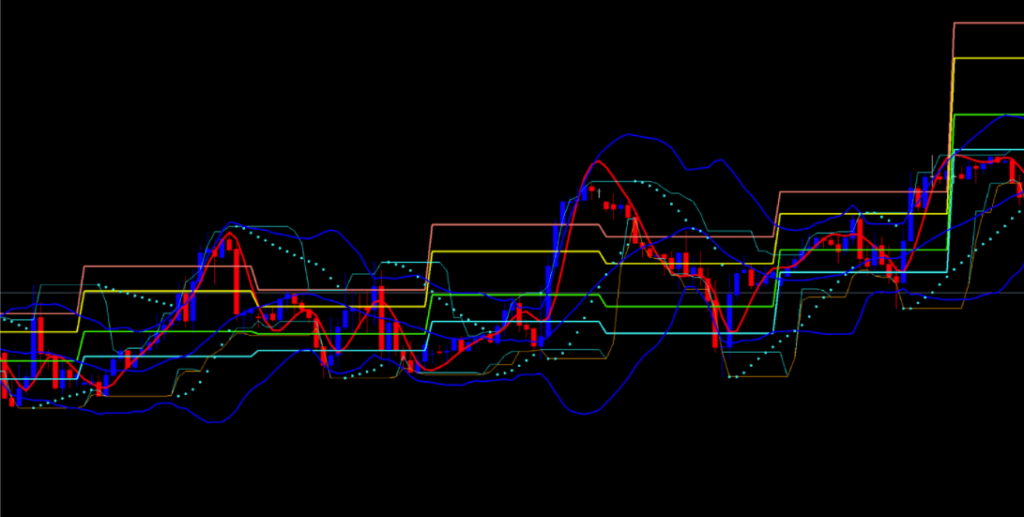
Price Overlay
This is a typical price overlay indicator. Notice that it visually provides information directly corresponding to what is happening with price, helping you make quick decisions of whether a possible signal exists, or not.
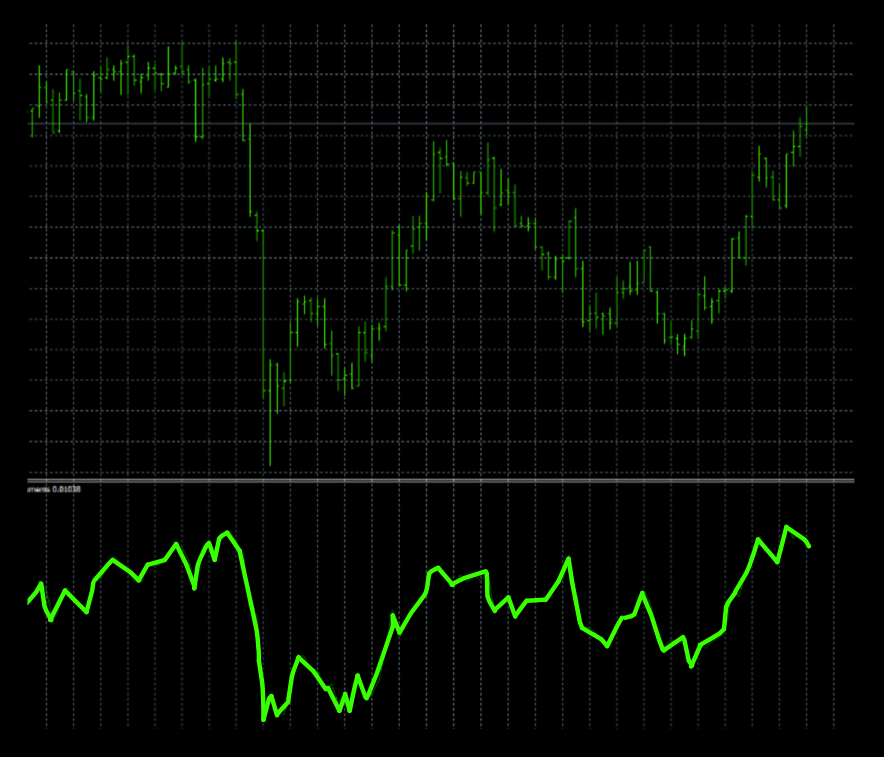
Below Chart Indicator
This type of indicator is generally used in conjunction with a price overlay indicator to help form your system. Looking for agreement (or disagreement) between indicators helps provide the data you need to establish a decision of whether to open, close, or maintain a position.
Pros & Cons
The advantages of on-chart indicators are that they can provide immediate comparative analysis as they lay over price. The disadvantage is that price window indicators can become distracting and, at worse, can lead to something called “indicator paralysis” – meaning that the excessive available data can literally remove the ability to make decisions.
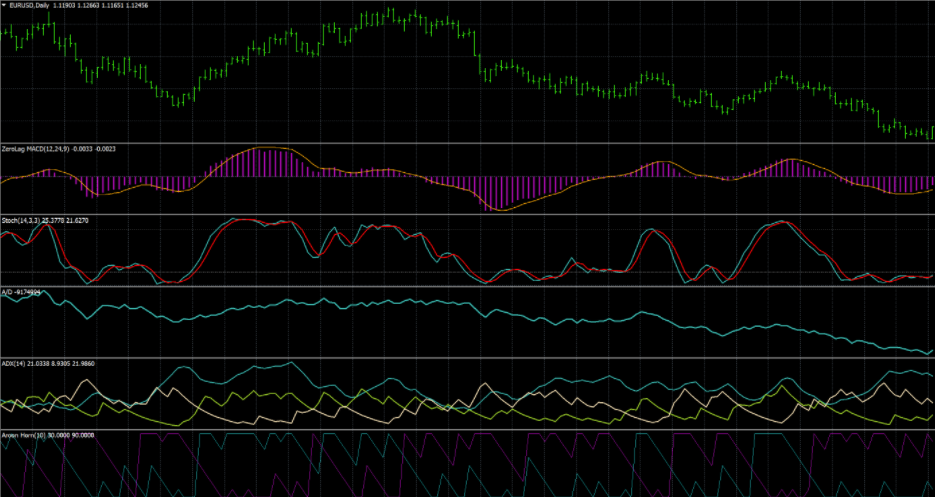
Below is an example of what a confusing chart might look like. Keep in mind that this chart ONLY has 5 indicators. We’ve seen traders with many more. What a mess.
The same concept applies to below chart indicators. Too many, and it becomes somewhat difficult to synthesize all that information for an effective decision-making process.
On-Chart Indicators
Let’s look at different indicators which can be used for baseline, confirmation, and volume. We’ll cover the majority of indicator types; however, there are those which look different. We will showcase those as well.
Single Line Cross (Signal)
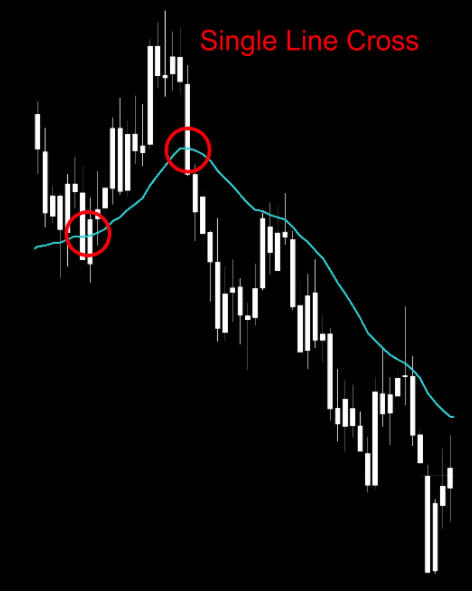
Where prices closes above or below a signal line, indicates that a trading condition has been met. The most basic indicator of this type is the SMA – Simple Moving Average. We’ve even posted blogs on this type of indicator; SMA – SIMPLE MOVING AVERAGE and the HMA – HULL MOVING AVERAGE.
Two Line Cross
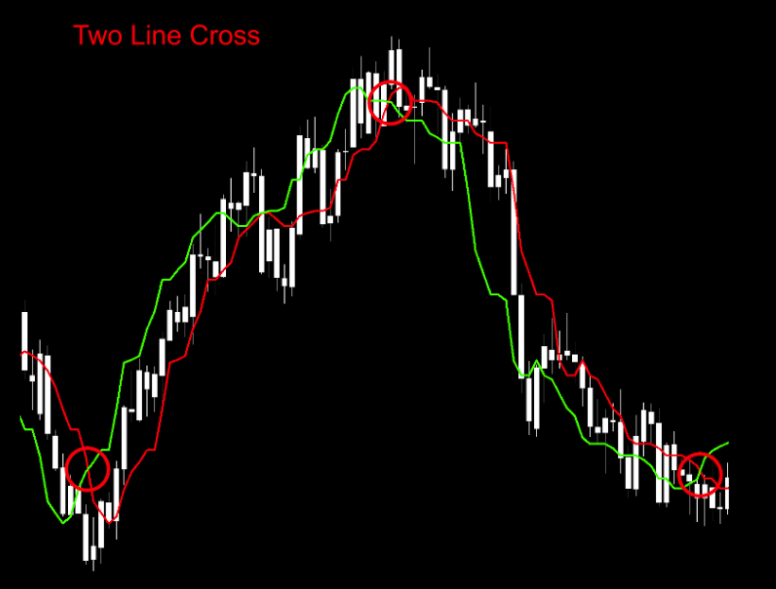
The intersection of two signal lines crossing indicates where a potential entry and/or exit may exist. Another popular two line cross is the use of an on-chart indicator paired with a moving average.
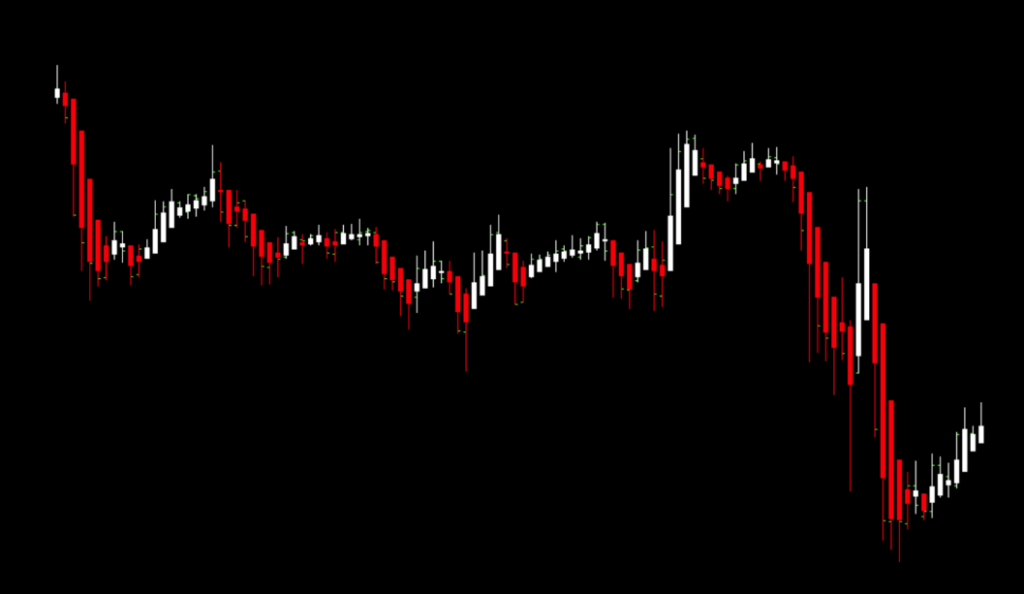
Histogram
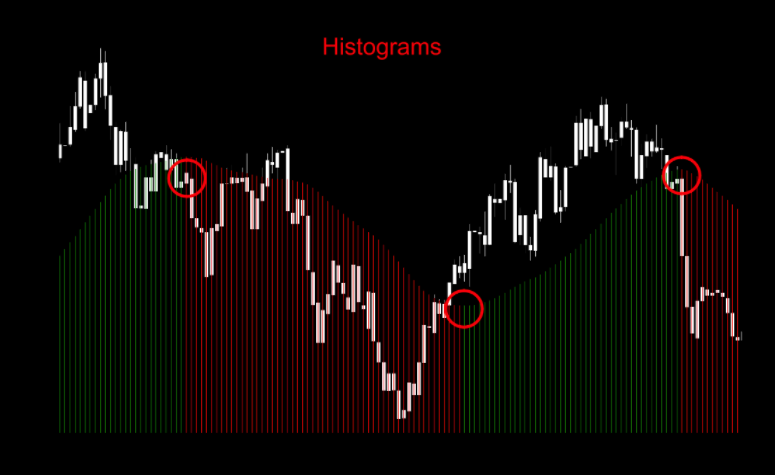
Color change and amplitude (height) provide the trader with an indication of long or short signal.
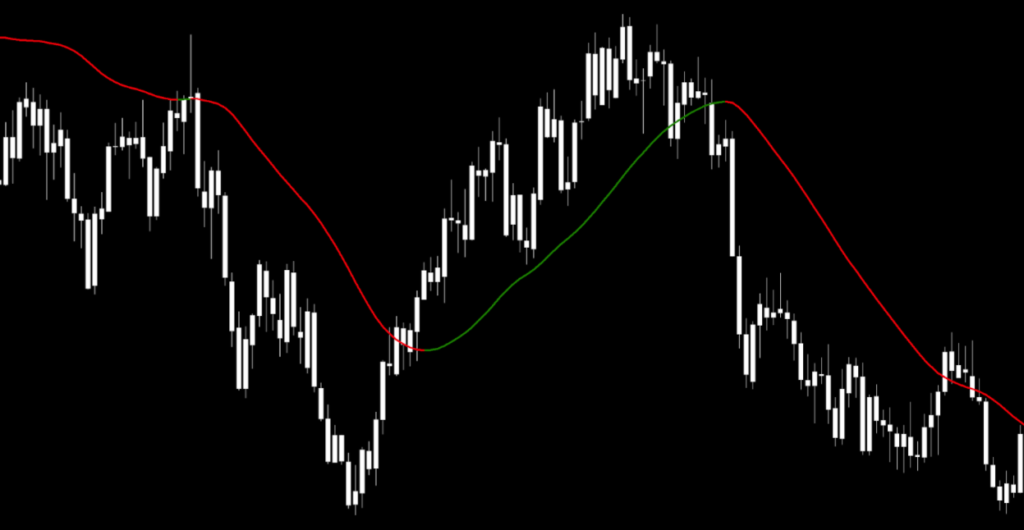
Color
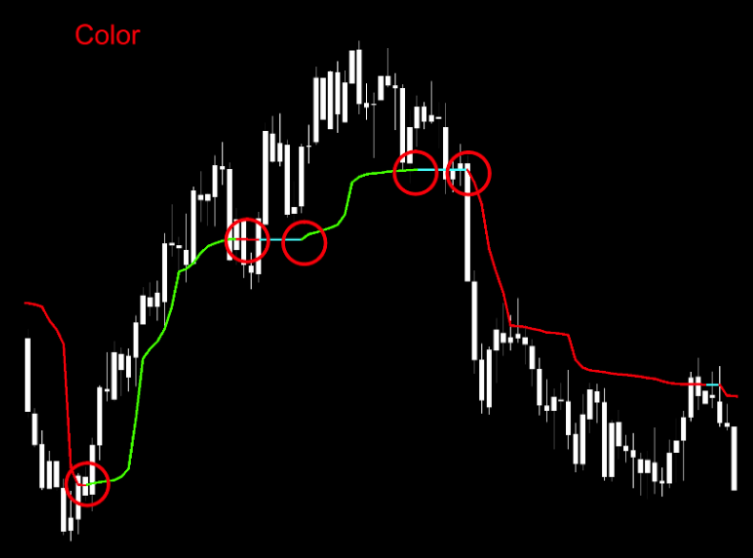
Indicators, which use color change to indicate a potential entry and/or exit. There are many variations of this indicator. The example below demonstrates green as a long entry, red as a short entry and blue as neutral; no entry. Check out two color change indicator blogs we’ve posted; KALMAN FILTER INDICATOR and the MCGINLEY DYNAMIC INDICATOR.
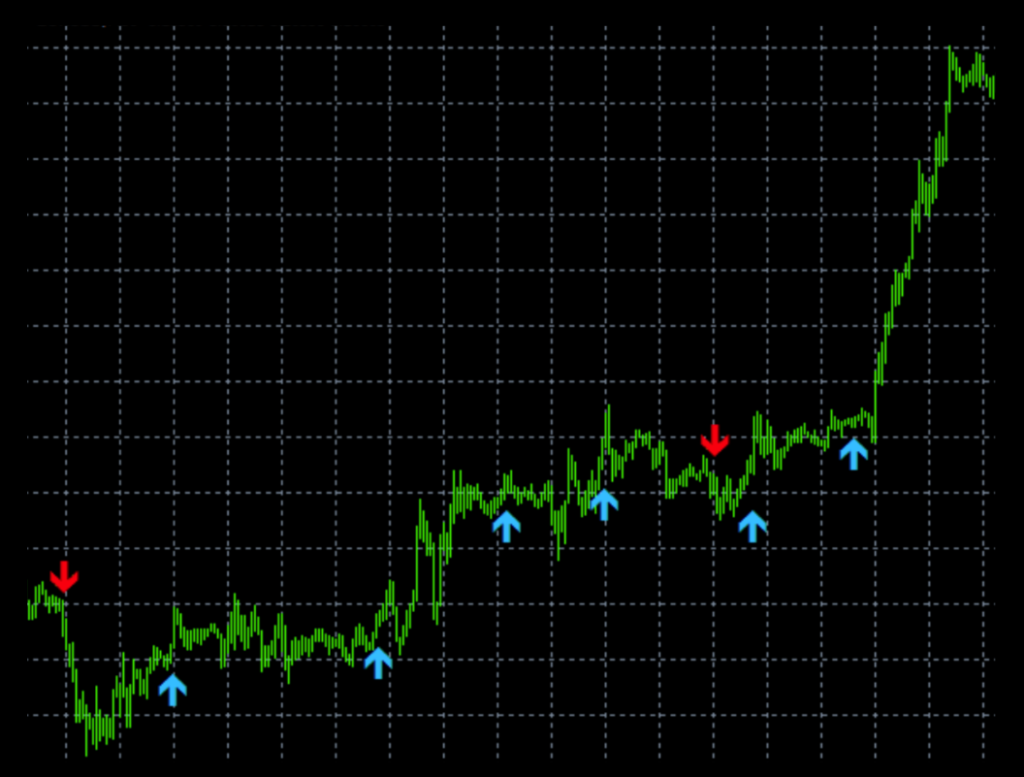
Arrows
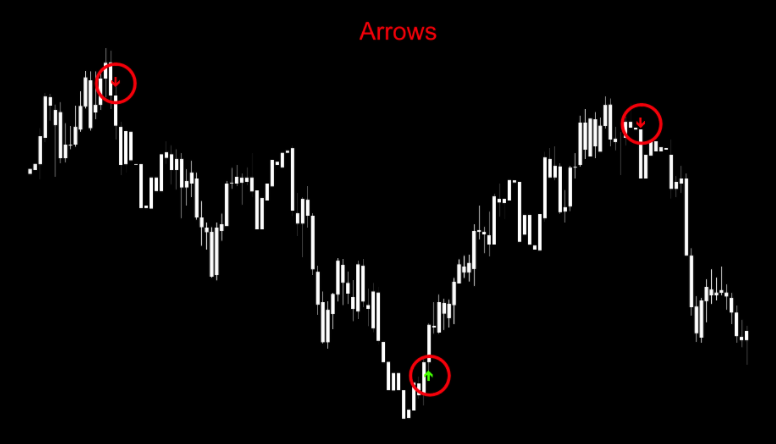
Where an arrow (sometimes colored to indicate direction) may indicate a possible long or short condition.
Dots
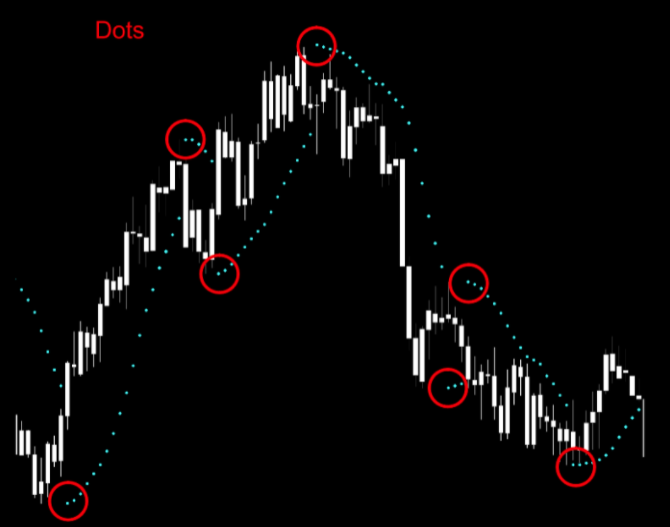
Dots above or below price indicate either an entry or exit signal (depending on the direction of your trade). They also indicate a possible change in price direction.
Miscellaneous
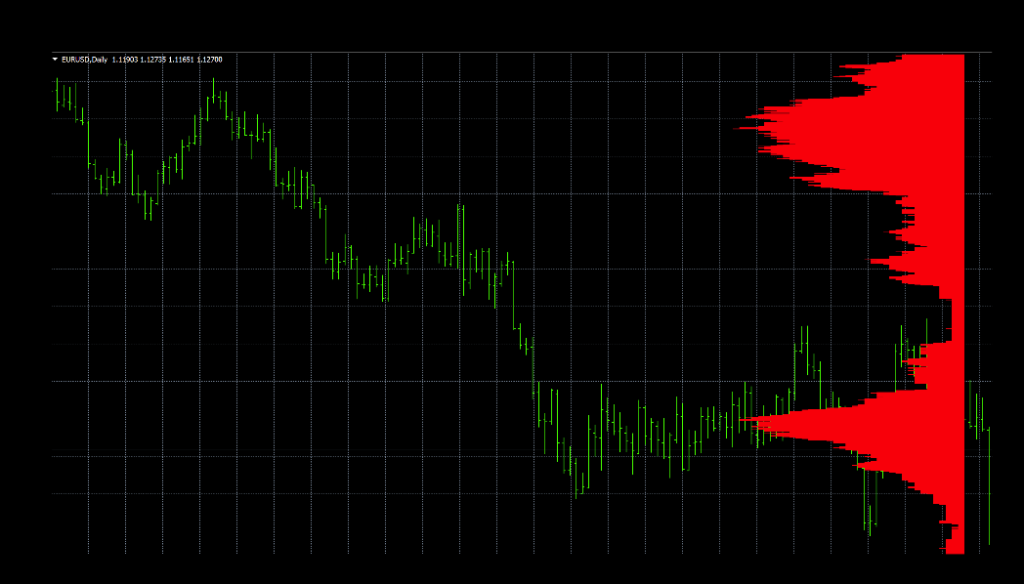
Below is a screenshot of an indicator which displays data in what can be described as a “market profile”. The data could be the amount of open trades at certain price levels, volume, long versus short positions, or other information. We don’t generally find these helpful, or necessary.
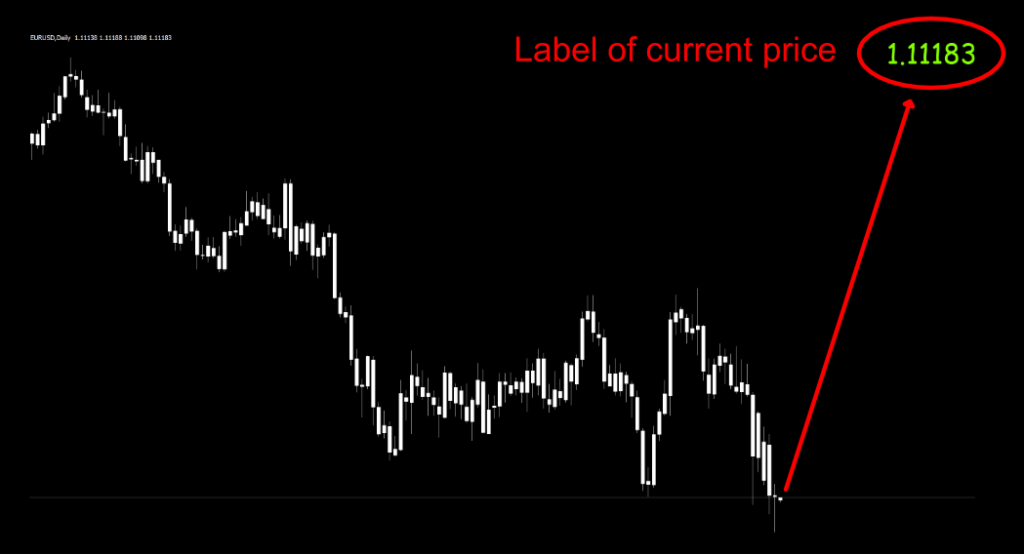
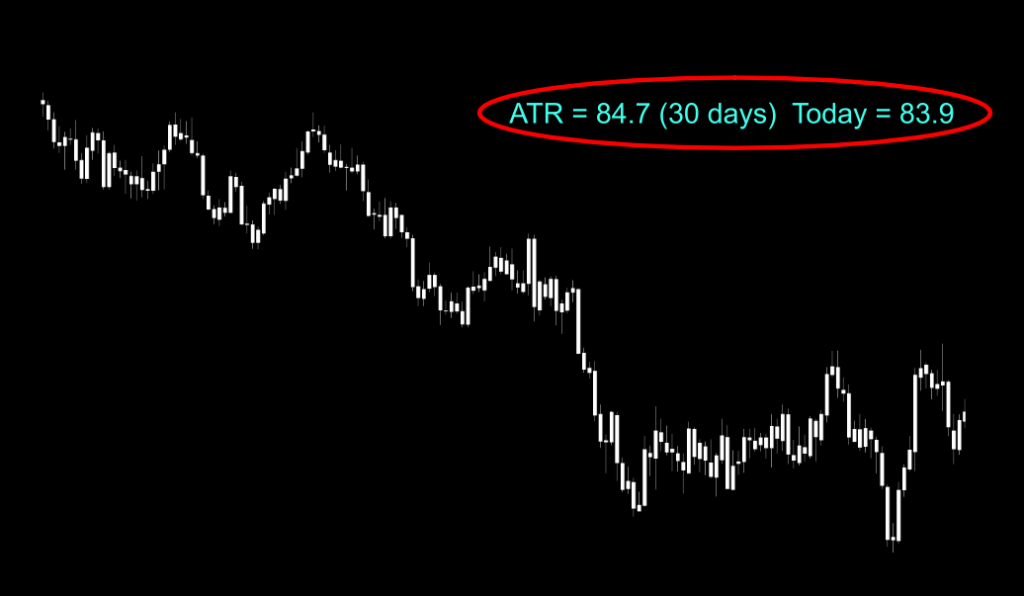
Another type of indicator places labels on the chart. This one, highlights the current pair’s price in bright bold numbers on the chart, for easy identification. Another great example might be one which prints out the ATR on the screen, without having the below chart version taking up screen space.
Below Chart
The next set of indicators we’ll discuss reside below the price chart in a separate window, called the “below chart”, or “sub chart”. They, too, come in many forms and appearances.
Single Line Signal
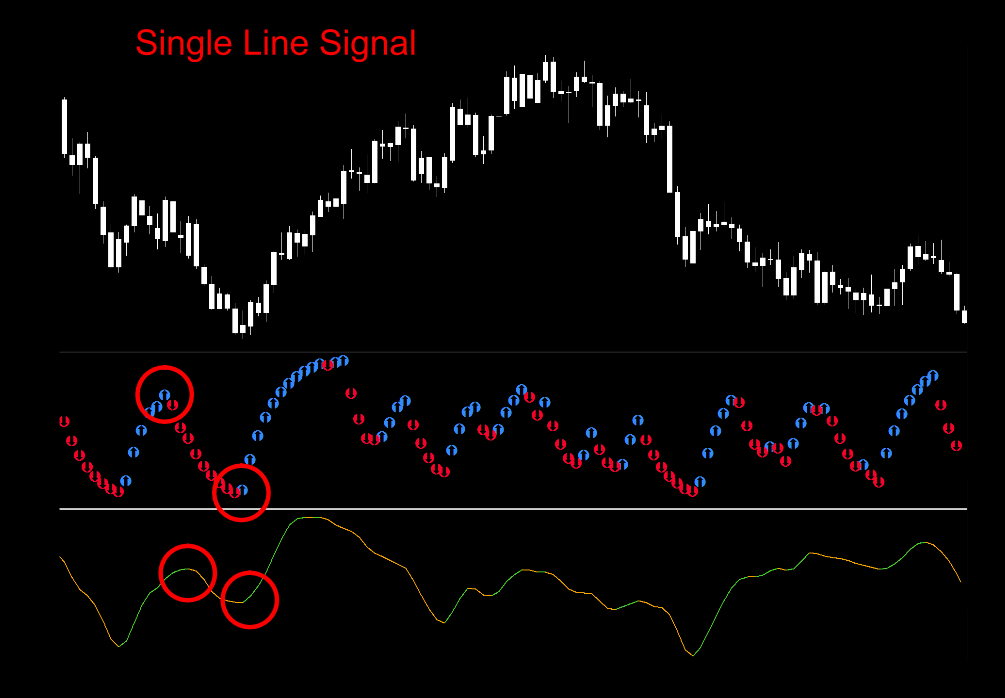
These below chart indicators create signals as they move up and down using various characters and colors. Check out a Single Line Signal indicator blogs we’ve posted; SCHAFF TREND CYCLE.
Single Line (or Level) Cross
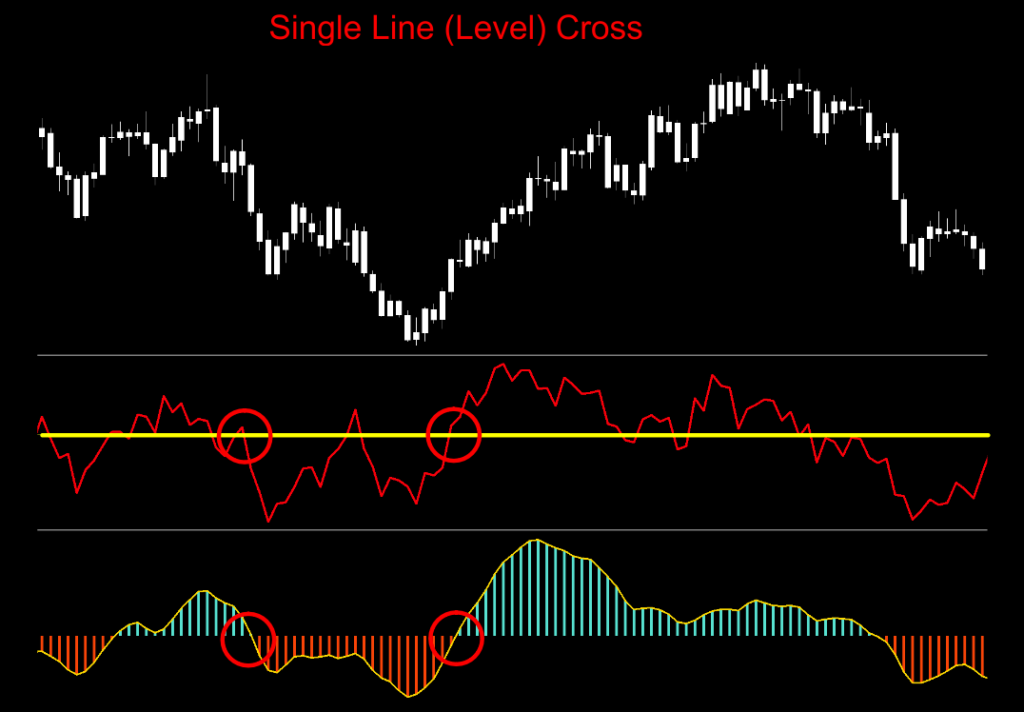
One of the most popular types of indicators, the Single Line Cross, generates a signal when the indicator’s main feature crosses a specific level. It has also been referred to as a zero cross in our literature. What makes this one of the most straightforward types of indicator to use is that it produces a binary decision; yes/no, short/long, or open/close. It can be a histogram bar, line (single or multicolored), a symbol (such as an arrow). We showcased a more efficient version of the MACD indicator in this blog after making a couple of changes to the settings which you may find helpful; ZERO-LAG MACD.
Two Line Cross
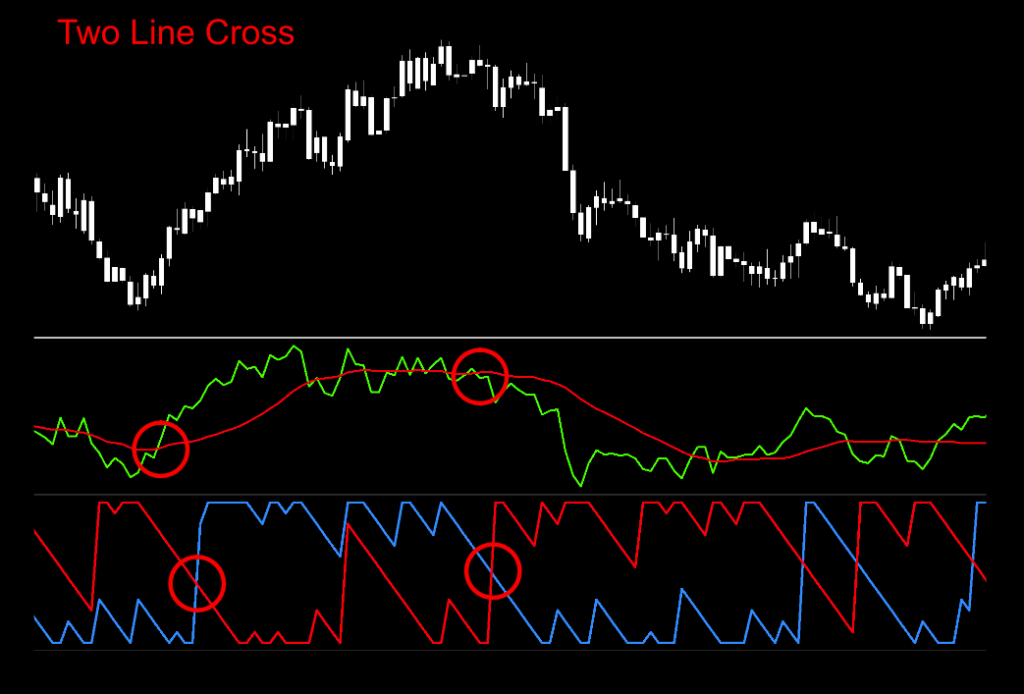
A two line cross below chart indicator is similar to what you might find in an on-chart indicator. The signal is generated when lines intersect. You might want to read up on one of these types of indicators we posted; the AROON UP & DOWN.
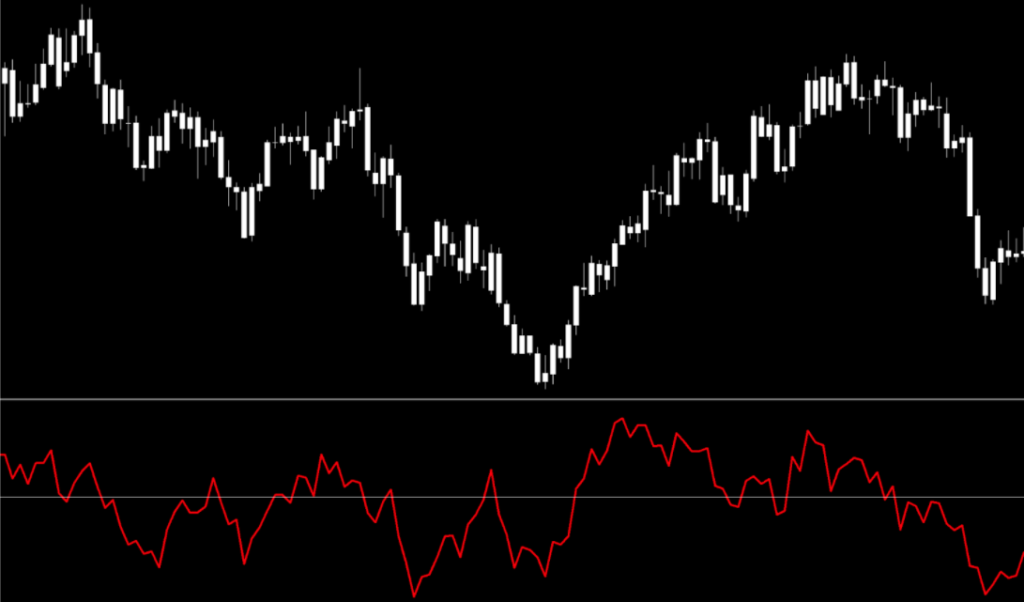
Two Level Cross
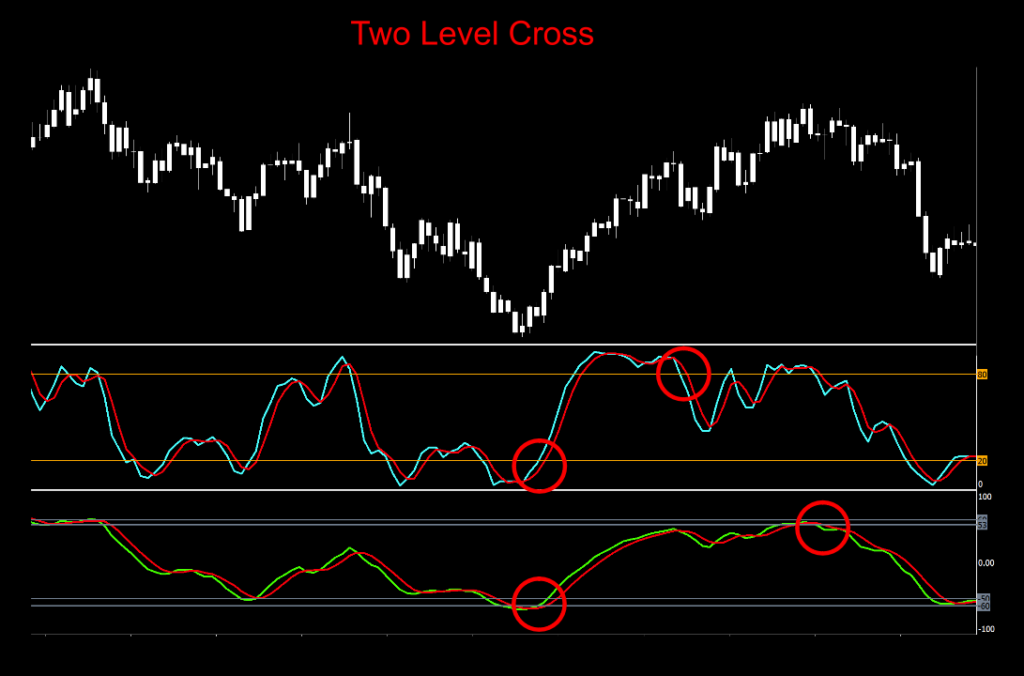
This indicator produces a signal when the indicator line (bar, character) crosses specific levels. Examples may be the standard RSI (Relative Strength) and Stochastic Indicators.
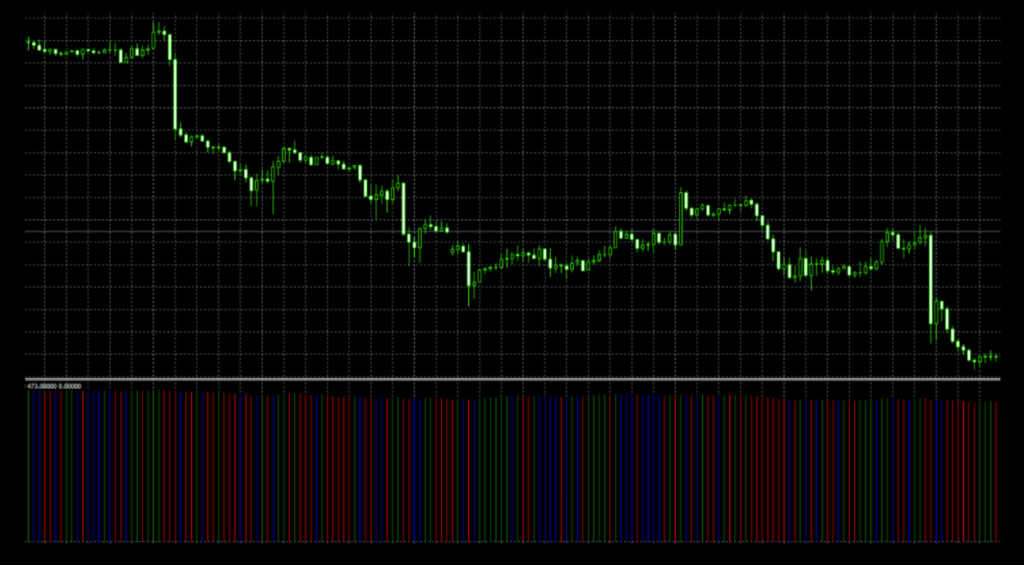
Histogram/Colors
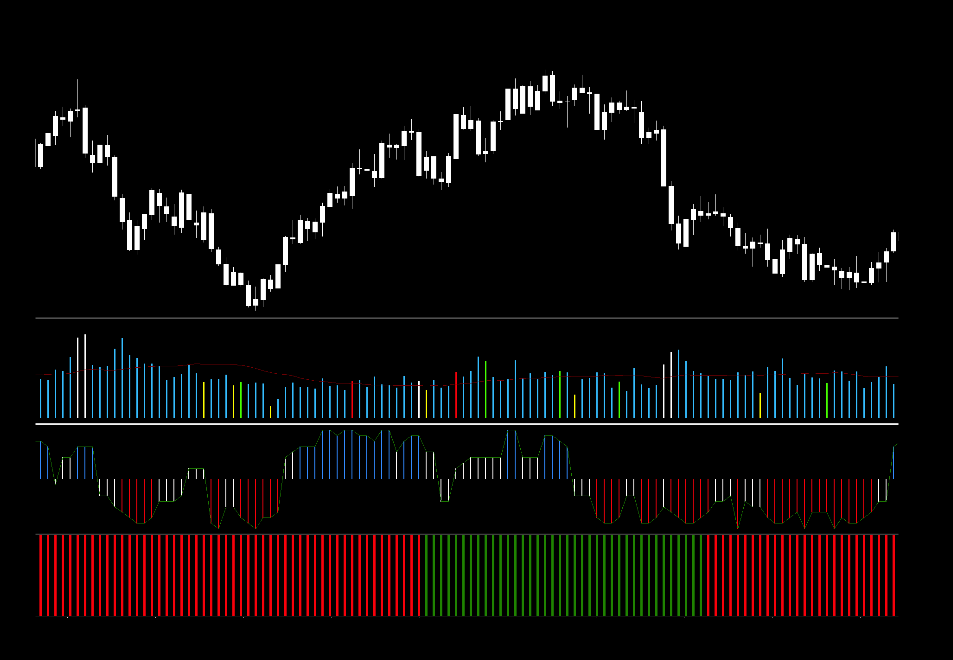
The examples below demonstrate that this type of indicator can appear quite different from others. The signal is generated when there is a “switch” between characteristics including; different colors, different bars, various symbols and other characters. Many volume indicators have this kind of appearance. Some may only be red/green and others are various colors to capture the magnitude of the histogram.
Arrows
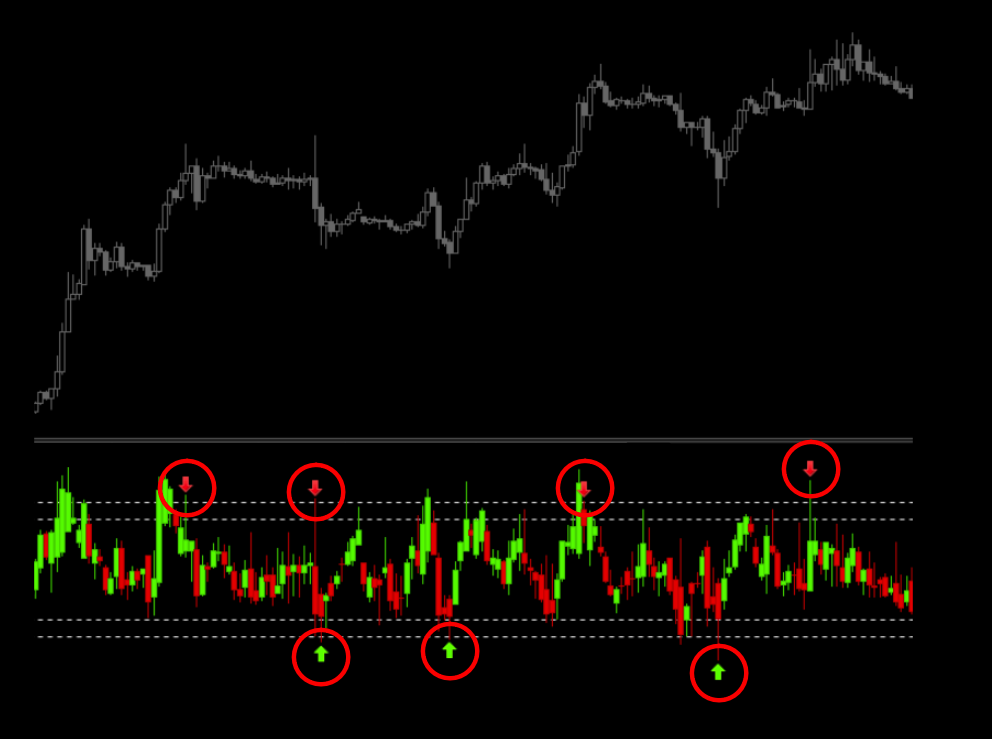
Like the histogram/color indicators, an arrow (or other symbol) can generate a signal based on its own characteristics.
Last Words
Are there other kinds of indicators? Probably. But, we know what works. The best lesson we teach is that YOU will have the knowledge and understanding to find what works best without wasting time on techniques that don’t work well. There are over 10,000 indicators of all types out there waiting for you. Most are free. Go forth…explore, test, and as always, be relentless!
More to Come
There’s a lot more to come. If you haven’t signed up on our contacts page or subscribed to the YouTube channel, please consider doing so to receive notifications as we continue to publish helpful, relevant, and informative Forex related material to support your quest to becoming a better trader.
Advanced Course
To learn more about trading Forex, consider taking our advanced course. Click HERE for more information.
Our only goal is to make you a better trader.
BTW – Any information communicated by Stonehill Forex Limited is solely for educational purposes. The information contained within the courses and on the website neither constitutes investment advice nor a general recommendation on investments. It is not intended to be and should not be interpreted as investment advice or a general recommendation on investment. Any person who places trades, orders or makes other types of trades and investments etc. is responsible for their own investment decisions and does so at their own risk. It is recommended that any person taking investment decisions consults with an independent financial advisor. Stonehill Forex Limited training courses and blogs are for educational purposes only, not a financial advisory service, and does not give financial advice or make general recommendations on investment.