
We use the MetaTrader 4 (MT4) platform for a number of reasons. First, and foremost – it’s what most brokers use. Second, it’s very user-friendly. Third, it has the largest public (free and pay) library of indicators available AND permits you to effectively back test. If that doesn’t convince you to use it, then I don’t know what will…
Class is in Session
This blog will feel more like a lesson. That’s okay because it’s what we do here at Stonehill Forex. We’re all about making you a better trader. And, what better way to become a trader than to have the ability to test your indicators and Expert Advisors (EA).
Step by Step
We’re going to take this step by step. It may seem long, but the steps are quick. There should be no reason to look outside your MT4 platform. Everything we’re doing here is on your platform. We will only cover the basics of the strategy tester due to the massive amount of features it boasts. We want you to familiarize yourself with strategy tester basics before you continue experimenting with it. For whatever reason, your platform does not have this easy to use EA, it will be available to download from the Indicator Page on the Stonehill Forex website HERE.
First, what is the strategy tester? In simple terms, it is a trading tool that gives you the chance to back test how effective (or not) an indicator or EA might be. You may ask what an EA is, since I’ve already mentioned it more than once.
What is an EA
An EA, or Expert Advisor, is a series of coded instructions that tell your platform how to use one or more indicators. There can even be instructions to have the platform trade automatically for you…like a robot.
The first thing we’re going to do is open a chart; we’re using the EUR/USD for our example; however, you can use whatever pair you’d like. See the picture below.
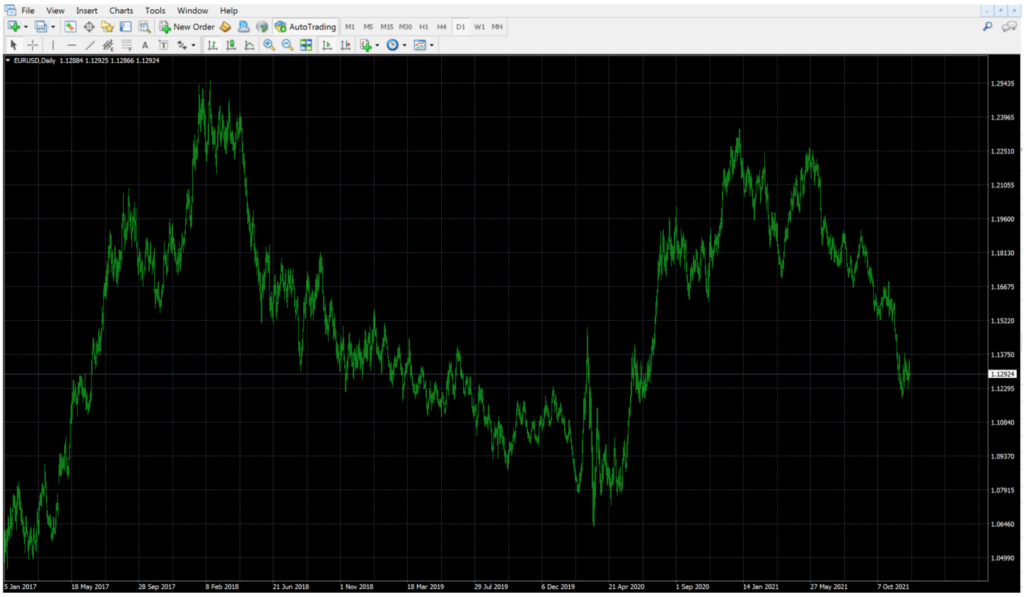
Here are some close up screenshots of the chart settings.
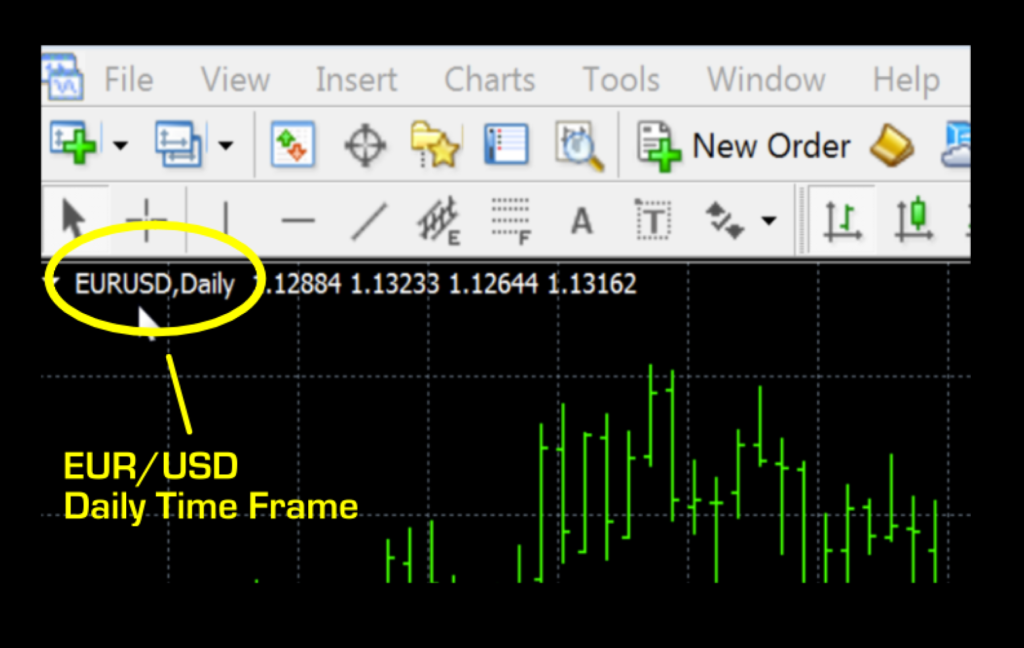
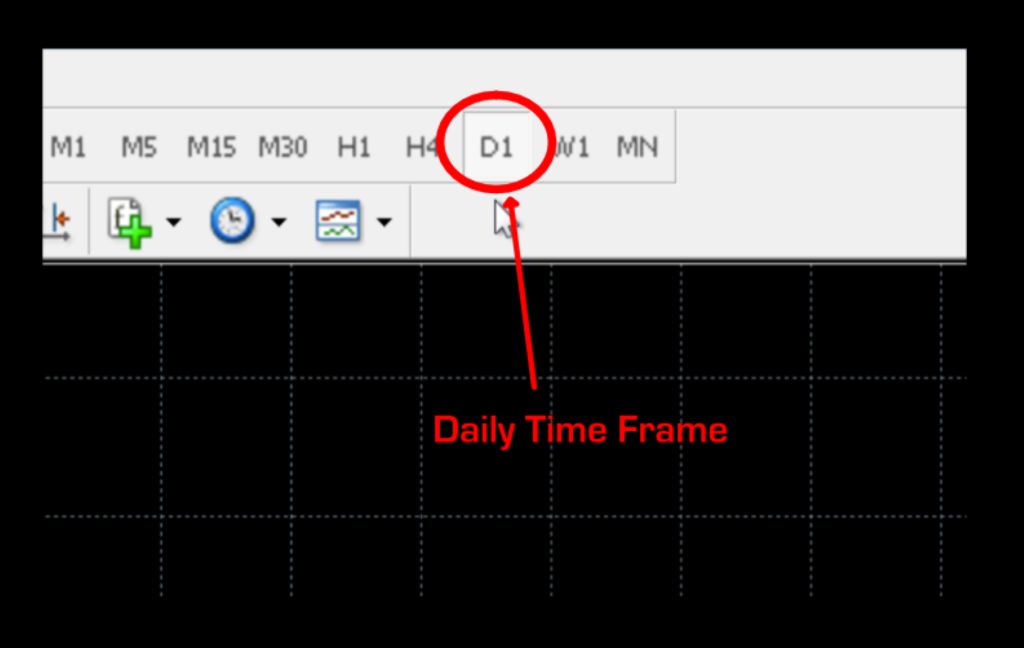
If your chart is not on the daily time frame, please make sure to do so by clicking on the “D1” button in the top banner. The chart defaults to the bar chart setting. That’s fine since we’re not really concerned with what’s happening on the chart.
Now that we have a fresh chart open on the daily time frame, we’ll open the strategy tester. This can be done in a couple of ways. You can click on the button with the magnifying glass (see the image below).
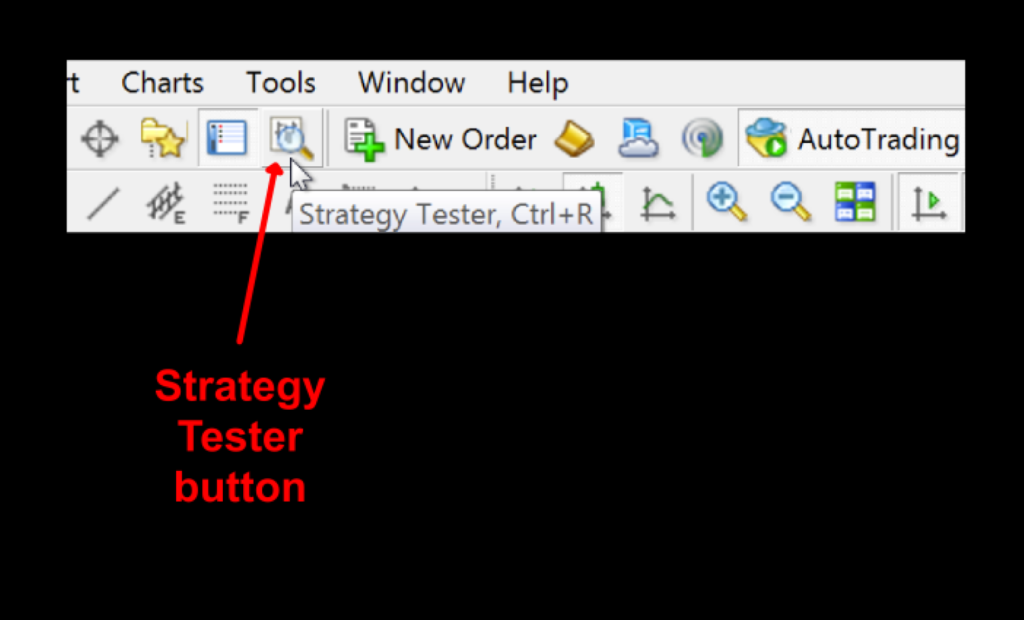
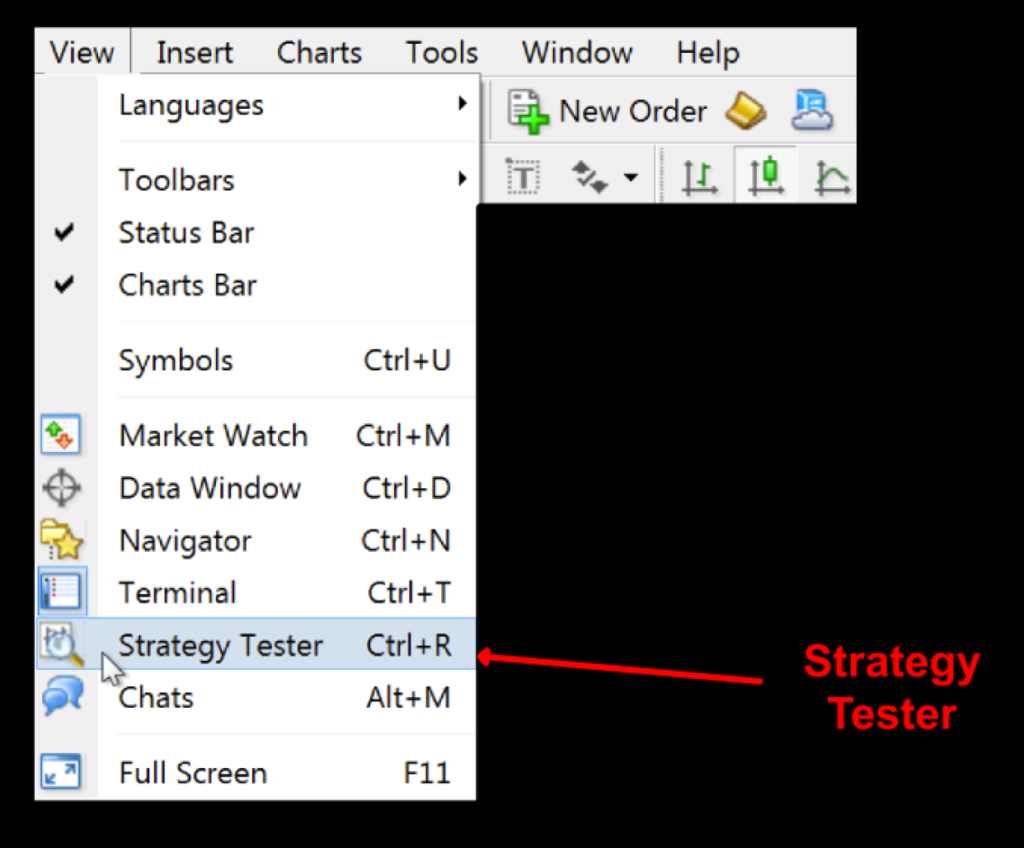
Or, you can click on the drop-down menu under “View” then click on “Strategy Tester”…or you could just use your keyboard by pressing Alt-R on a PC or Control-R on a MacBook.
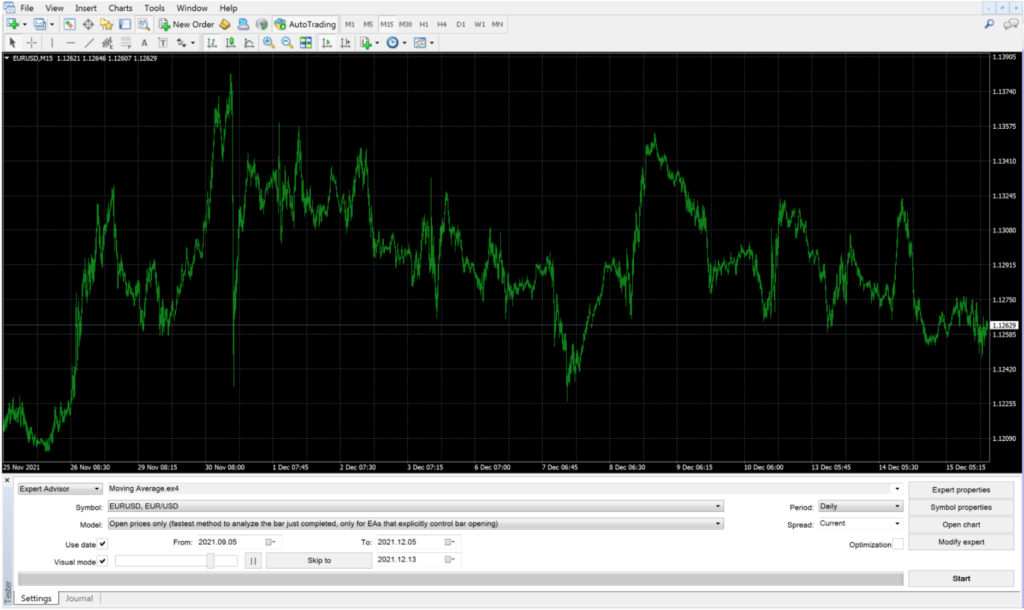
Your screen should now look like this…
We’re going to add the EA and set the basic testing values, explaining what each one does. We’ll be showing close up images for ease of viewing.
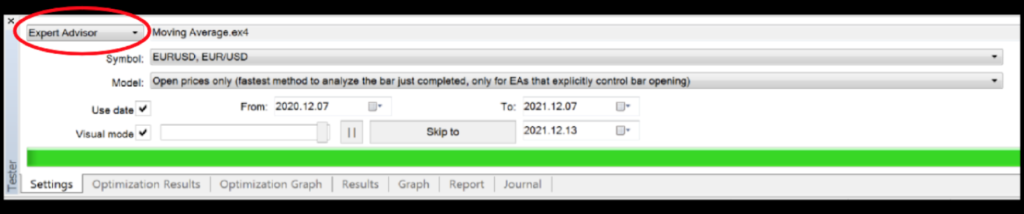
On the strategy testing window, click the drop-down menu and choose Expert Advisor.
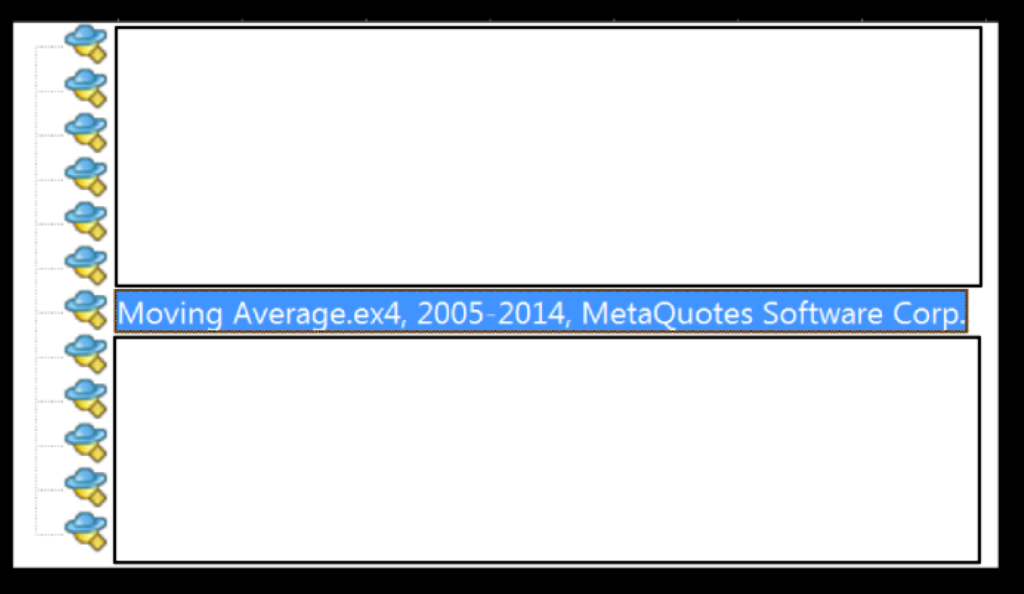
You will be presented with a list of Expert Advisors. Highlight the one that says, “Moving Average” and press return.
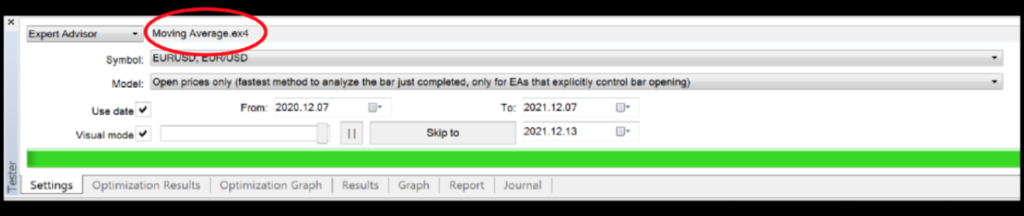
Now that you’ve selected the Moving Average EA, it should show up in the selection field.
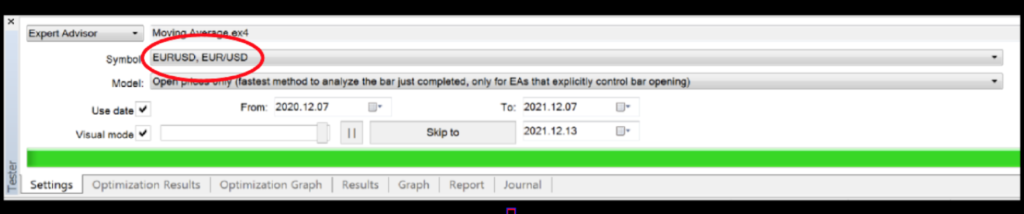
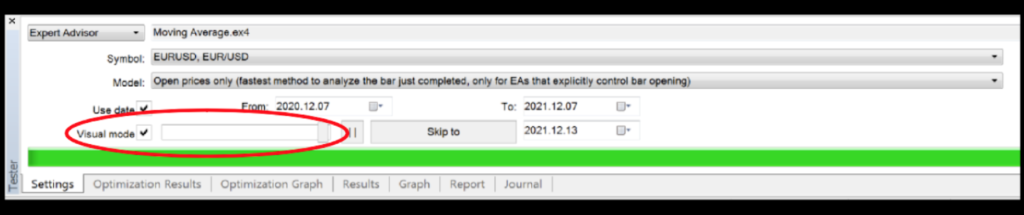
Next, make sure you’ve selected the currency pair you want to test. In our test, we’ve selected the EUR/USD.
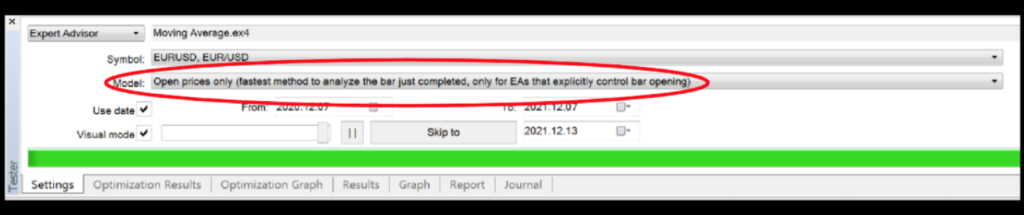
Then, you’ll want to choose your data set. There are three choices:
1. Open prices only (fastest)
2. Every tick (most accurate, but very slow)
3. Control Points (least accurate)
For our testing, we’ll use “Open Prices Only” which will give us a good idea how our EA performs.
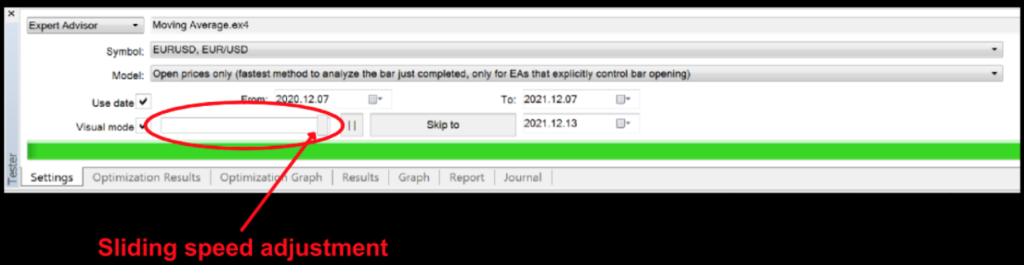
Now, you will set your date range. For testing the daily chart, we suggest at least a year’s worth of data to get a good sense of how the EA, or indicator, will react to recent market conditions.
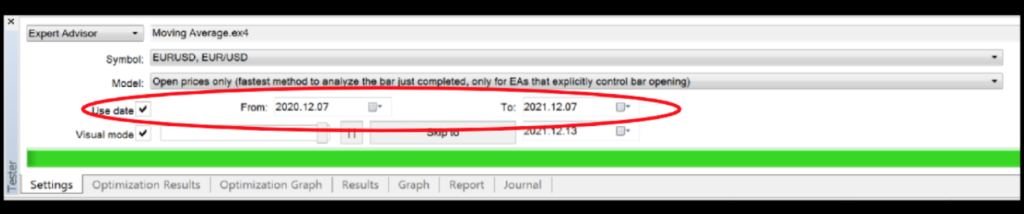
Be sure you “check” the visual mode, so you can watch the chart print when you are testing the EA. It isn’t required, but it can be helpful to see how the EA is reacting to price.
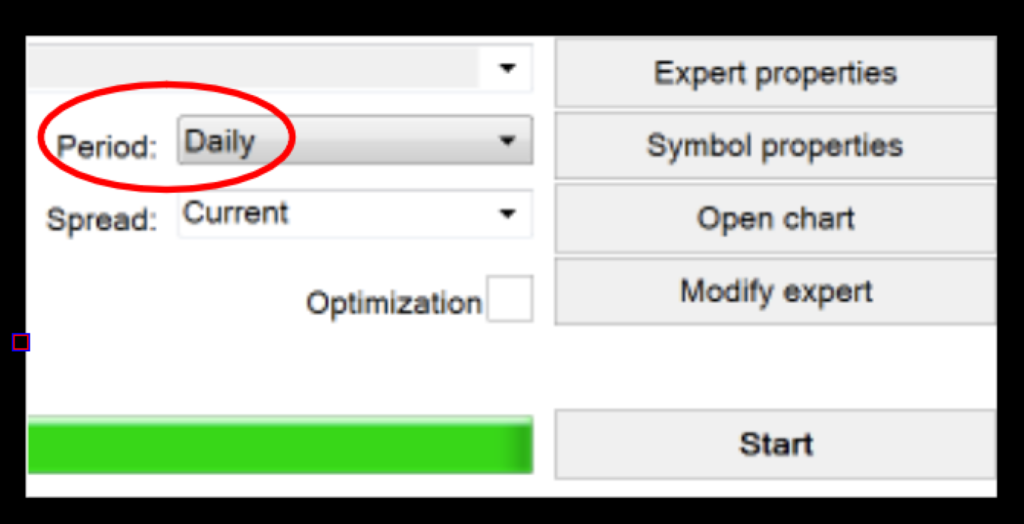
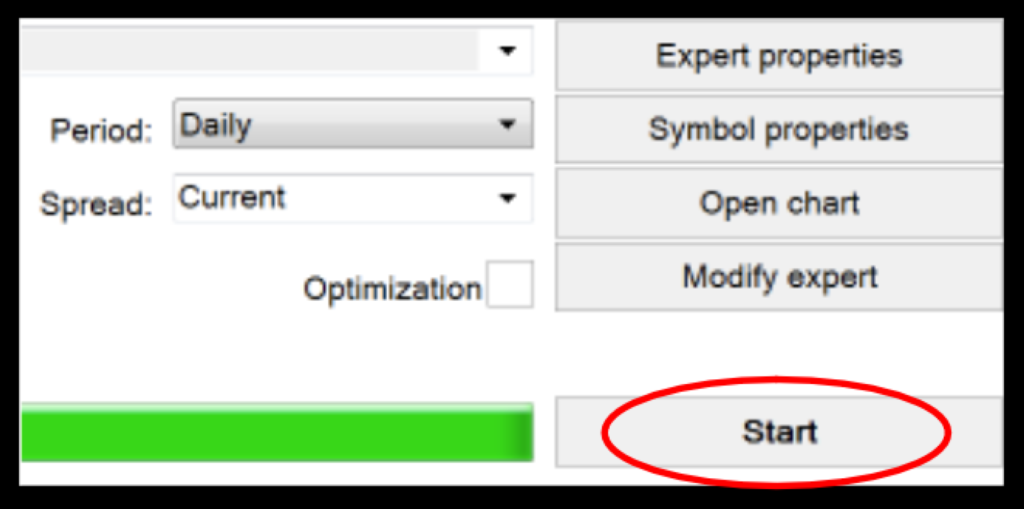
The next choice is the period. This can range anywhere between 1-minute and monthly. We are using the daily time frame, so we click on the “Daily” time frame selection.
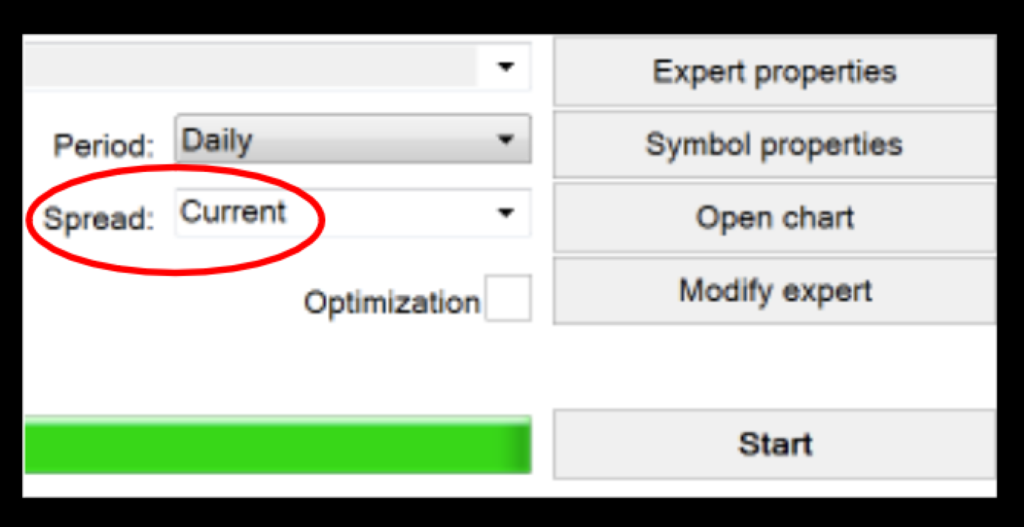
Leave the spread on “Current”.
“Expert properties” opens a separate window where we will explore the various settings. For the moment, ignore the three tabs below it. You won’t need them for our testing purposes. Don’t concern yourself with the optimization button just yet. We’ll get to that shortly.
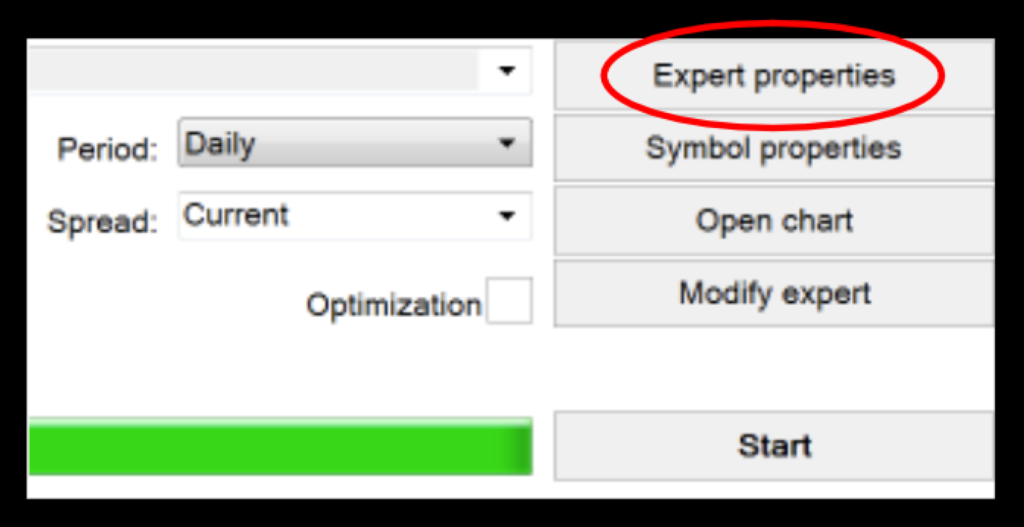
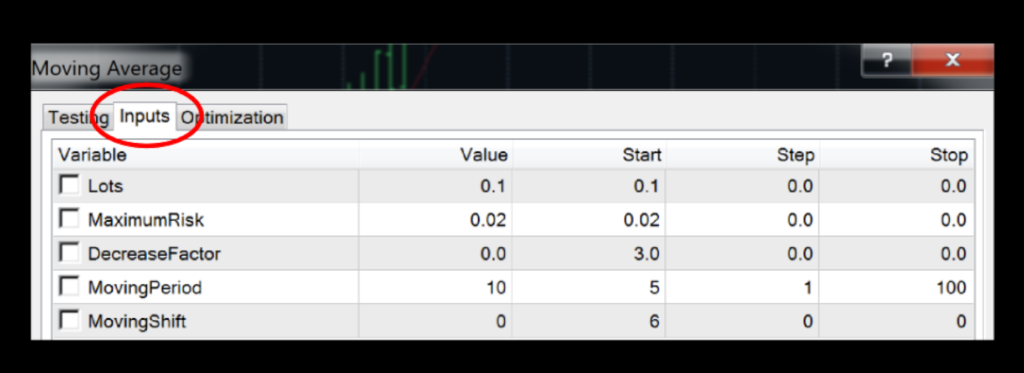
Once you click on the “Expert Properties” tab, it will open the window with the settings which can be changed.
There are two other tabs; Testing and Optimization. We won’t need to make any changes to those tabs at this time.
Below, you can see five variables whose values can be changed;
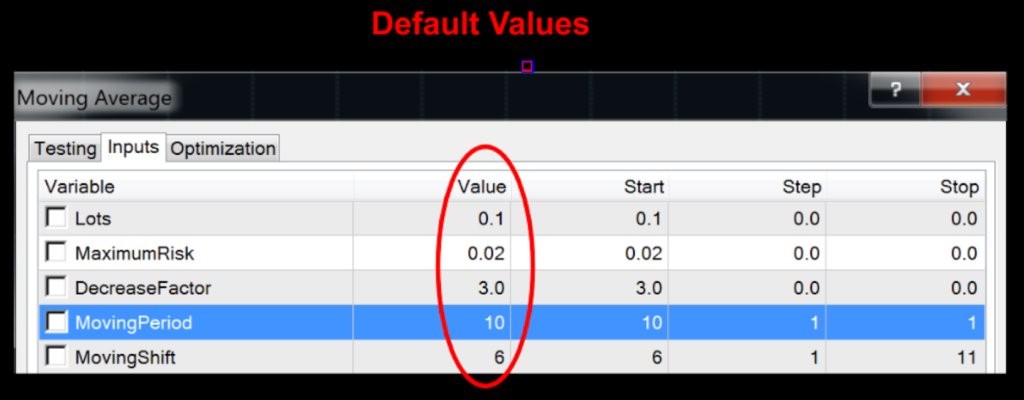
1) Lots – the size of your trade. The default is 0.1, or 10,000 units.
2) Maximum Risk – the amount of risk as a percentage of your account. We suggest no more than 2%, so you can leave this alone.
3) Decrease Factor – This is a setting which governs the reduction of working volume of the deal after an unfavorable outcome. If you don’t care about the effect of a soft landing, this function can be disabled. The default value is 3.0, but you can change it to 0.0, if you chose.
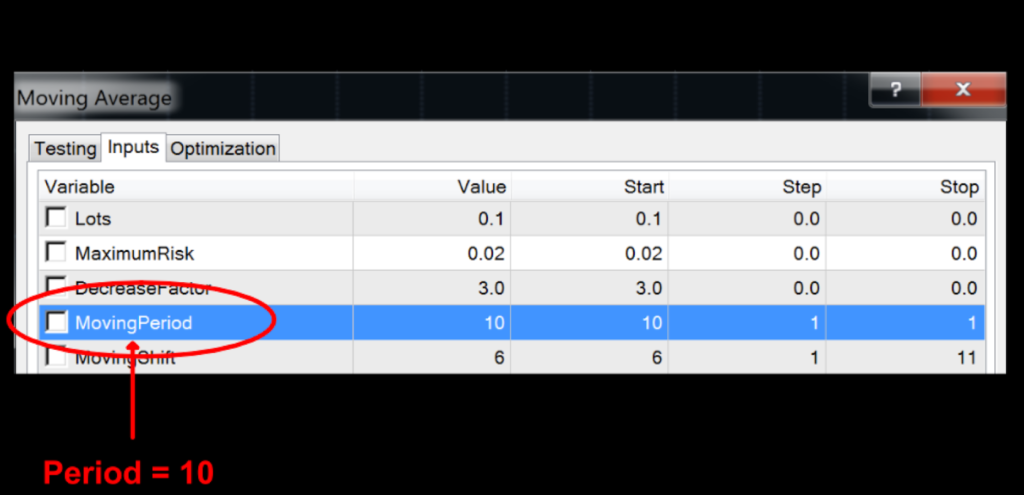
4) Moving Period – The number of periods. The default value is 10. For our testing purposes, this will be the only variable we’ll be experimenting with.
5) Moving Shift – This is the number of periods you can shift the moving average line forwards or backwards. We don’t advocate shifting moving averages, so we won’t be using this variable. Change this to zero.
Once you change the settings, your screen should look like this:
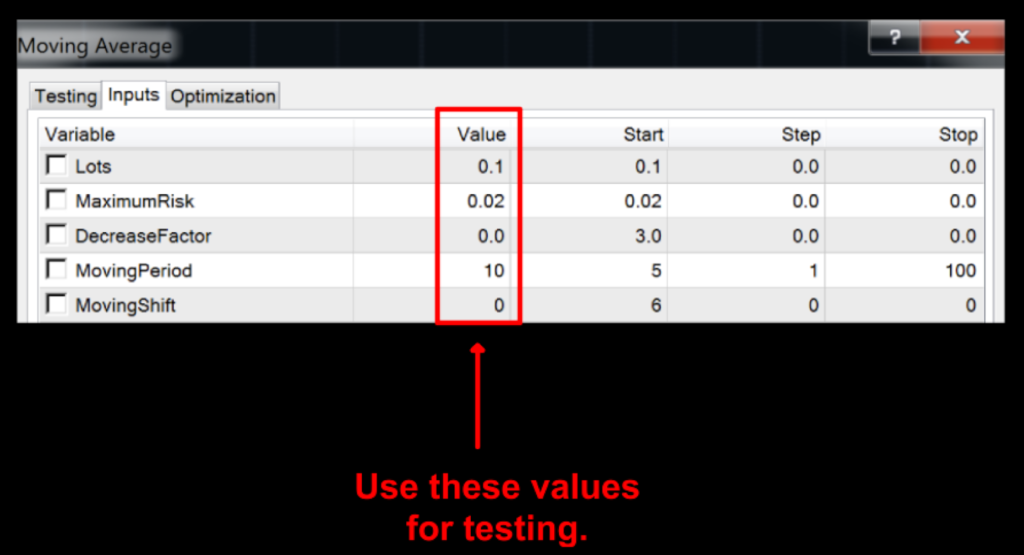
Now we’re ready for our first test using our default values. Let’s see how well the moving average does. Go ahead and press start.
Once you press start, the strategy tester will begin to pull the necessary data, and you’ll see this screen. It only lasts for a few seconds, then your chart will start printing out.
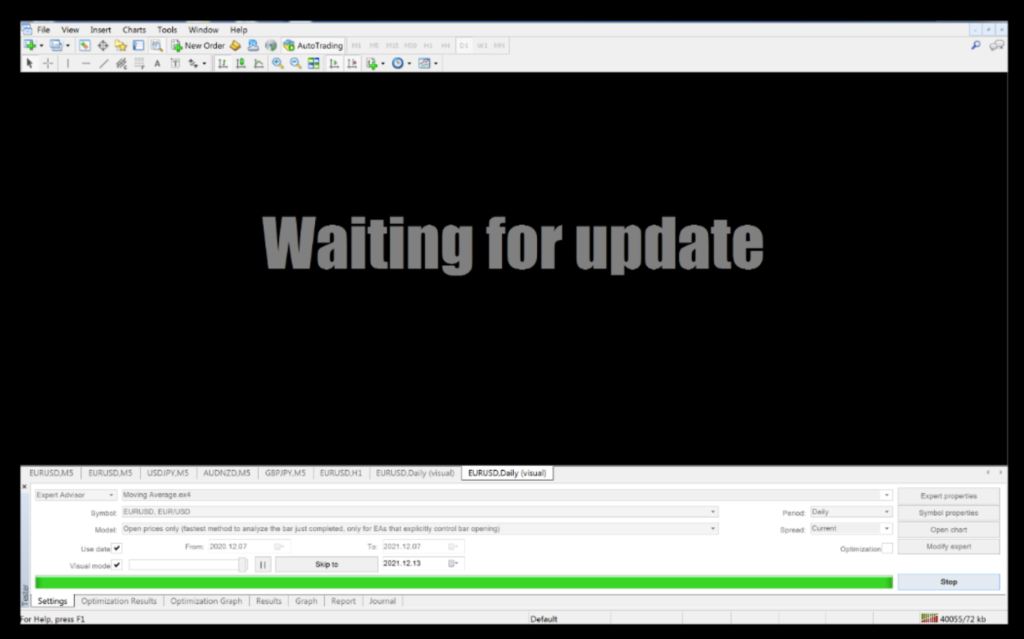
Depending on the speed setting of the chart, you can watch as the chart prints out and trades open and close as it reacts with price.
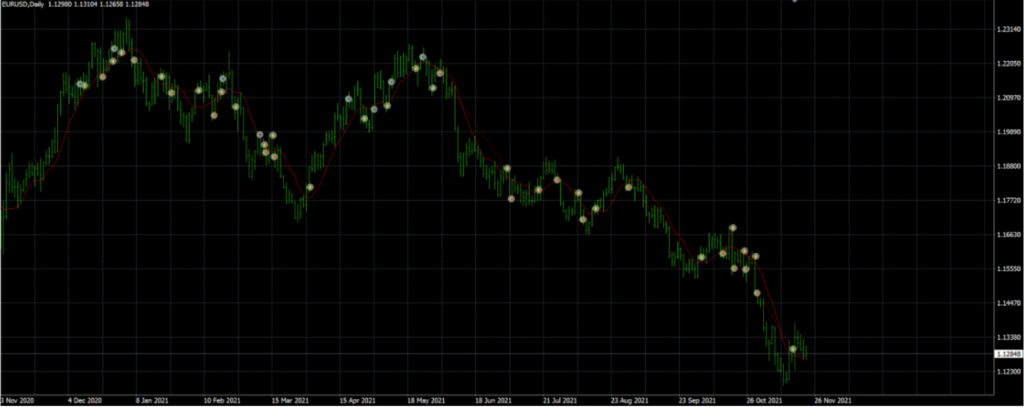
Once the test is finished, it will look like this.
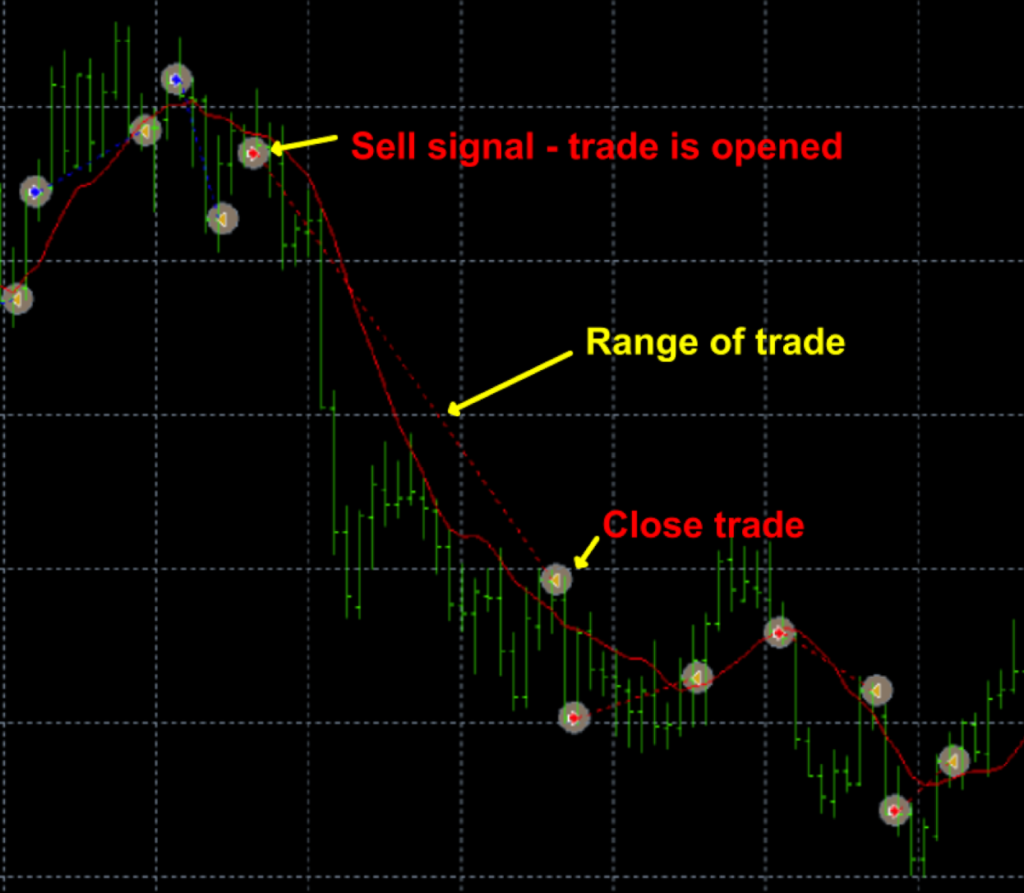
A close up of what the chart prints out looks like this. Note that you can see where a trade signal is created, closed and the range of the trade as noted.
So, How Did We Do?
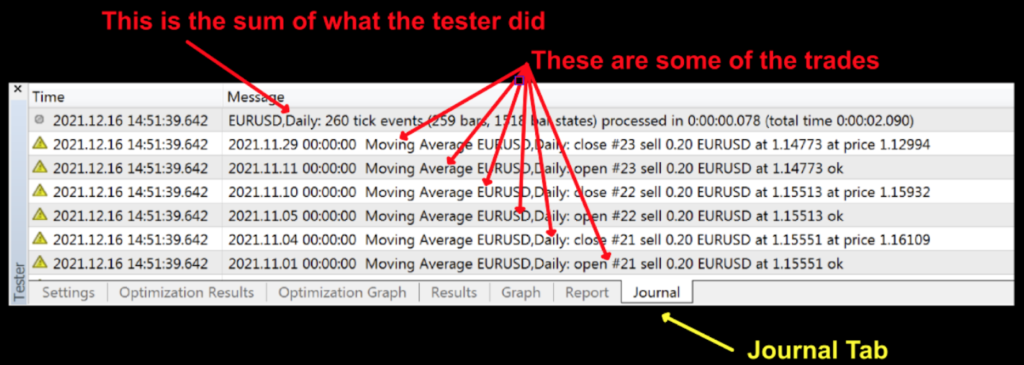
Let’s take a look at the various tabs below to see the data the tester produced. The first one we’ll look at is the “Journal tab”. The journal provides a list of what tasks the tester performed.
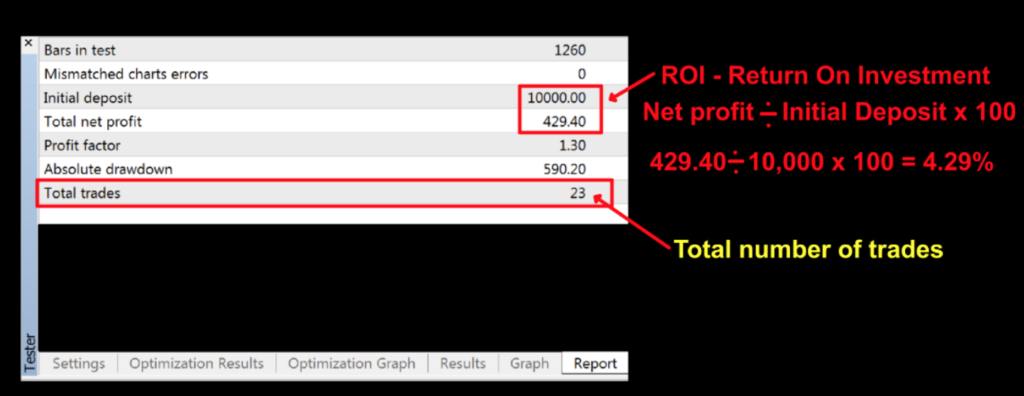
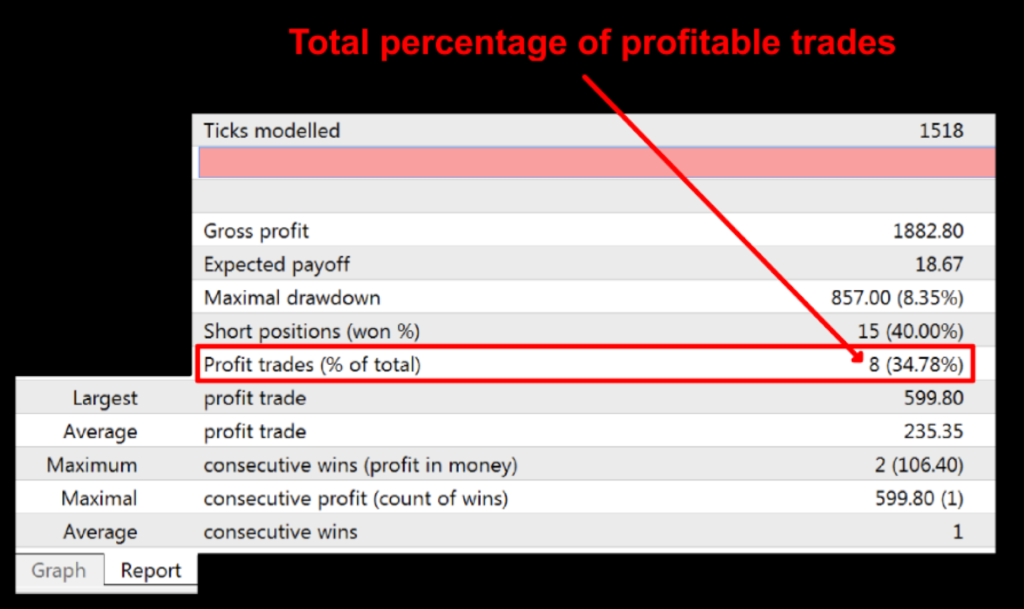
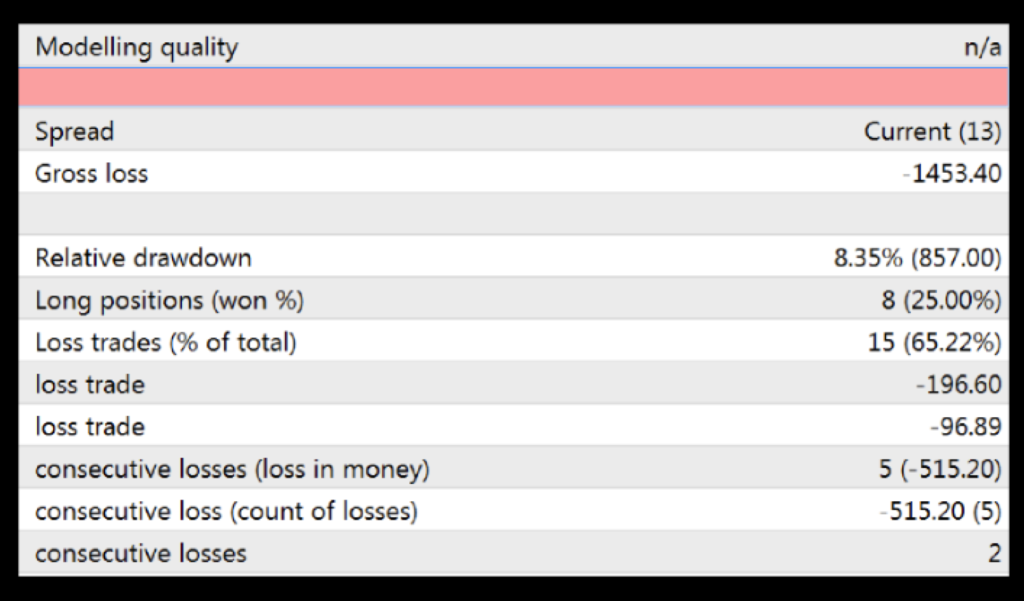
The next tab is the “Report tab”. This is where we find how the EA performed. We’ll break it down into three screens and highlight the main three metrics we usually look at to determine if an EA (or indicator) is effective. There are other metrics you can use, such as drawdown (we suggest no more than 10%), but feel free to use as many as you want.
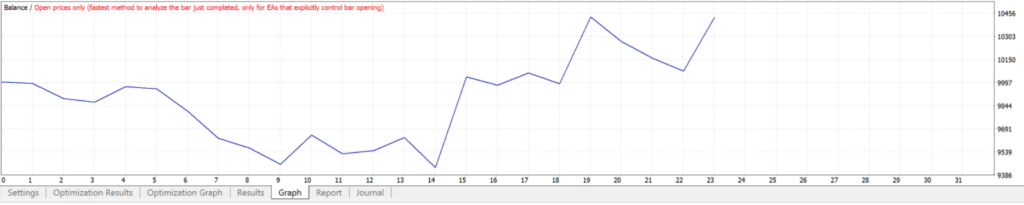
Next, we’ll look at the graphing function of the strategy tester. A quick look at this graph tells us that the EA does produce a profit.
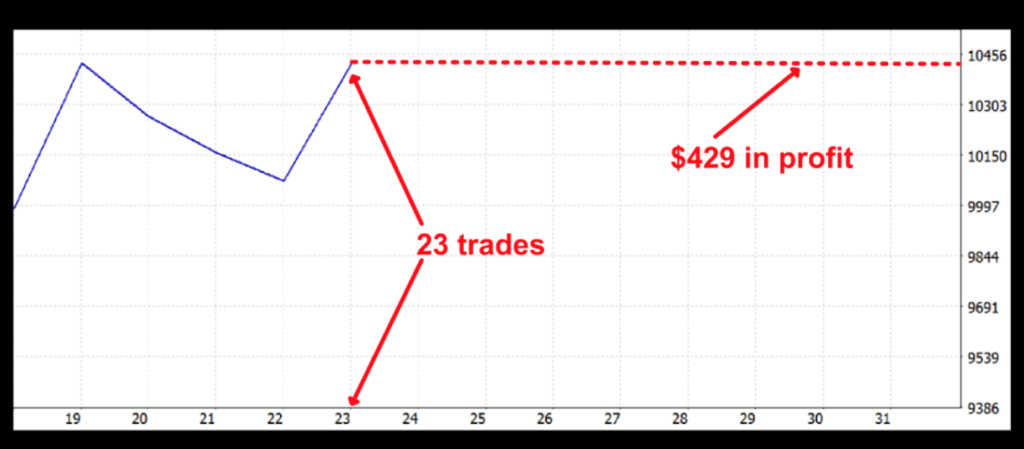
A close up shows us that we had 23 trades during the testing period with a net profit of $429.
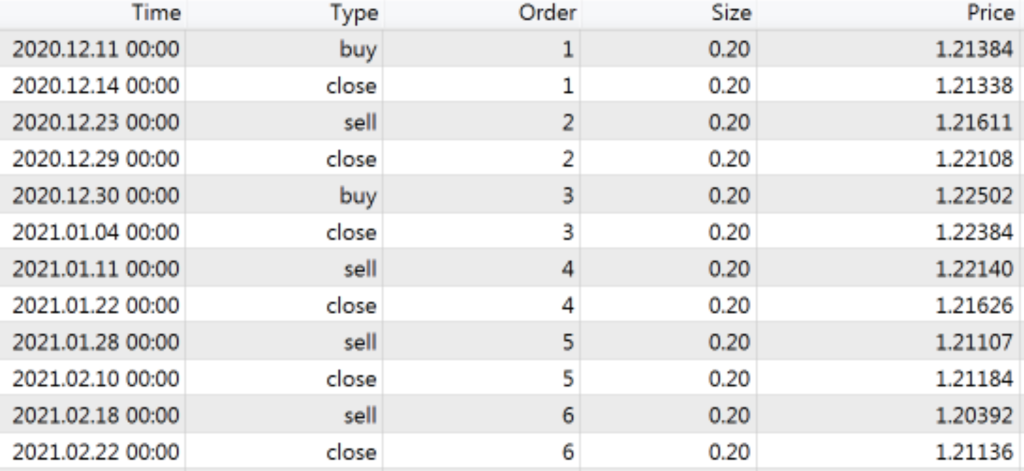
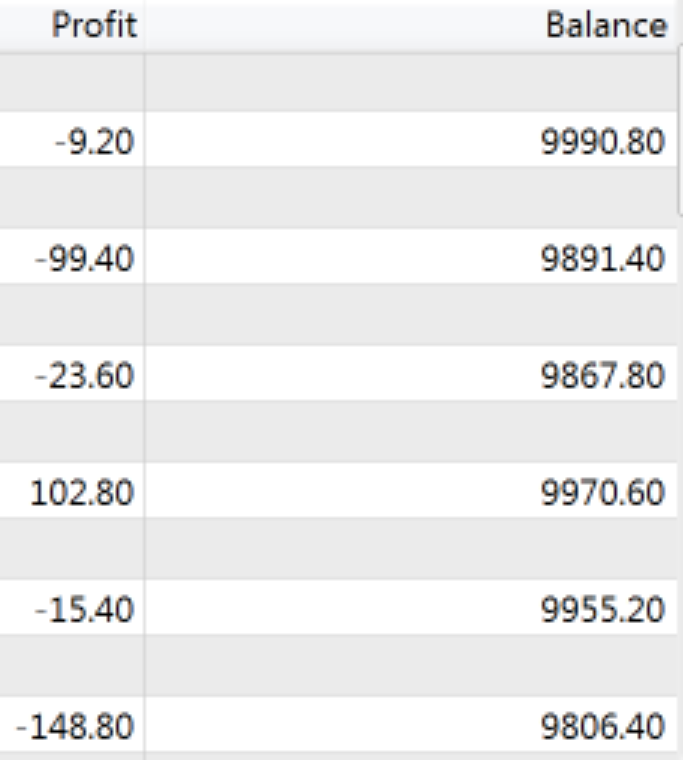
The “Results” tab is a listing of each trade with date & time, type (buy/sell), size, and other position information.
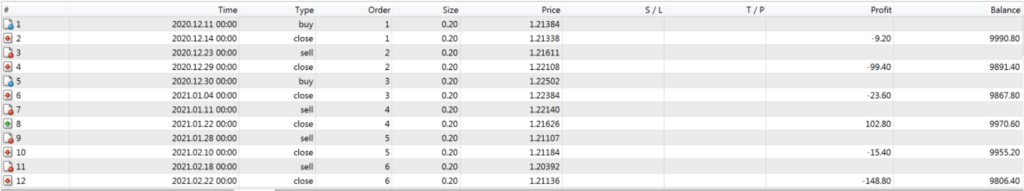
Here are a couple of screenshots for closer inspection.
Optimizing
There are two more tabs; Optimization Results and Optimization Graph. The optimization function of the tester permits us to quickly test multiple values to see what works best. We’re going to ‘optimize’ the moving average period setting, returning the best possible results.
***Caution – you should be aware of a trap called “CURVE FITTING”. Curve fitting results when you adjust the indicators so much that they “fit” price for the best possible signals. While this can be helpful if the market remains the same, the market is *dynamic*, meaning that it is always changing. Optimizing is a tool to help us find more accuracy…but always keep your eyes and your mind open. You can read more about curve fitting HERE.
Let’s do This
Now that you know what the optimizing feature is on the strategy tester, let’s try it…
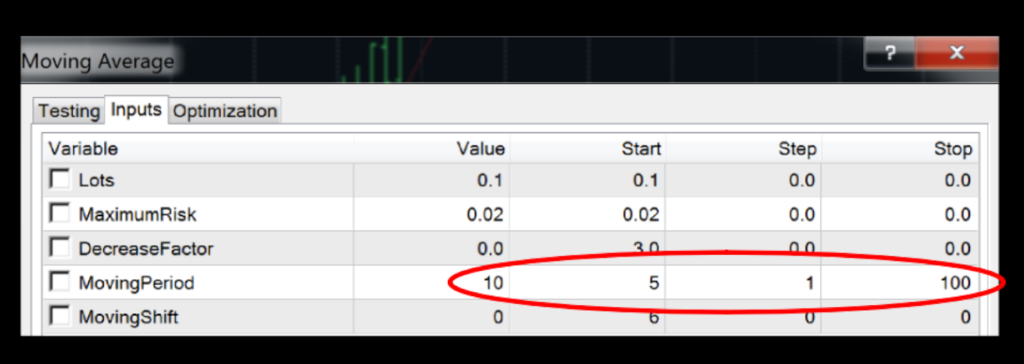
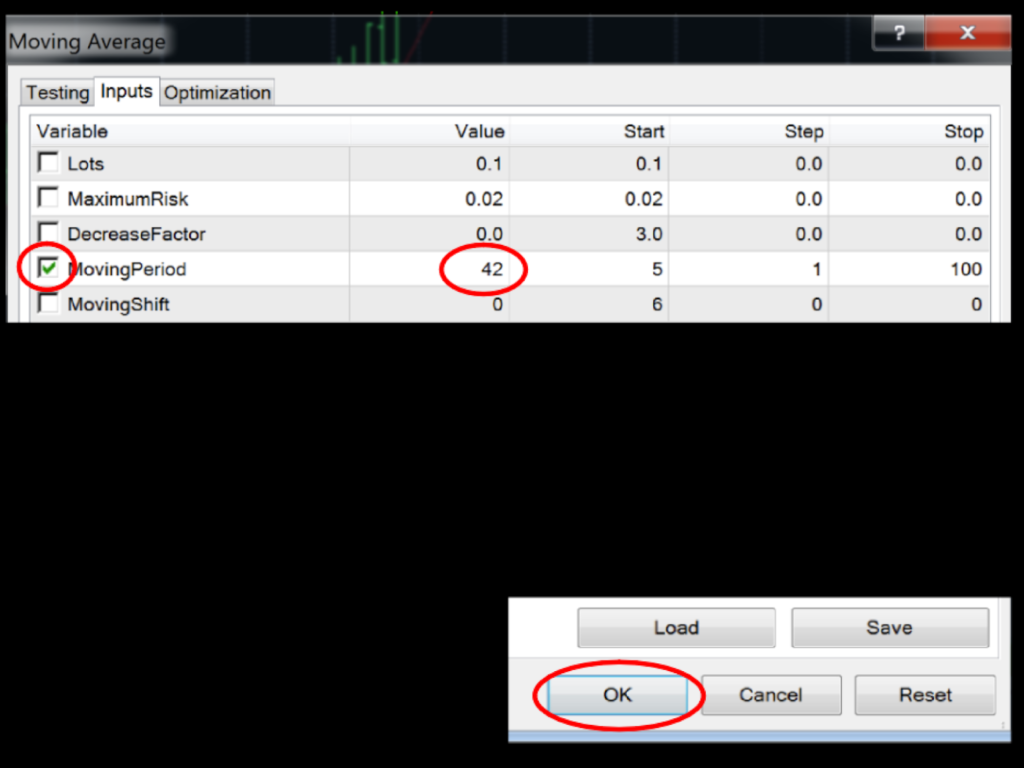
First, click on the “Settings” tab at the bottom of your screen so the variables menu appears. Make sure you are on the “Inputs” tab.
We are going to only change the values of the moving period. The number 10 under “Value” is the current moving average setting. We can leave that alone.
Start – the beginning value of the optimization process. This can be any number you want (whole number or decimal), but we’re going to start with 5.
Step – the size of the interval between testing. It can be a whole number; i.e., 1, 2, 3, 4…or 5, 10, 15, 20…or a decimal such as .1, .5, .8, etc. For our testing purposes, we’ll use whole numbers and increase each pass by a value of 1.
Stop – this is the last value of the testing series. We’ll use 100 for our test.
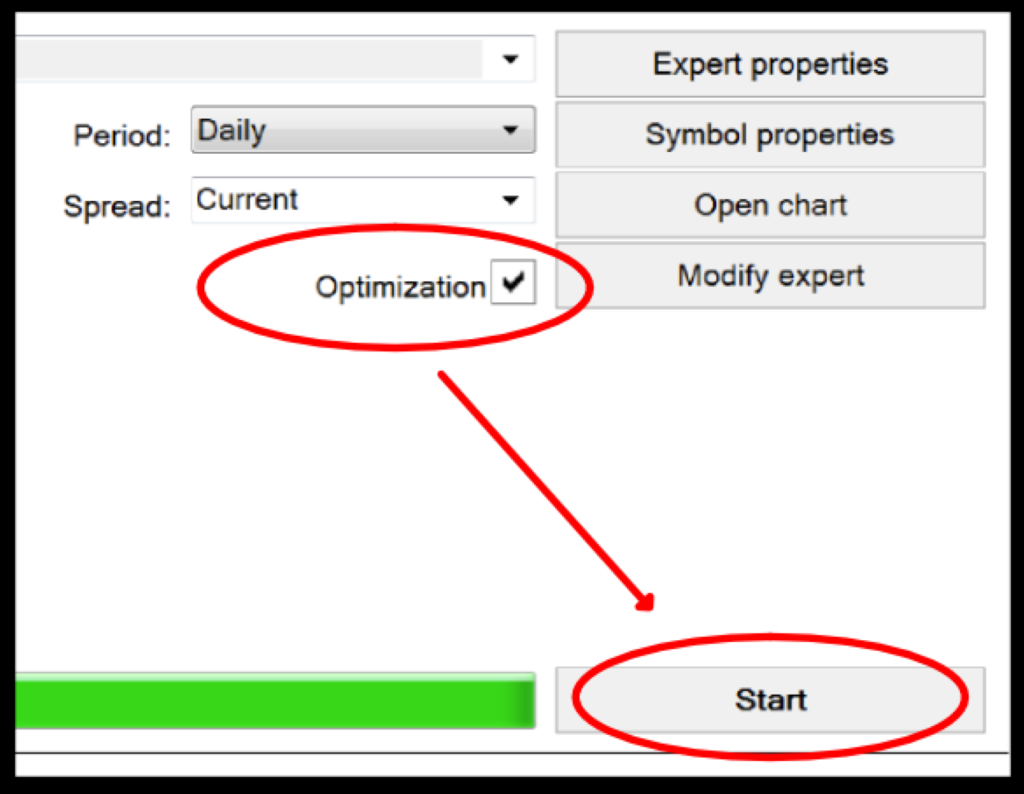
Make the appropriate changes to the moving average, click on the box to get a “check” mark, then click okay.
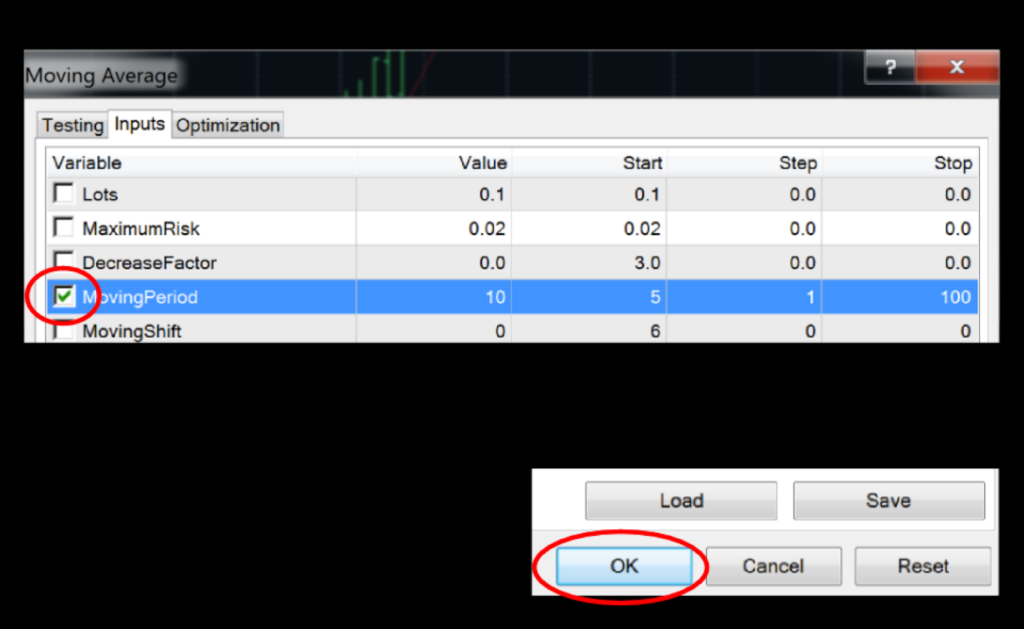
Click on optimization, then START.
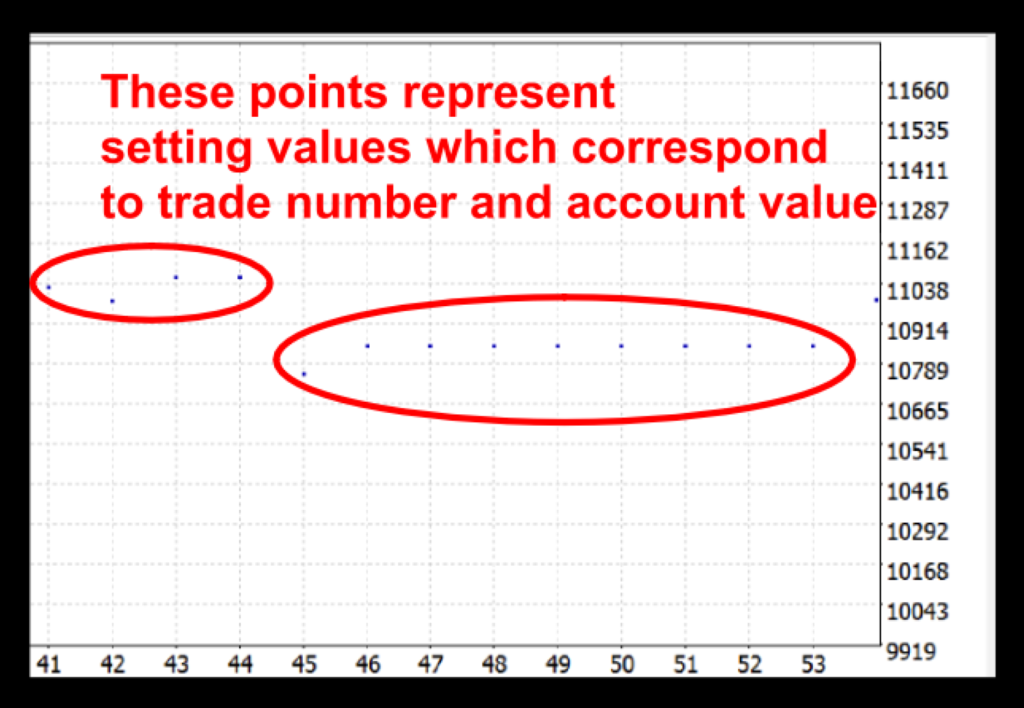
After the optimization is complete, you can review the data using the Optimization Graph. This graph plots data points based on the information it receives.
By clicking on the Optimization Results tab, you can get your results and sort them by maximum profit.
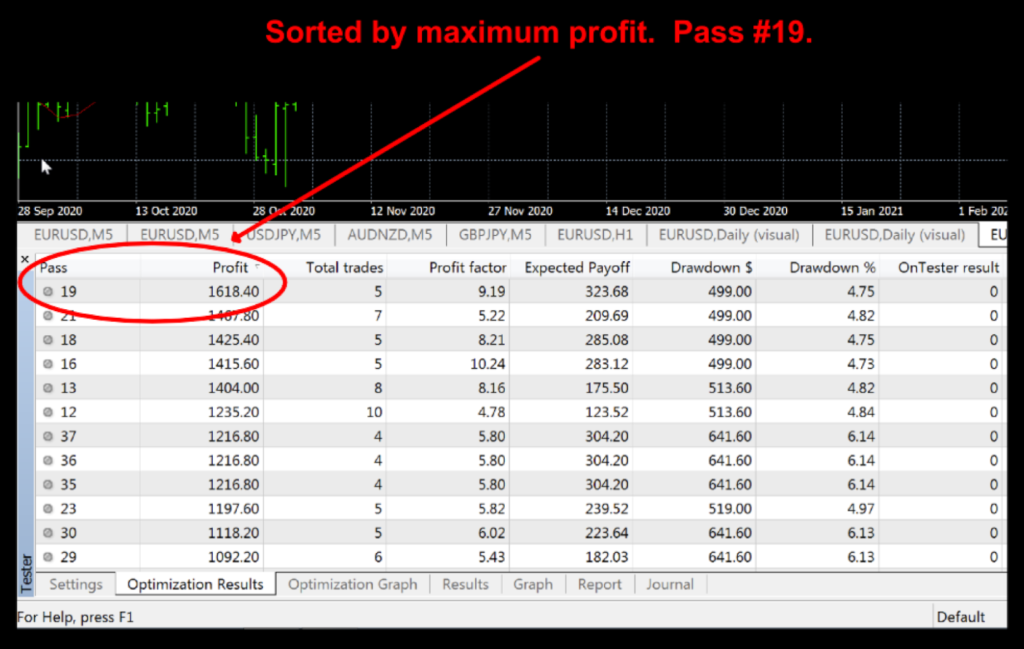
Looking across the row, you can see that the most profitable value for the Moving Average Period is 42.
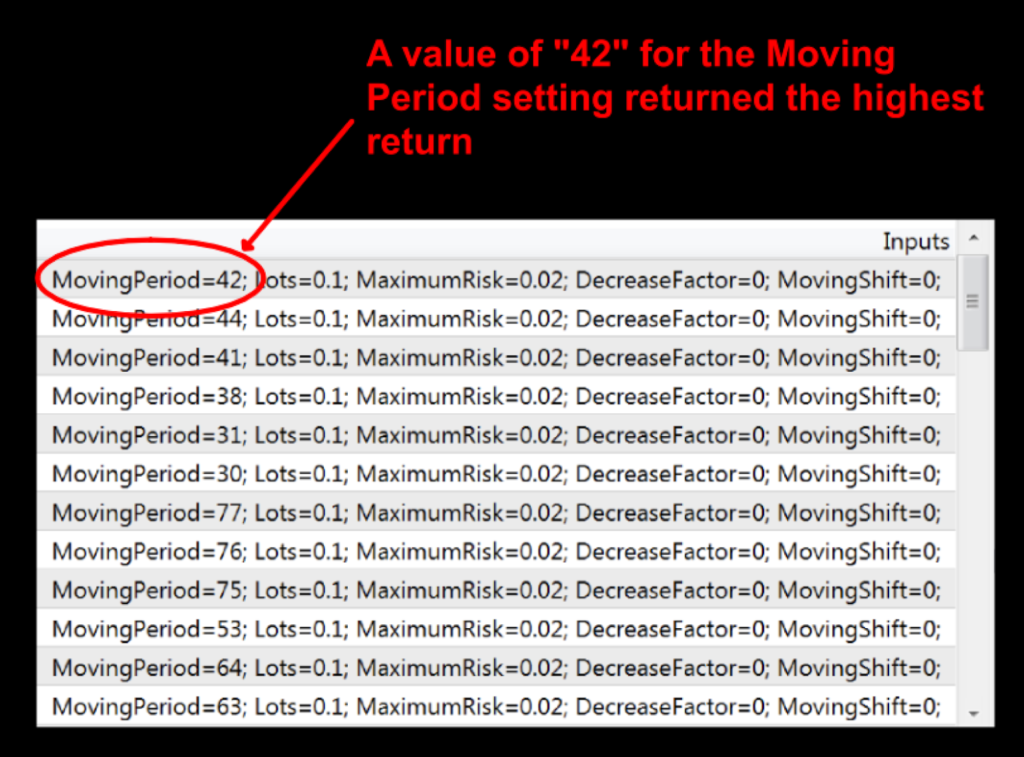
Now that you have this information, you can go back into the Expert Settings tab on the right side and change the value of the Moving Period to 42. Be sure to unclick the box, then press OK.
Now, you’ll need to unclick the Optimization button and re-click the Visual mode box, then press Start.
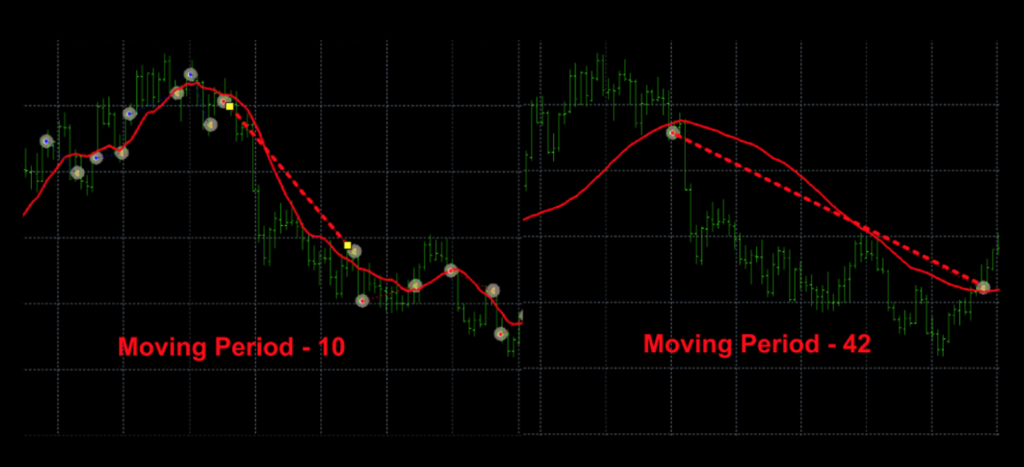
Once the strategy tester re-runs the EA using your optimized setting, you can verify the results by looking at the report and the graph. You can even toggle between the charts to see what the differences are between the setting values. Below is a side by side comparison of the default value and optimized value to give you a sense of what they look like.
Last Words
Everything you need to know about your test is found in the report. In an effort to keep this blog a reasonable length, there are many on-line resources where you can learn more. For more information about the report, check out this site. MT4 Report If you really want to take a deep dive into the strategy tester, check out this site: MT4 Deep Dive
Different Versions
We’ve checked different versions of MT4 and noticed there are small differences among the Moving Average EA. Overall, what we’ve described in this blog applies across all versions; however, there may be some small differences in appearances or setting options. The beauty of it is that you cannot “damage” anything during the back testing. Take this opportunity to try different values on the various settings and check graph, journal and report to compare the differences. Remember, this is part of your journey to becoming a profitable trader. Enjoy the ride!
Automation
VP put out an informative video on automation during the summer of 2021. You can watch that HERE. By the way, we talked a little about using the strategy tester, among other programs, in the Automation video on YouTube which was showcased in VP’s blog. You can watch the YouTube video on automation, by clicking on the image below.

More to Come
There’s a lot more to come. If you haven’t signed up on our contacts page or subscribed to the YouTube channel, please consider doing so to receive notifications as we continue to publish helpful, relevant, and informative Forex related material to support your quest to becoming a better trader.
Advanced Course
To learn more about trading Forex, consider taking our advanced course. Click HERE for more information.
Our only goal is to make you a better trader.
BTW – Any information communicated by Stonehill Forex Limited is solely for educational purposes. The information contained within the courses and on the website neither constitutes investment advice nor a general recommendation on investments. It is not intended to be and should not be interpreted as investment advice or a general recommendation on investment. Any person who places trades, orders or makes other types of trades and investments etc. is responsible for their own investment decisions and does so at their own risk. It is recommended that any person taking investment decisions consults with an independent financial advisor. Stonehill Forex Limited training courses and blogs are for educational purposes only, not a financial advisory service, and does not give financial advice or make general recommendations on investment.