McGinley’s Our Man
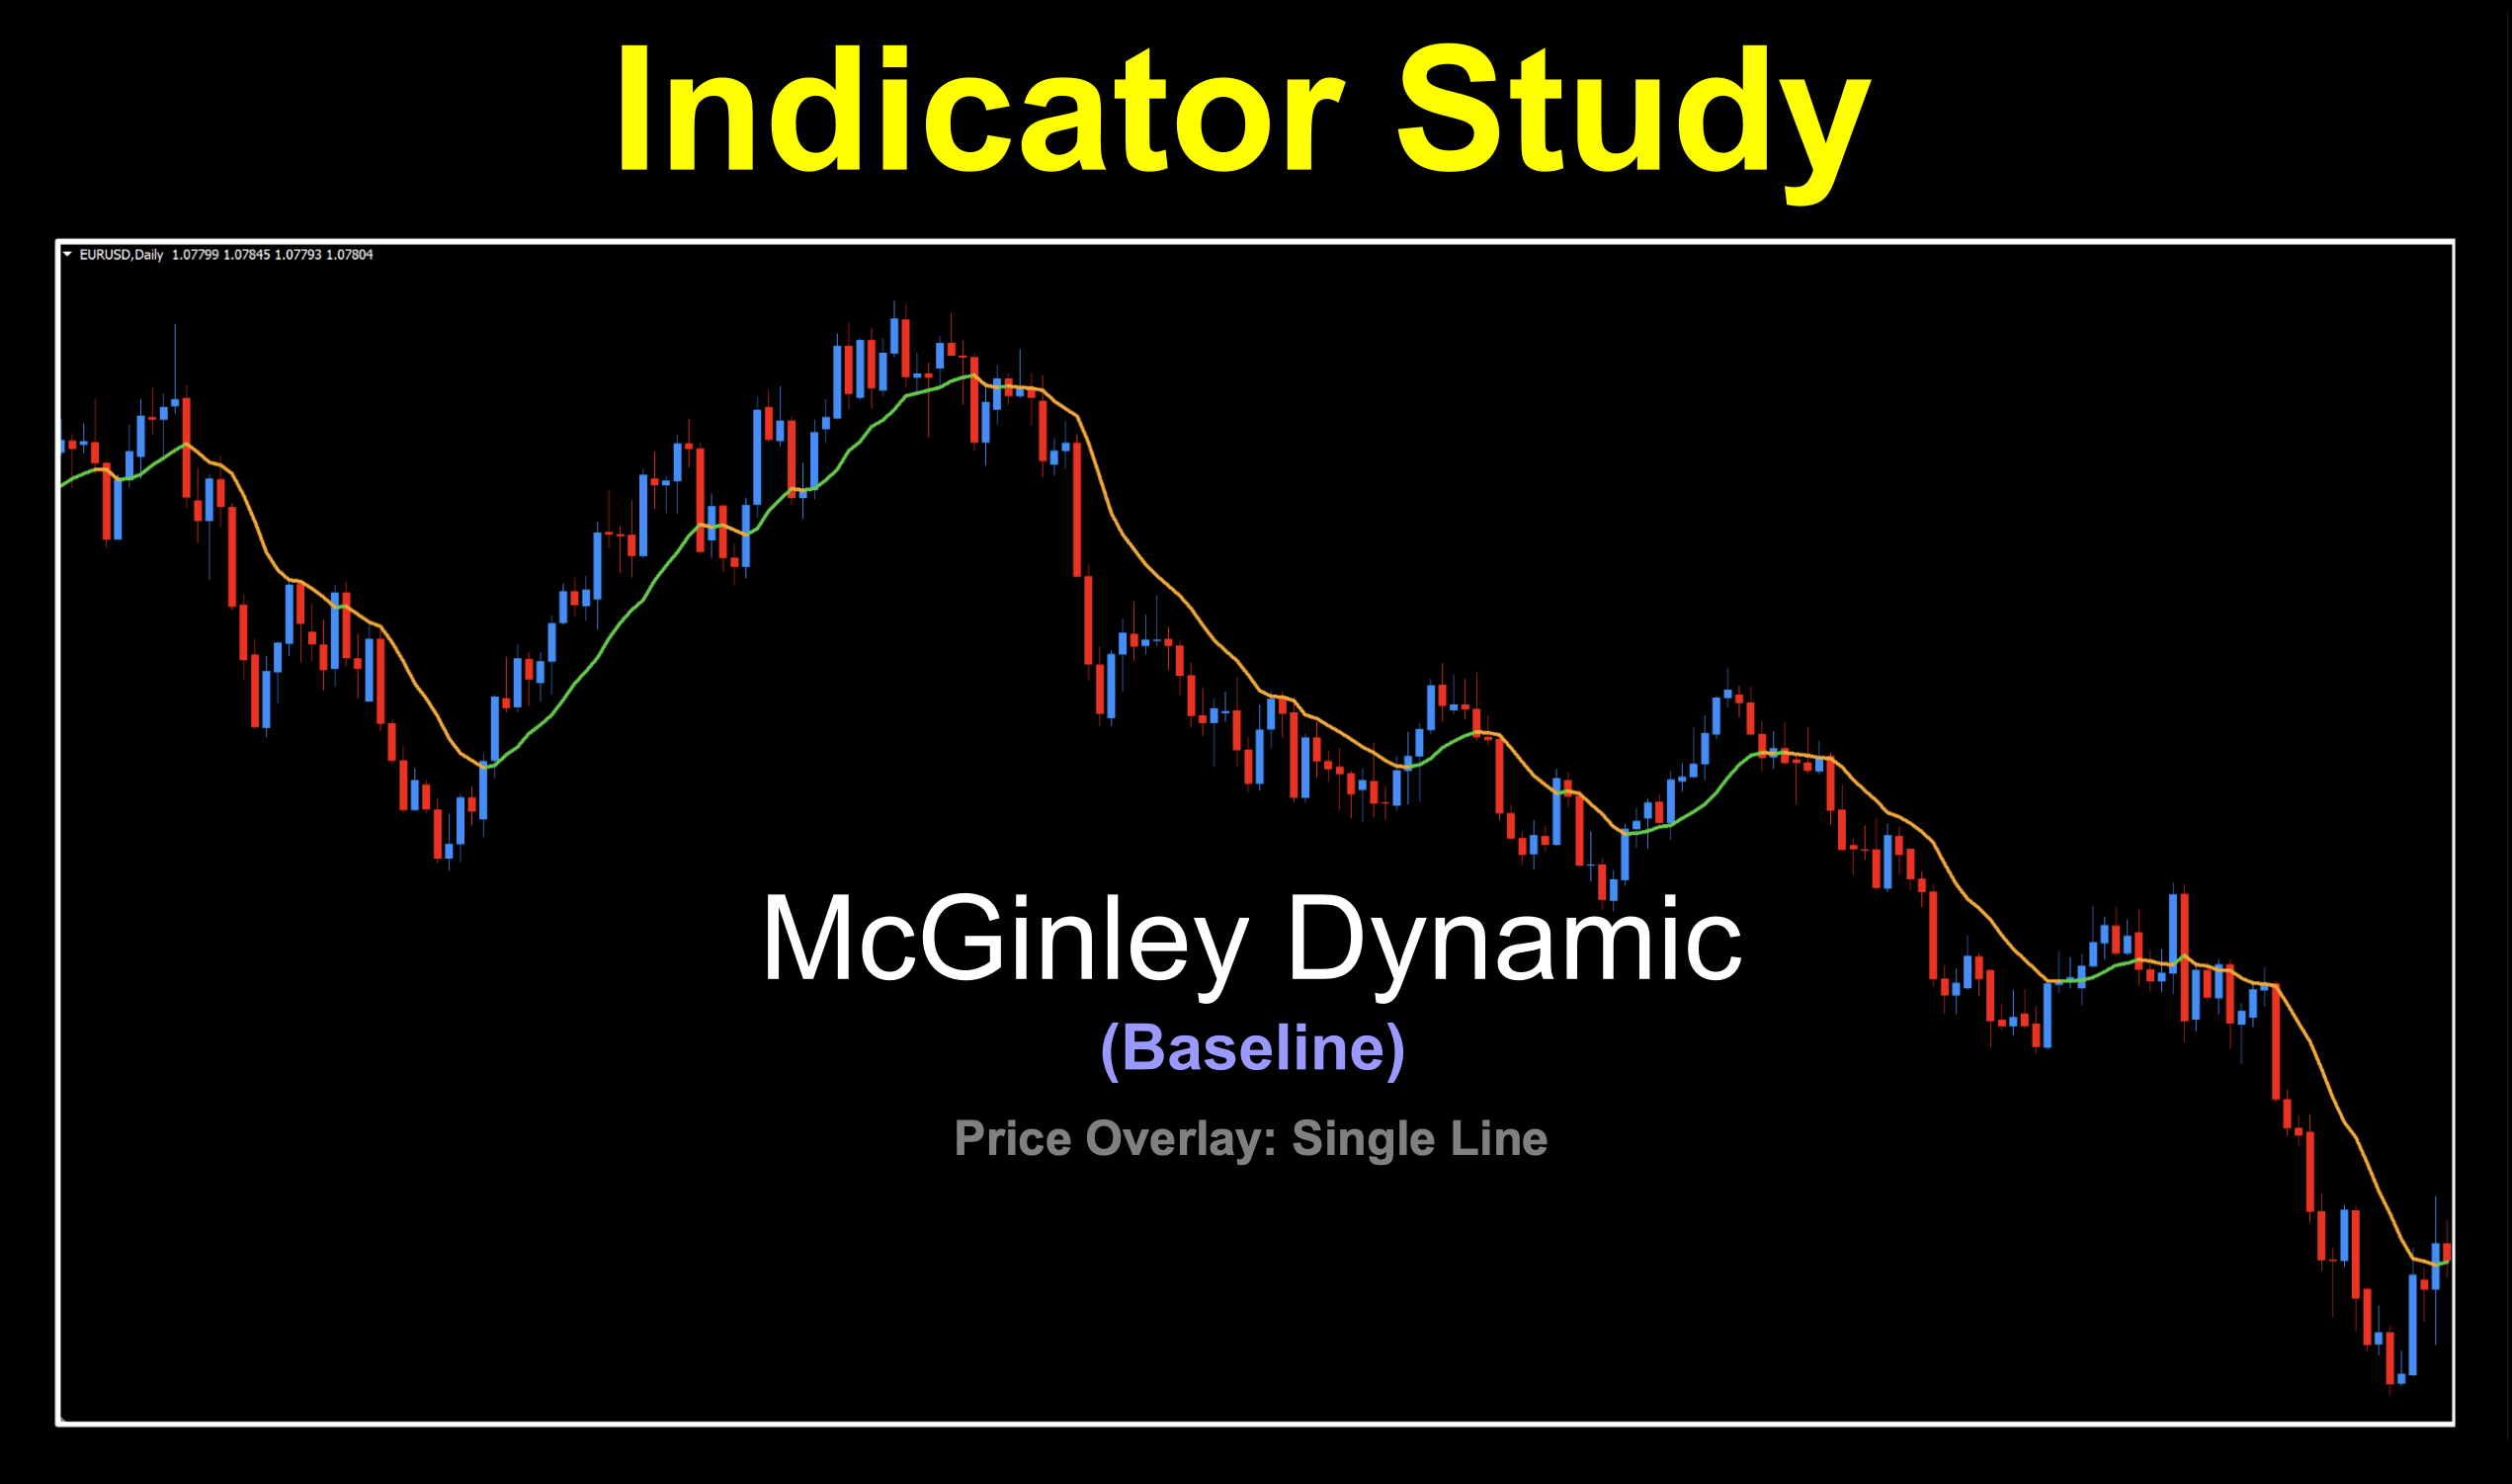
The McGinley Dynamic Indicator is our next baseline indicator choice. This indicator has been recognized as one of the most underrated and unpopular indicators. Ironically, it has also been acknowledged as one of the most reliable and functional as well, making it a great indicator for your trader’s toolbox.
While the background math may seem complicated, it really is not. A combination of moving averages, with a unique ability to speed up in bear markets and slow down in bull markets, help the trader identify better points to enter and exit the market.
History
The indicator was developed in 1997 by John R. McGinley, a former editor of the Market Technicians Association’s Journal of Technical Analysis and a Certified Market Technician. His effort was in response to designing a responsive indicator capable of adjusting itself to the market’s speed, and was first published in the Journal of Technical Analysis in 1997.
The McGinley Dynamic Indicator presents as an on-chart indicator, overlaying price (See snapshot below).
Advantages
* Clear signals without confusion
* Smooths out market noise
* Better representation of market dynamics due to adaptive nature
* Reduced lag as market conditions change
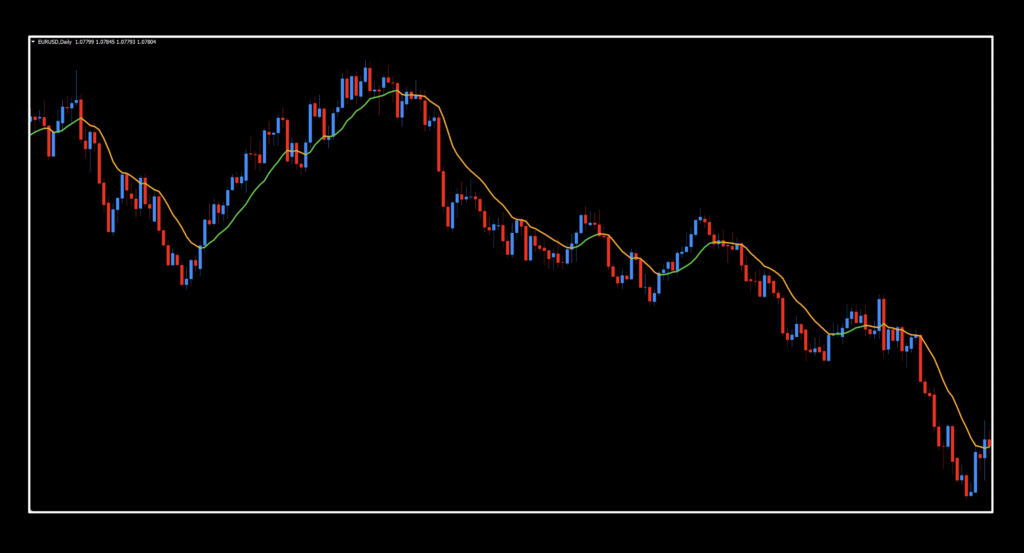
A Thing of Beauty
Below is a screenshot of what the indicator looks like on the daily time frame. We’ve brightened up the colors of the indicator to make it more visible on the chart; however, they’re the stock colors.
Settings
This tool has four settings, and we’re using them all for maximum flexibility!
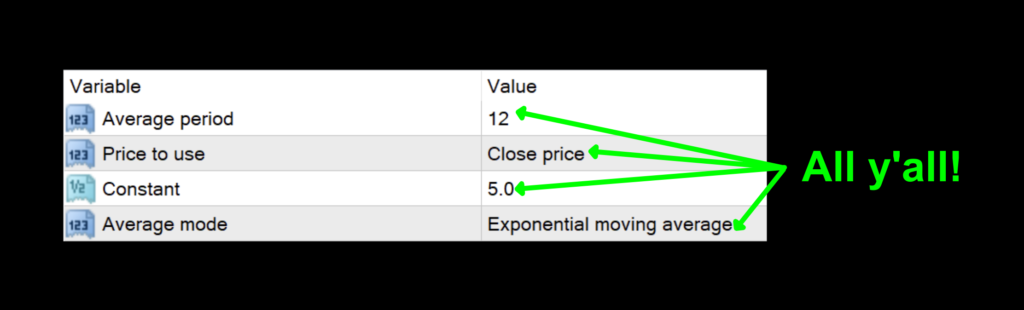
Average Period: The number of periods to calculate the moving average line. The default value is 12.
Price to Use: Close, Open, High, Low, Median, Typical, Weighted – which specific set of price points the indicator uses to calculate the resultant data and subsequent appearance of the indicator. The default value is “Closed Price”.
Constant: Defines the relationship between both Average Period and Price to Use. You can customize how the indicator is calculated with respect to the speed it reacts to both bull and bear markets. The default value is 5.0.
Average Mode: Simple, Exponential, Smooth, Linear Weighted – the manner in how data is calculated from price. The default value is the EMA.
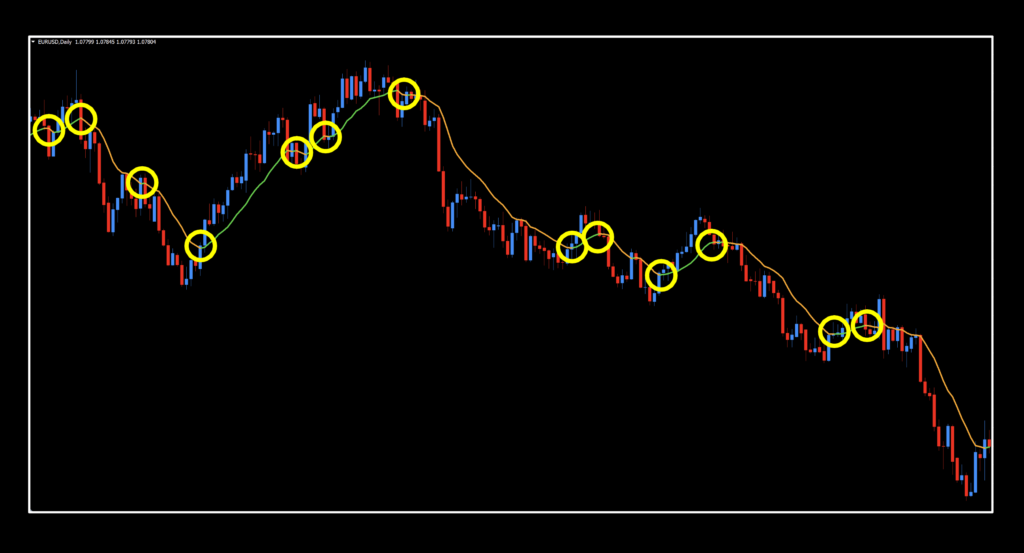
How We Use It
One of three actions need to happen in the last 30 minutes prior to the close of the trading day. They are; opening, maintaining, or closing, a position. This is when you make your trading decisions, and not actually wait for the close at 1700 EST, because we trade on the daily time frame.
Long: When the signal lines changes from orange to green.
Short: When the signal line changes from green to orange.
And the Outcome…
If you’re new to these studies, we recommend looking at some older blogs to understand how we conduct our testing.
Below are the results from our testing efforts.
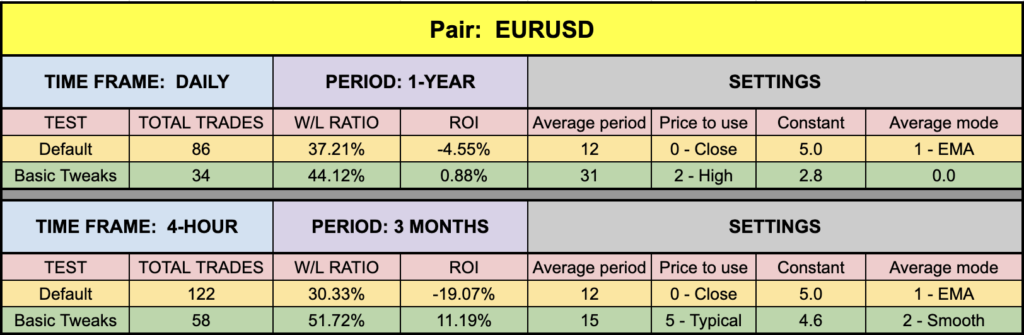
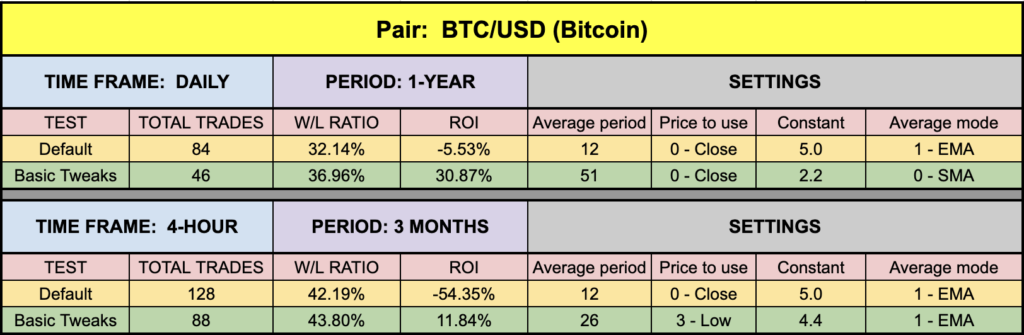
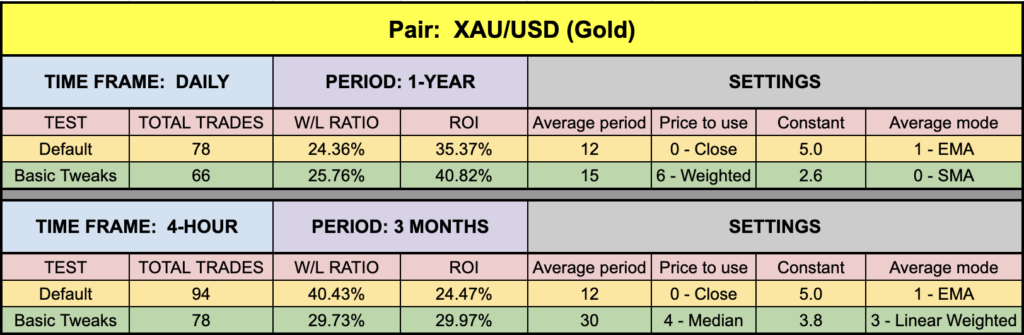
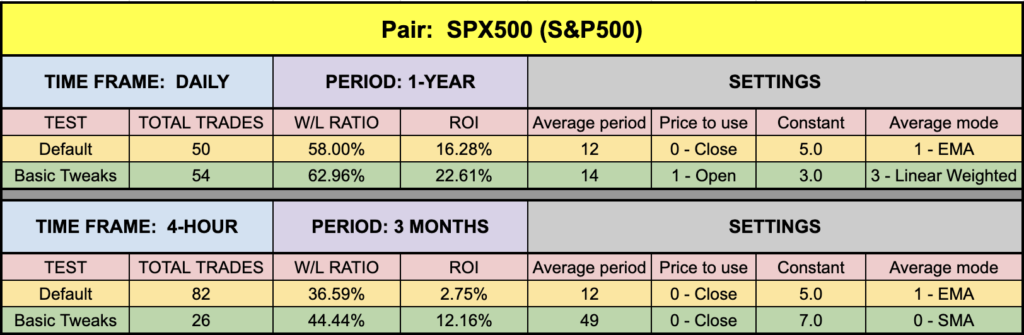
All But One
As we can see, all the numbers were pretty darn good…except for the daily EUR. That just couldn’t find any real traction at the moment. But everything else, even the 4-hour data…was pretty solid. And, that’s perfectly fine. Remember, if you’re going to test these, test them across the six pairs we recommend, seeing how they’ll do overall. Who knows, with these numbers, you might be able to afford to check that second bag on your big vacation…
Resources
As we did with past indicator studies, we’ve made the McGinley Dynamic Indicator available for download on our site from the indicator library. We will keep adding better indicators with each study for your use, at no charge. When you’re ready to get it, click HERE.
Our only goal is to make you a better trader.
*Our published testing results are based on money management strategies employed by the NNFX system and depend on varying external factors, which may be different between individuals and their specific broker conditions. No guarantee, trading recommendations, or other market suggestions are implied. Your results and subsequent trading activities are solely your own responsibility.
BTW – Any information communicated by Stonehill Forex Limited is solely for educational purposes. The information contained within the courses and on the website neither constitutes investment advice nor a general recommendation on investments. It is not intended to be and should not be interpreted as investment advice or a general recommendation on investment. Any person who places trades, orders or makes other types of trades and investments etc. is responsible for their own investment decisions and does so at their own risk. It is recommended that any person taking investment decisions consults with an independent financial advisor. Stonehill Forex Limited training courses and blogs are for educational purposes only, not a financial advisory service, and does not give financial advice or make general recommendations on investment.