Welcome Back
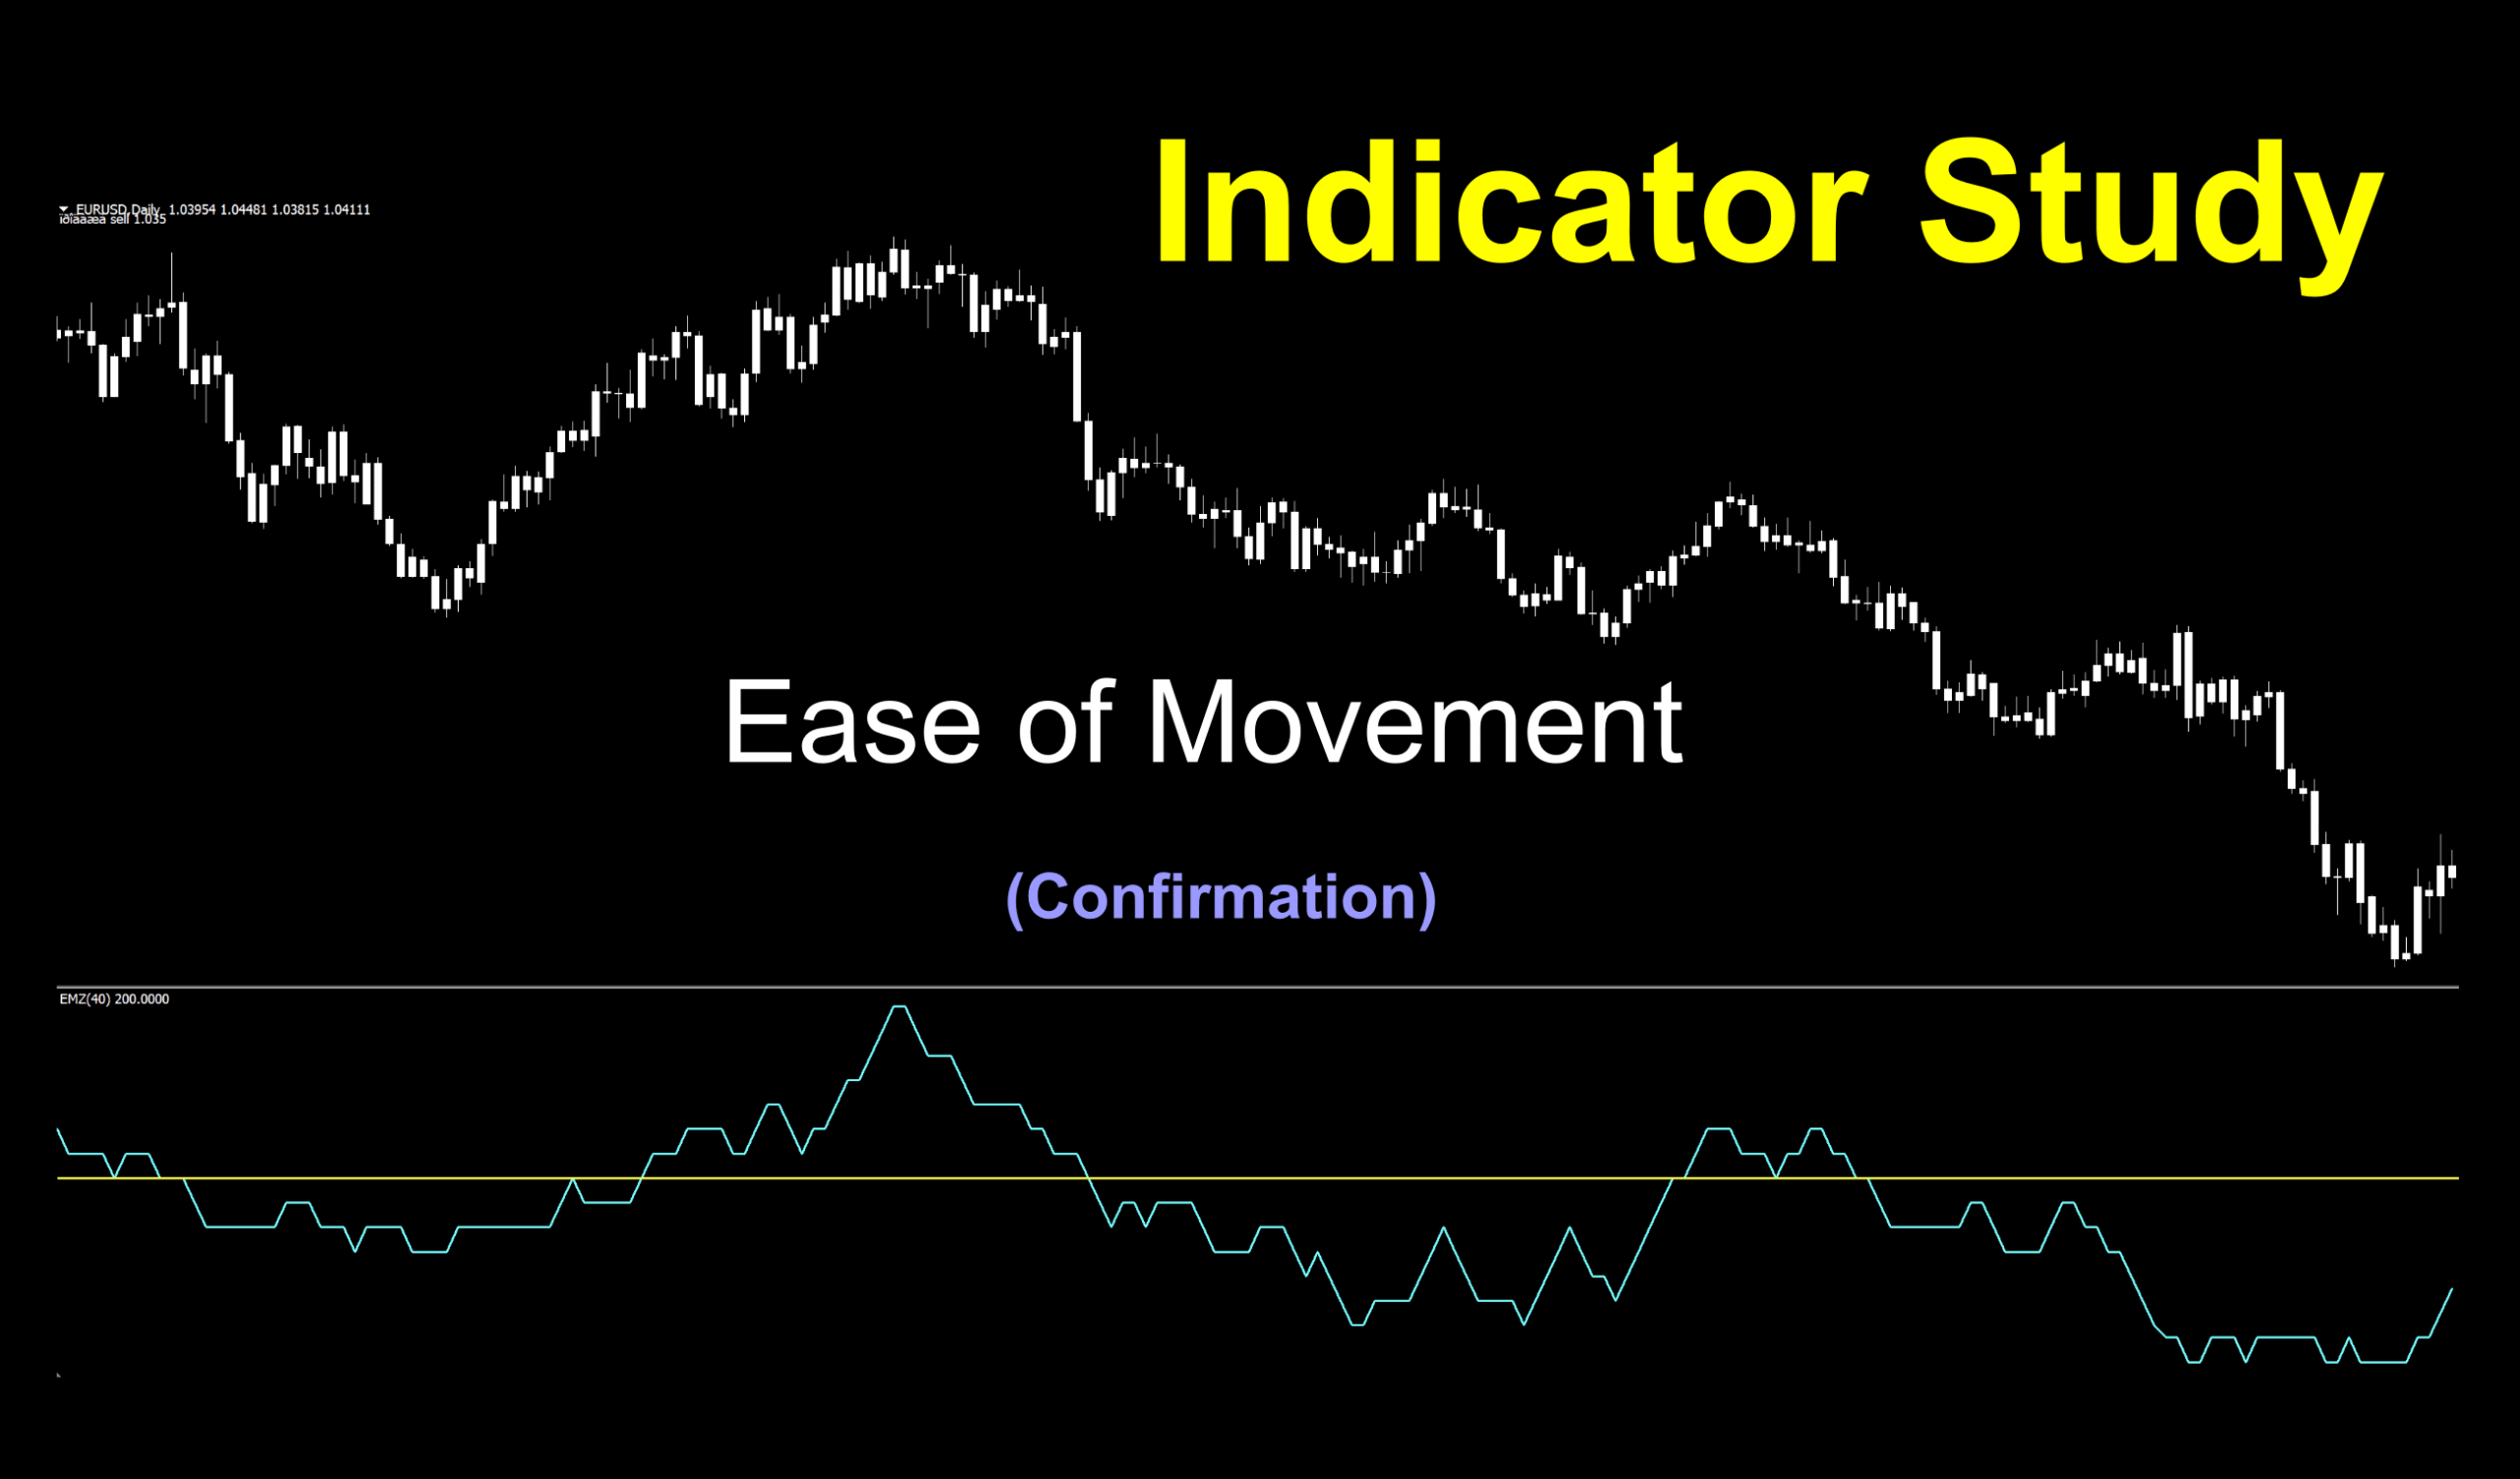
We’re highlighting an interesting indicator this week called the Ease of Movement, sometimes abbreviated as the EMZ or EOM. We want to bring you helpful indicators that you can have for free, which will provide the tools you need when developing your algorithm. Our goal is to introduce indicators not found included with the MetaTrader4 (MT4) platform and possibly save you some research time.
What’s the Mission
The indicator’s goal is to combine momentum and volume data into a single value and display it as a zero-cross line. This is especially helpful when trying to identify a trend.
Recall that momentum is a function of price, offering a way for traders to identify not only how a currency pair is moving, but the underlying “pressure” that is behind the movement. That pressure and momentum can be described as price moving in a direction with little “resistance”, meaning that it is in a trend state.
Who’s The Man?
The concept was developed by Richard Arms, Jr. in 1999 and can be found in his book titled, “Profits in Volume”. Interestingly enough, the ease of movement came as a further development of something called the “Arms Index” which was referred to as something called the short term trading index.
Hot Stuff
Just how significant was this discovery? Let us tell you…it was so important that it appears daily in the Wall Street Journal, weekly in Barron’s, and more impressively, recalculated and displayed minute by minute on the CNBC ticker tape. Heck of a guy, no? Good stuff!
Back to Basics
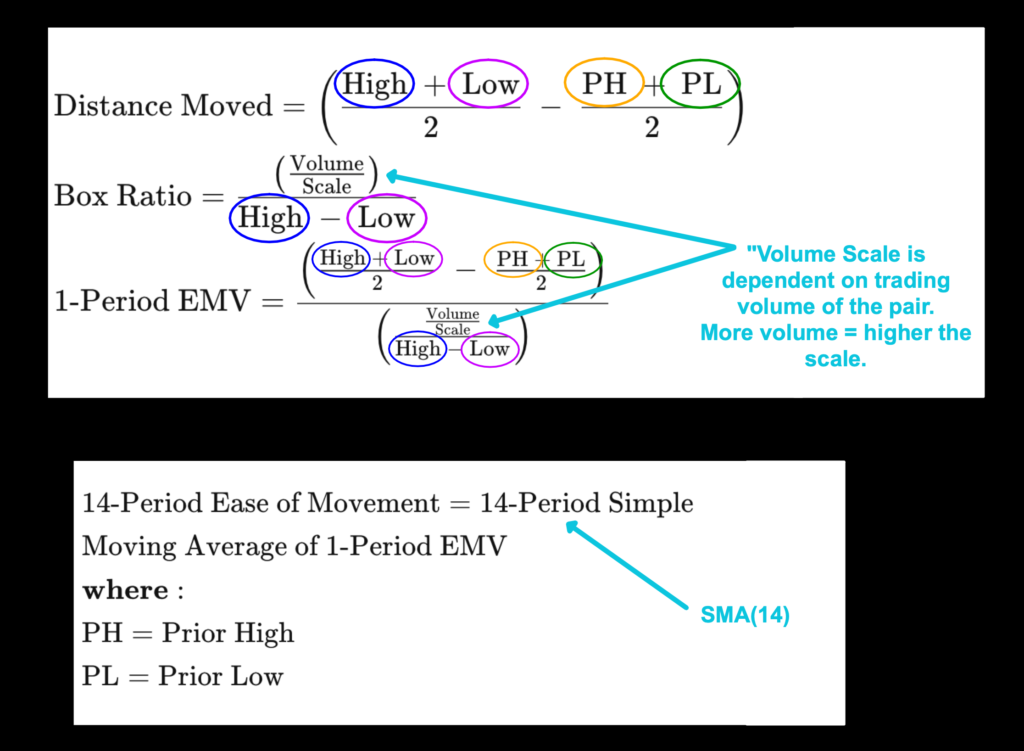
You might think there must be some brain numbing math involving lots of Greek letters with this kind of indicator. In reality, it comes down to a few variables including; price highs/lows, a simple moving average, and prior highs/lows. The magic is how it all fits together. The formula (for our math gurus out there) is below.
Confirmation Indicator
As a confirmation indicator, it finds its home between your baseline and volume indicators. This one is an easy to interpret under-the-chart zero-line type of indicator. We like those because they keep your price chart a little cleaner for other indicators and chart notations.
Looking Nice
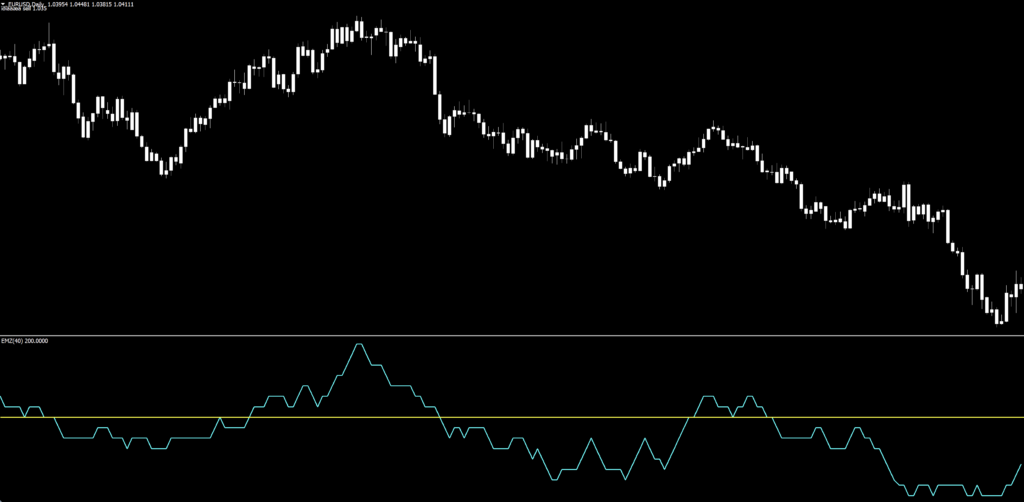
In the screenshot below, we’ve brightened up the indicator line from a darker blue into something more visible. We’ve also brightened up the zero line as well, which makes it easy on the eyes. As we usually do, the candle colors are changed to white which removes bias, allowing us to focus strictly on the indicator.
Settings
This indicator has three variables in the settings window, but you only need to adjust one of them for testing purposes.
EMZPeriod: The number of bars (or periods) the indicator looks back to gather data for consideration. The longer the period, the less reactive the line but, your signals may come late. The shorter the period, the more false signals may occur. The default value is 40.
MinValue/MaxValue: This has to do with the volume scaling. You can just leave these on their default values of -1000/1000 and carry on.
Advantages
*Definitive long/short signals when crossing the zero-line.
*Only one variable to adjust, making testing quicker and easier.
How We Use It
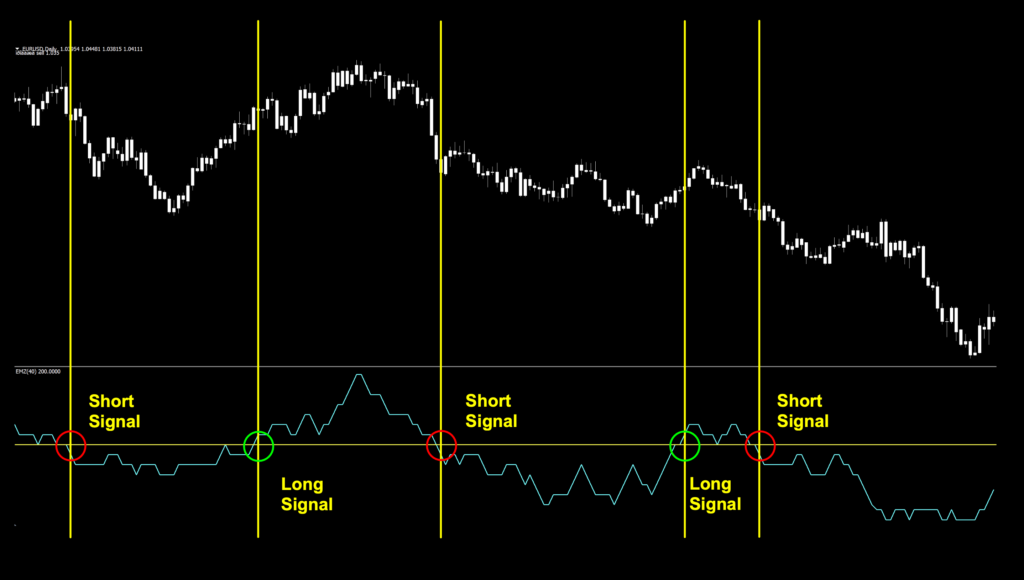
Long signal – When the line CROSSES & CLOSES above the zero line. Entry is on the open of the next period.
Short signal – When the line CROSSES & CLOSES below the zero line. Entry is on the open of the next period.
SUPER IMPORTANT! Be sure not to open the trade if the line closes on the zero line. Wait until it actually closes above/below the zero line. We’ll address this a little later.
Let’s take a look at a marked up default chart to see where the entries would be.
Itchy Trigger Finger
As it happens, there are times when traders are waiting for a period to close, so they can open a position. And, that demonstrates a high degree of patience (good on you). We noticed that with this indicator, you may have to display extraordinary patience before opening that position.
Walk the Line
By this, we mean that there are times when the indicator “rides” the zero line for more than one period before giving you the signal to enter. We’ll show you why you need to be patient.
Party Colors
In the images below, we’ve changed the candle colors to illustrate a concept. Blue are bull candles and red are bear candles. Now that we’ve got our party colors on, let’s get to it.
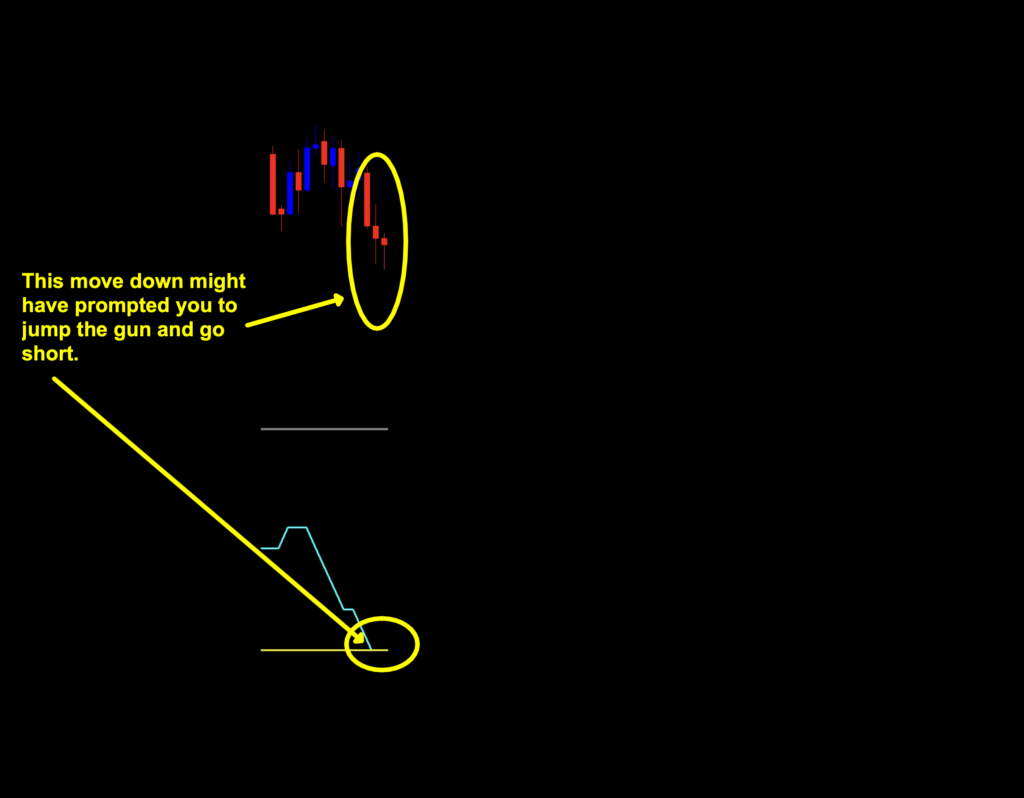
Going Down
You can see that price has started to move down with a considerable degree of momentum. The indicator has touched the zero line, so why not get in for a bit of a “discount” and pick up a few extra pips on the market’s tab. Seems like one of those times when you can beat the market (which, by the way, is a bad idea), am I right?
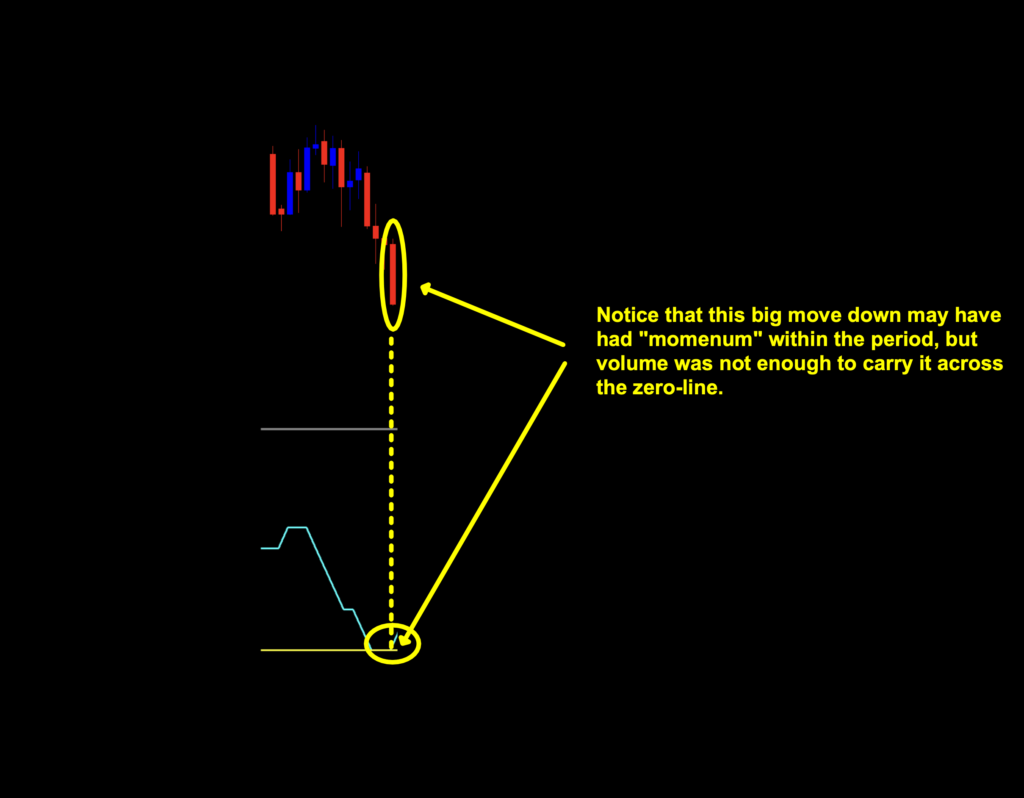
Let’s Go!
The next candle exhibits even more momentum, so you’re thinking, “Cool! I booked some bonus pips on that one…I’ll just keep riding it down”. Little did you notice that the indicator rode along the zero-line for two periods and is now pointing up…even with all that downside momentum. Not a good sign.
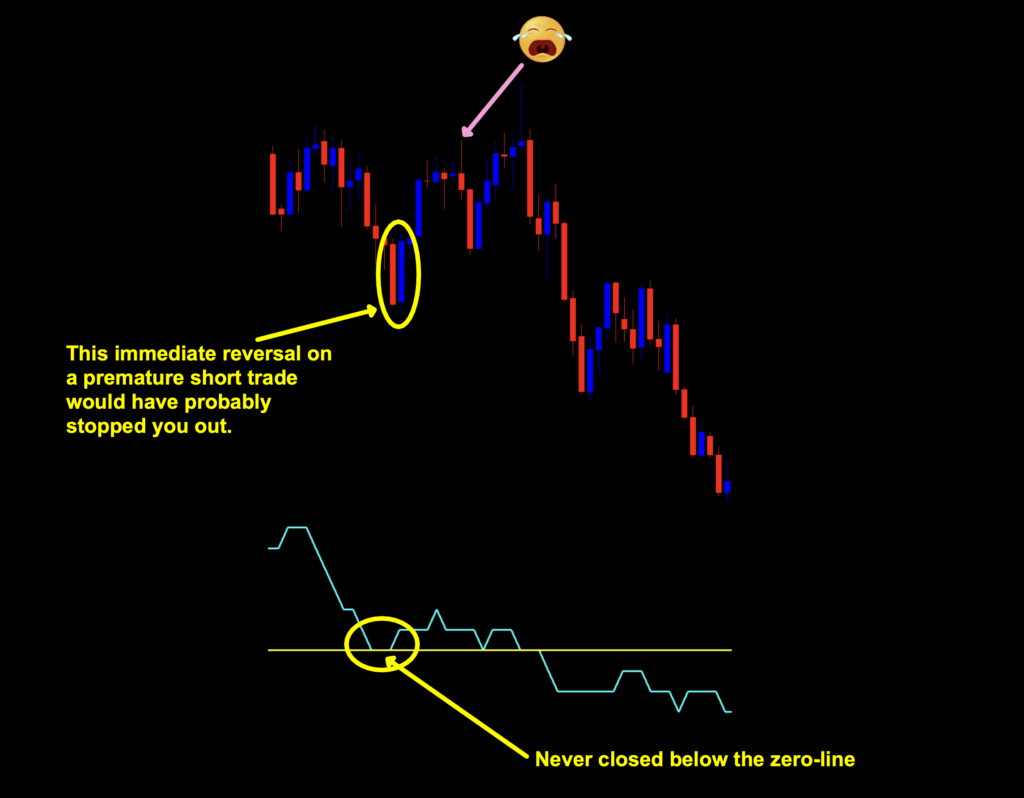
Pucker
Looking at the next image, you see that price reversed, and you’re back to your entry price where you “jumped the gun”. Then, to your dismay, it kept on going up and probably took out your trade at your stop loss (you do have one, right?). A needless loss, for sure. This is why you really need to have patience, control that impulse to beat the market, and let your algorithm do its thing and stay the heck out of its way.
Exit or No?
As a confirmation indicator, the decision to take exit signals is entirely up to you. This can be determined through backwards and forward testing to determine if it in fact works. In our preliminary observations of this indicator on the default value, it kind of stinks.
Never Ever?
Does that mean you can never consider it as an exit indicator? Of course not! Remember, depending on the variable settings and current market conditions, it can certainly be considered. We’ll take a quick peek and see how it would have measured up as an exit indicator in the mark-up below using the default settings.
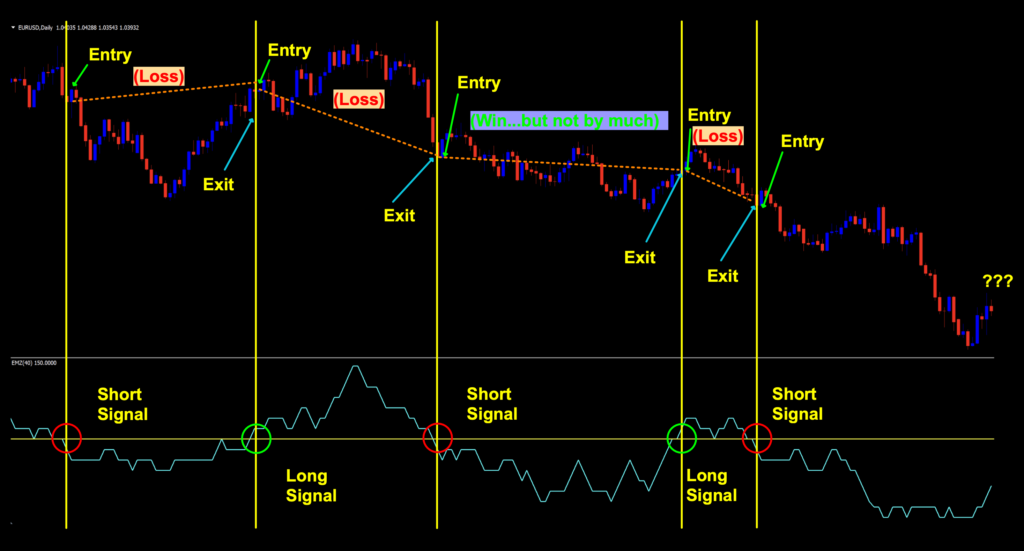
Let’s quickly review what we’re looking at. Notice that all but one of the trades would have resulted in a loss except for one…and that one was not really much of a winner? Granted, this is on the default settings, but what we’re attempting to illustrate is that not all entry signals can, or should, double as exit signals. Okay, enough said. Let’s go onto everybody’s favorite part…testing!
Testing…Testing…Testing…
Remember, comprehensive analysis is strongly suggested, and we advocate backwards and forward testing indicators or systems prior to trading actual funds. We propose conducting your tests on the following five pairs.
EUR/USD
AUD/NZD
EUR/GBP
AUD/CAD
CHF/JPY
If it doesn’t work on these five pairs, chances are it won’t work on other pairs. This is not an absolute, but we’ve found this rule is reliable in most cases.
The markets we test our indicators have grown from one, to three and not too long ago, we added a fourth based on the feedback we received and our collaborative discussions with VP.
They are the:
EUR/USD (Euro/US Dollar)
BTC/USD (Bitcoin/US Dollar)
XAU/USD (Gold/US Dollar)
SPX500 (S&P500 Index)
Timeframes and Results
In our initial test, we’ll run the Ease of Movement on the EUR/USD, BTC/USD, XAU/USD, and the SPX500 using the default settings across the daily and 4-hour timeframes on the MT4 strategy tester. We use the fast method of testing the indicator to get a general idea; however, you may also run the tick-by-tick data set for a more precise result (which takes considerably more time).
As No Nonsense Traders – and therefore Swing Traders, we will not examine shorter time frames in these studies. We will also run an additional test, using different values for the settings, to analyze which one may work better and examine the following results:
Total trades
Win/Loss ratio
ROI (return on investment)
There are other metrics included in the strategy tester report, which can be compared, but these three metrics provide the necessary gauge to make quick decisions as to the usefulness of a particular indicator and its settings.
Next, for comparison, we’ll explore the following;
Daily – 1 year
4-hour – 3 months
The reason exceptionally long (or short) testing periods are not included is due to changing market conditions, which might return irrelevant information. A balance of statistically significant data is necessary for accurate results.
And the Outcome…
Below are the spreadsheets illustrating the results from our tests.
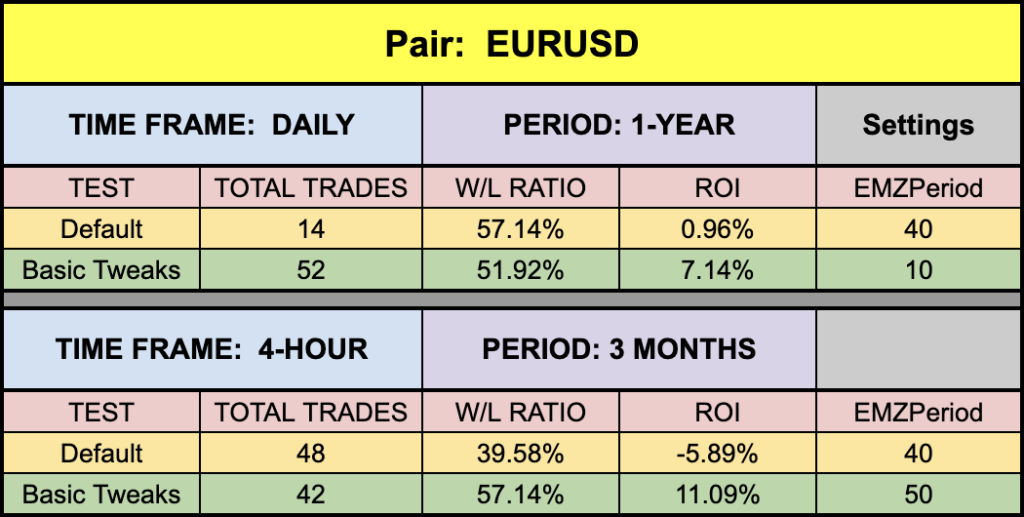

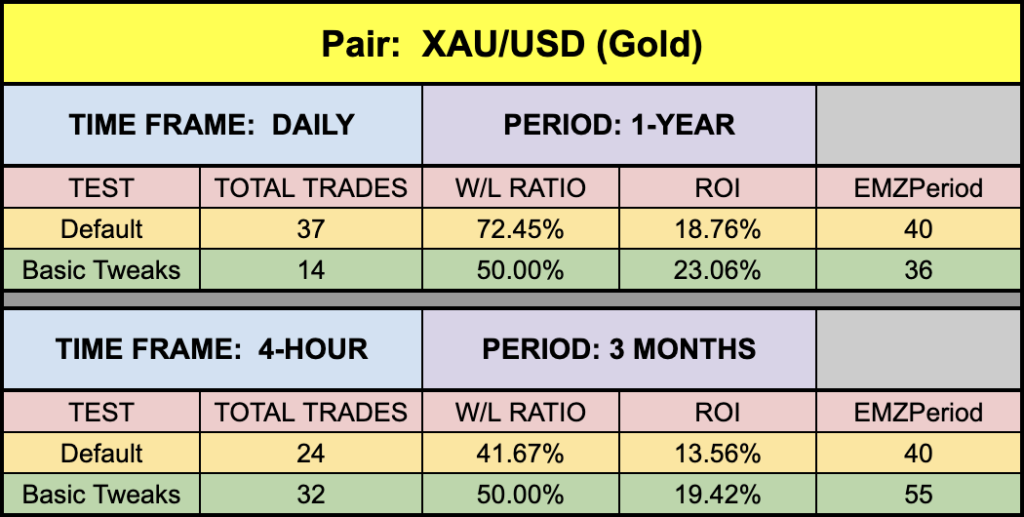
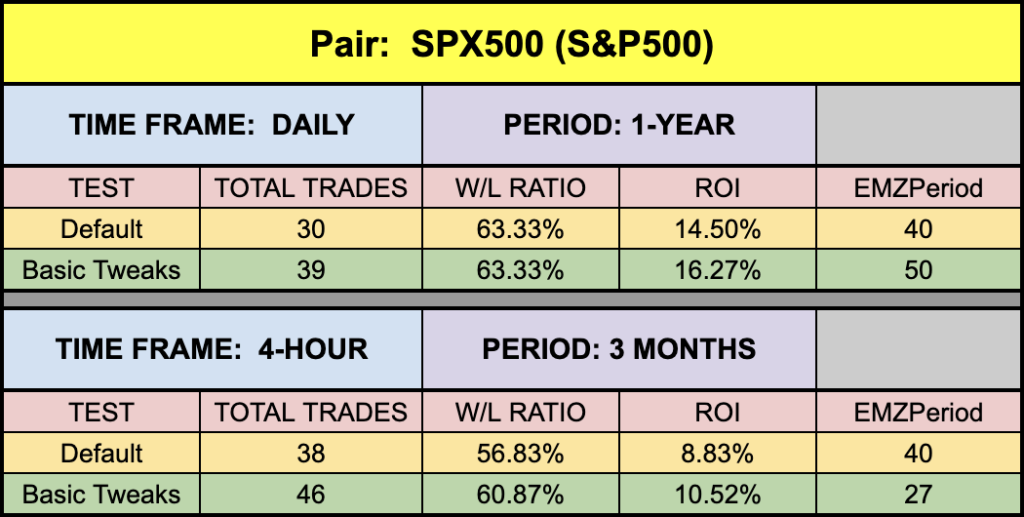
The green highlighted rows represent “basic tweaks” on the settings which returned better results. Are these the best? Not necessarily. Given that variables including testing date range and broker data are different from person to person, you may find better settings.
*NOTE: During the three-month period where we tested the XAU/USD on the 4-hour time frame, there were no possible settings that returned a positive ROI. This happens from time to time, and in that case, just move on to another indicator if that’s what you trade. This is not a big deal.
**Does that mean it will never work on the 4-hour timeframe for the XAU/USD? Nope. The particular market conditions (dead, volatile, range bound, choppy) over the span of time tested just did not work with this indicator. It’s part of trading and if you’re aware of it, then you’ll be head a shoulders above others who have no idea that this concept even exits.
Trust in Yourself
Remember, the overall NNFX philosophy of taking profit, risk, and drawdown is that YOU are creating a system which YOU will be trading. Don’t let anybody else take that away from you. Part of the learning process is digging in and doing the work yourself. To learn more about these topics, check out the Advanced Course!
That being said, the results we post in these blogs should never be considered specific trading advice.
***Note: Remember, never use just this one indicator as your decision of whether to open or close a trade. It should be part of a system.
Money Management
If you are curious as to what money management is used on our tests; we have a certain way of determining wins and losses, which can be found in the Advanced Course. Our goal here is to determine how well the indicator reacts to price with respect to producing a long or short signal. Your system, with its risk profile, will dictate individual returns.
Resources
As we did with past indicator studies, we’ve made the uf2018 Indicator available for download on our site from the indicator library. We will keep adding better indicators with each study for your use, at no charge. When you’re ready to get it, click HERE.
More to Come
There’s a lot more to come. We are excited to provide more trading tips in the near future. Sign up on our contacts page or subscribe to our YouTube channel. Receive early notifications as we continue to publish helpful, relevant, and informative Forex related material to support your quest to become a better trader.
And, now you are aware of another indicator that many traders don’t know or use.
Our only goal is to make you a better trader.
BTW – Any information communicated by Stonehill Forex Limited is solely for educational purposes. The information contained within the courses and on the website neither constitutes investment advice nor a general recommendation on investments. It is not intended to be and should not be interpreted as investment advice or a general recommendation on investment. Any person who places trades, orders or makes other types of trades and investments etc. is responsible for their own investment decisions and does so at their own risk. It is recommended that any person taking investment decisions consults with an independent financial advisor. Stonehill Forex Limited training courses and blogs are for educational purposes only, not a financial advisory service, and does not give financial advice or make general recommendations on investment.