We Owe You
In light of the “repainter” we put out last week, we’re making it up to you by coming back a week early with the next Stonehill Forex indicator study. We found a simple indicator that you may find helpful and is not part of the “boxed set” found on the MT4 platform.
Looky Here
We wanted to bring you the uf2018 Indicator which is popular and can be found with a simple search although, there isn’t much information about it. Not only that, but we had to dig into the code to find it that it was developed in 2012; however, the coder who designed it never disclosed their name. This in itself is a bit odd, unless they wanted to remain in the shadows…and that’s perfectly fine with us. Keep giving us indicators we can use, mystery coder!
What Makes it Easy Peasy
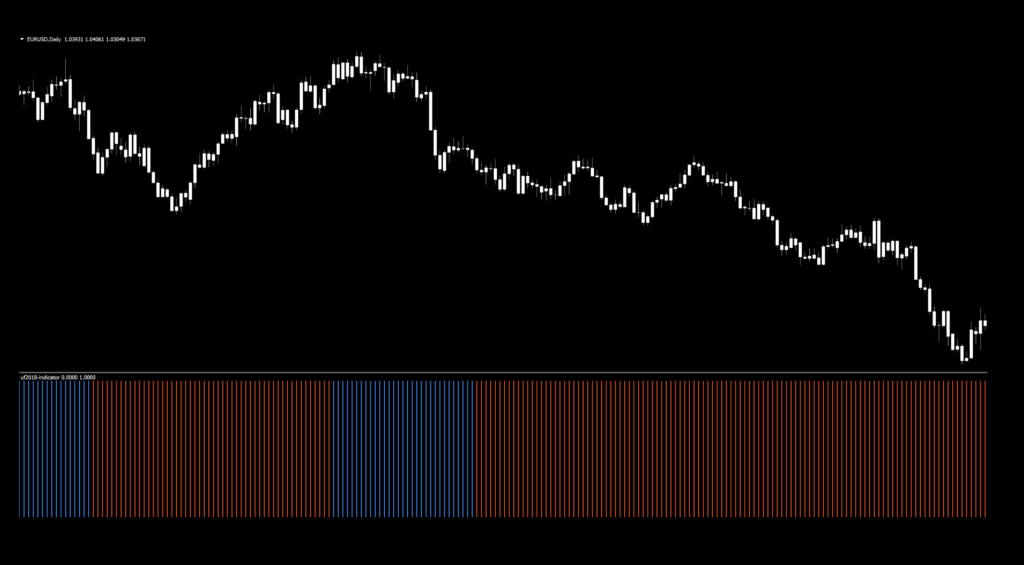
A simple below chart indicator, this histogram displays two colors; red and blue. That’s it. No guessing, no trying to figure out when the lines cross or go above or below a particular level. Just a simple color change. Easy-peasy.
Keeps You In
Additionally, you’ll see that this indicator is somewhat “smooth” with respect to keeping you in a trade. Some indicators react so quickly to price changes that you stand a chance of whipsawing yourself out of your hard-earned money. We think you’ll like the visuals on this.
Confirmation Indicator
As a “confirmation indicator”, its job is to serve as an initial checkpoint AFTER the baseline indicator provides you with the anchor of your algorithm. As mentioned, it’s a below chart histogram that changes color. Nice.
Can it be Used as an Exit?
This indicator can be used as an exit indicator; however, is it the best choice? It depends on your settings and, of course, the market. In a choppy market, finding an entry that doubles as an exit indicator can be a challenge. But that’s the art of what we do. When (and if) you can find a confirmation indicator that does double duty, you’ve got yourself a real gem…
Bewitching, No?
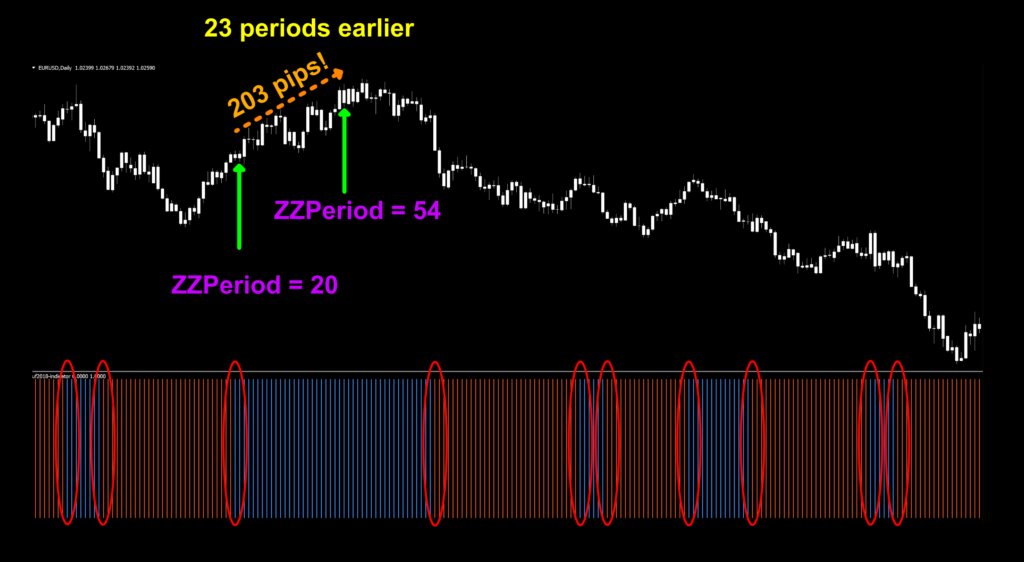
In the screenshot below, we’ve plotted the indicator using the default settings because it shows up pretty clearly. Some change the blue to green and change the thickness of the bars, but that’s a personal choice. As we usually do, the candle colors are changed to white which removes bias, allowing us to focus strictly on the indicator.
Settings
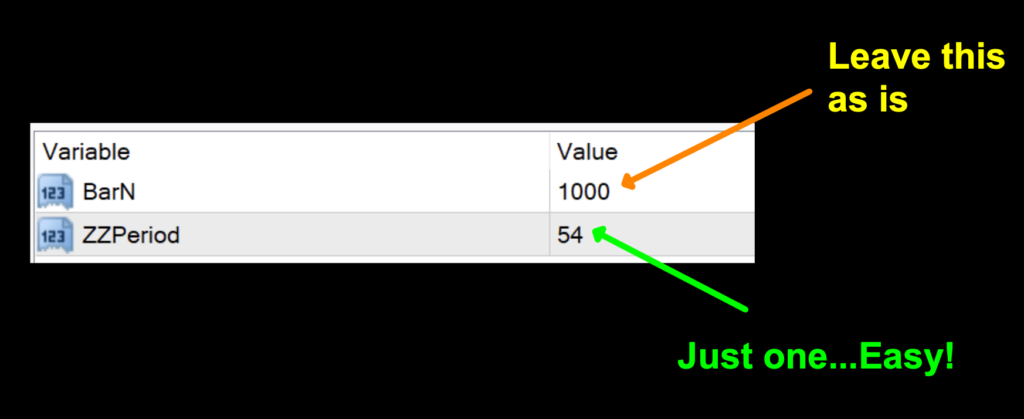
There are only two variables in the settings window; and, you only need to concern yourself with one of them. It makes testing a lot easier and quicker to find the best setting.
BarN: The number of bars the indicator will draw back to in history. For our testing purposes, 1000 is sufficient, so it doesn’t need to be changed.
ZZPeriod: This is the look back period the indicator needs for math consideration. The higher the number, the longer the look back. Interestingly enough, the default value is 54, which is (in our opinion) quite high, but it certainly smooths things out. We’re going to address this shortly.
Advantages
* Simple color changes give signals.
* Might make a good exit indicator.
* Easy to test due to lack of multiple variables.
How we use it
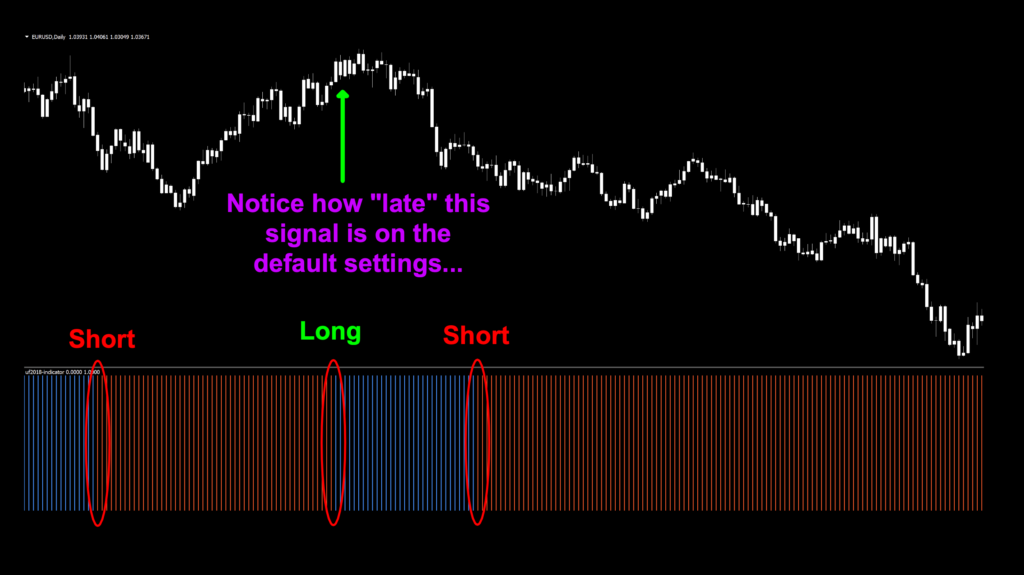
Long signal – When the histogram turns from red to blue, a long signal is generated and your entry would occur on the open of the next candle.
Short signal – When the histogram turns from blue to red, a short signal is generated and your entry would occur on the open of the next candle.
Let’s take a look at a marked up chart to see what we’re talking about.
Late to the Party
Notice how late that long signal is on the default setting. That’s fine. The beautiful thing about this indicator is that with only one variable to change and the visual ease it offers, finding better signals can be a much quicker endeavor than with other indicators. We like those! But…look at that second short. Yes, it’s a little late – but look how long it kept you in a trade. That’s pretty cool too.
One more thing
Out of curiosity, we changed the “ZZPeriod” value to 20 – which as some of you might know is a common setting for many trend identifying indicators. Not everything requires in-depth testing to see what might make for a better entry, right? The awesome thing about an indicator like this is that it can be tested visually very quickly.
Testing…Testing…Testing…
Remember, comprehensive analysis is strongly suggested, and we advocate backwards and forward testing indicators or systems prior to trading actual funds. We propose conducting your tests on the following five pairs.
EUR/USD
AUD/NZD
EUR/GBP
AUD/CAD
CHF/JPY
If it doesn’t work on these five pairs, chances are it won’t work on other pairs. This is not an absolute, but we’ve found this rule is reliable in most cases.
The markets we test our indicators have grown from one, to three and not too long ago, we added a fourth based on the feedback we received and our collaborative discussions with VP.
They are the:
EUR/USD (Euro/US Dollar)
BTC/USD (Bitcoin/US Dollar)
XAU/USD (Gold/US Dollar)
SPX500 (S&P500 Index)
Timeframes and Results
In our initial test, we’ll run the uf2018 Indicator on the EUR/USD, BTC/USD, XAU/USD, and the SPX500 using the default settings across the daily and 4-hour timeframes on the MT4 strategy tester. We use the fast method of testing the indicator to get a general idea; however, you may also run the tick-by-tick data set for a more precise result (which takes considerably more time).
As No Nonsense Traders – and therefore Swing Traders, we will not examine shorter time frames in these studies. We will also run an additional test, using different values for the settings, to analyze which one may work better and examine the following results:
Total trades
Win/Loss ratio
ROI (return on investment)
There are other metrics included in the strategy tester report, which can be compared, but these three metrics provide the necessary gauge to make quick decisions as to the usefulness of a particular indicator and its settings.
Next, for comparison, we’ll explore the following;
Daily – 1 year
4-hour – 3 months
The reason exceptionally long (or short) testing periods are not included is due to changing market conditions, which might return irrelevant information. A balance of statistically significant data is necessary for accurate results.
And the Outcome…
Below are the spreadsheets illustrating the results from our tests.
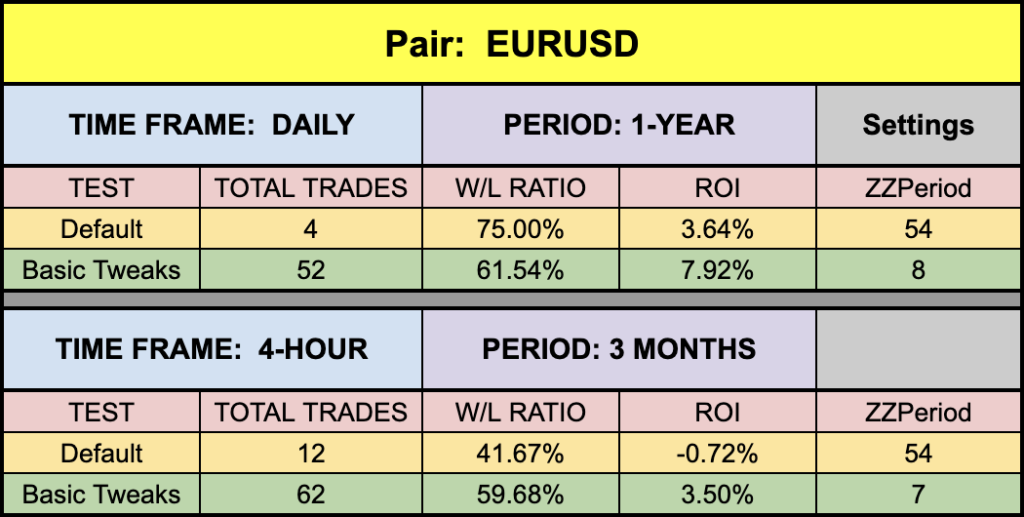
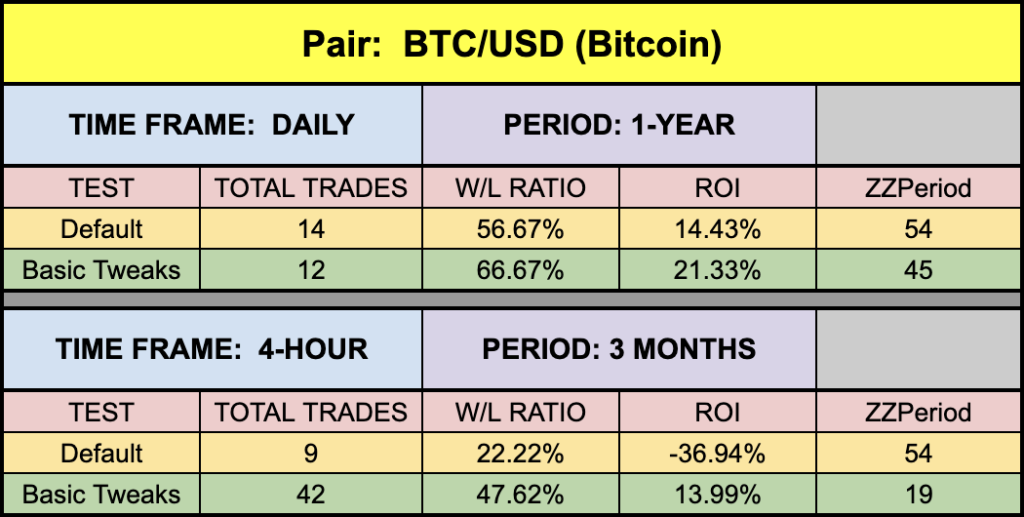
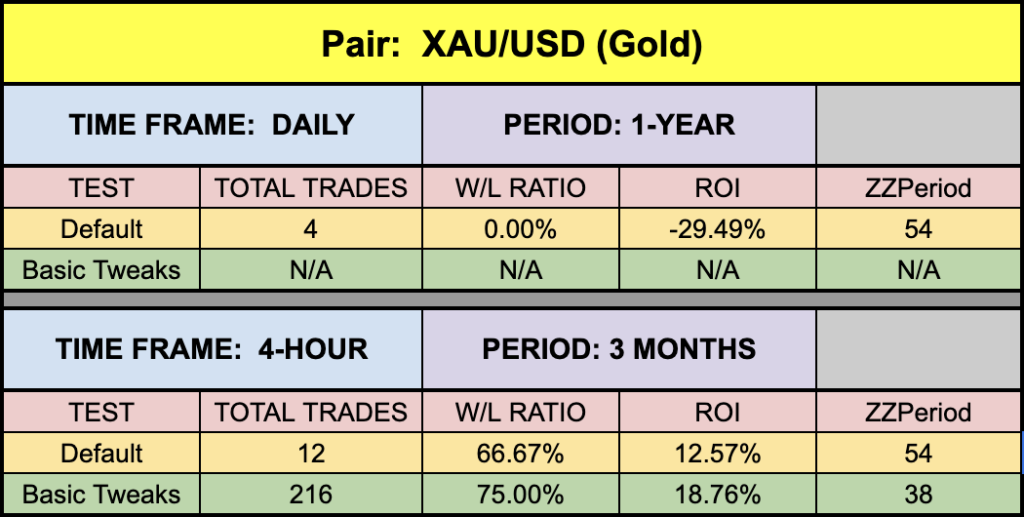
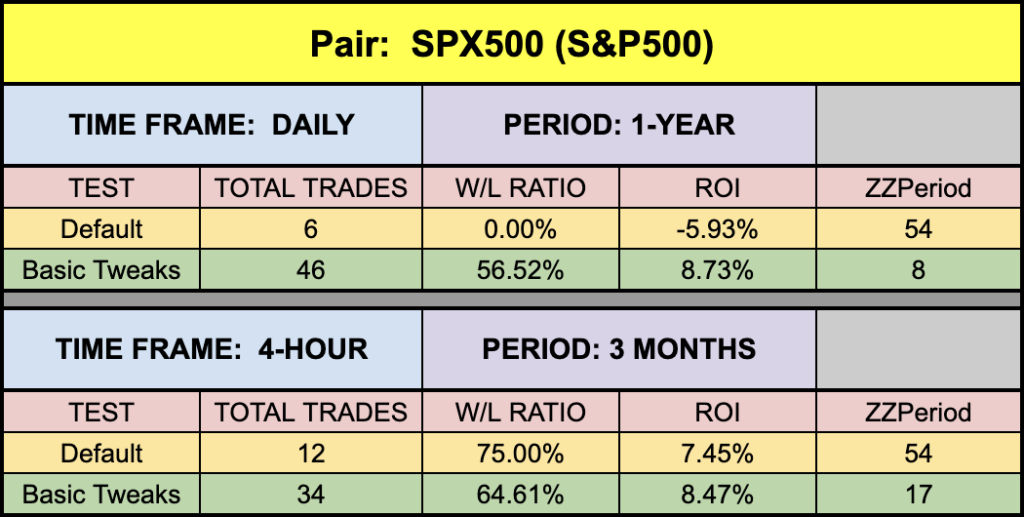
The green highlighted rows represent “basic tweaks” on the settings which returned better results. Are these the best? Not necessarily. Given that variables including testing date range and broker data are different from person to person, you may find better settings.
*NOTE: During the three-month period where we tested the XAU/USD on the 4-hour time frame, there were no possible settings that returned a positive ROI. This happens from time to time, and in that case, just move on to another indicator if that’s what you trade. This is not a big deal.
**Does that mean it will never work on the 4-hour timeframe for the XAU/USD? Nope. The particular market conditions (dead, volatile, range bound, choppy) over the span of time tested just did not work with this indicator. It’s part of trading and if you’re aware of it, then you’ll be head a shoulders above others who have no idea that this concept even exits.
Trust in Yourself
Remember, the overall NNFX philosophy of taking profit, risk, and drawdown is that YOU are creating a system which YOU will be trading. Don’t let anybody else take that away from you. Part of the learning process is digging in and doing the work yourself. To learn more about these topics, check out the Advanced Course!
That being said, the results we post in these blogs should never be considered specific trading advice.
***Note: Remember, never use just this one indicator as your decision of whether to open or close a trade. It should be part of a system.
Money Management
If you are curious as to what money management is used on our tests; we have a certain way of determining wins and losses, which can be found in the Advanced Course. Our goal here is to determine how well the indicator reacts to price with respect to producing a long or short signal. Your system, with its risk profile, will dictate individual returns.
Resources
As we did with past indicator studies, we’ve made the uf2018 Indicator available for download on our site from the indicator library. We will keep adding better indicators with each study for your use, at no charge. When you’re ready to get it, click HERE.
More to Come
There’s a lot more to come. We are excited to provide more trading tips in the near future. Sign up on our contacts page or subscribe to our YouTube channel. Receive early notifications as we continue to publish helpful, relevant, and informative Forex related material to support your quest to become a better trader.
And, now you are aware of another indicator that many traders don’t know or use.
Our only goal is to make you a better trader.
BTW – Any information communicated by Stonehill Forex Limited is solely for educational purposes. The information contained within the courses and on the website neither constitutes investment advice nor a general recommendation on investments. It is not intended to be and should not be interpreted as investment advice or a general recommendation on investment. Any person who places trades, orders or makes other types of trades and investments etc. is responsible for their own investment decisions and does so at their own risk. It is recommended that any person taking investment decisions consults with an independent financial advisor. Stonehill Forex Limited training courses and blogs are for educational purposes only, not a financial advisory service, and does not give financial advice or make general recommendations on investment.