Market Behavior
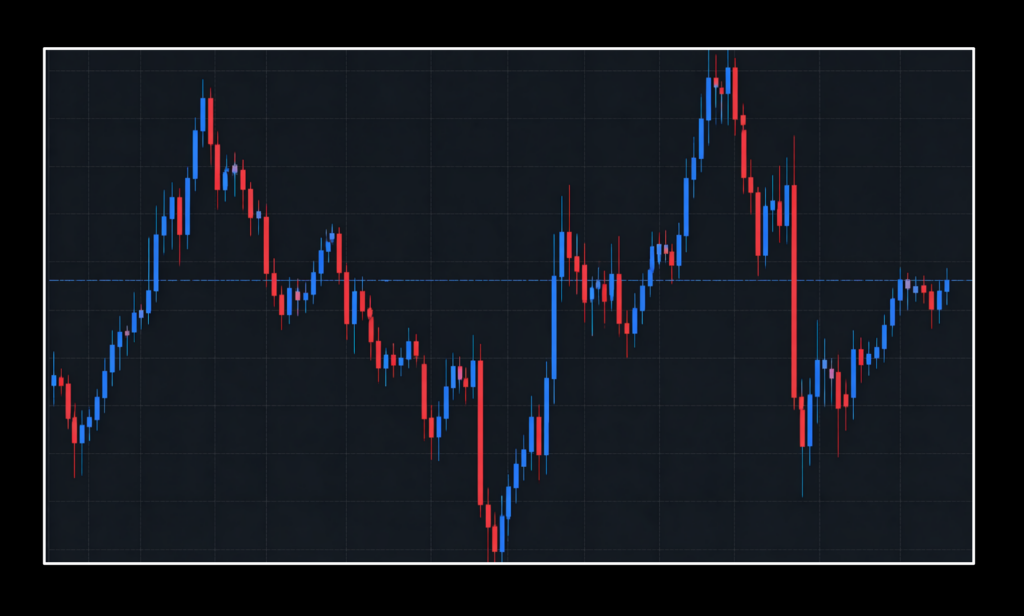
We’ve talked about this in the past, but it bears mentioning again. Markets generally exhibit a handful of behaviors. Mind you, we’re not talking about the four stages; accumulation, markup, distribution, and markdown. Those generally apply to securities, like stocks and commodities. We’re referring to the state of the market. They are, in no particular order;
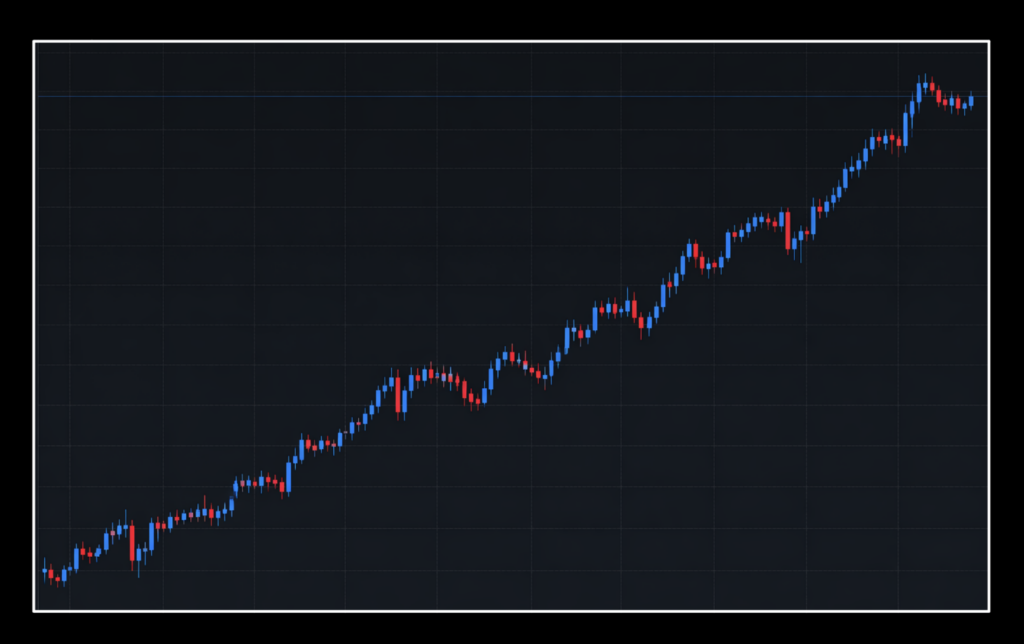
Trending (our favorite) – Where price consistently moves in a specific direction; up or down, over a sustained period.
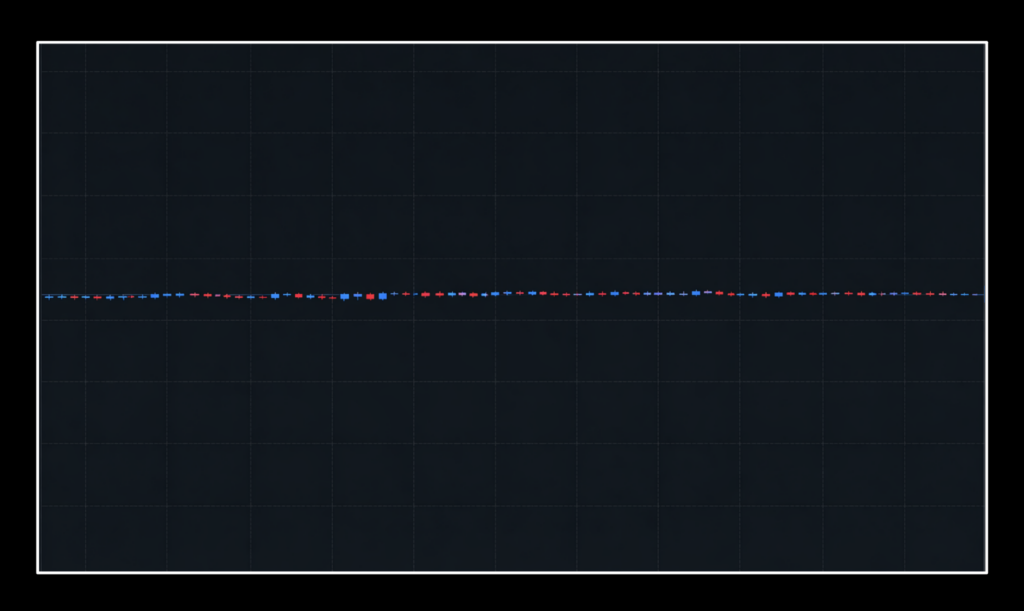
Dead (not our favorite) – Market prices are generally flat without much movement in either direction and lack volume and/or volatility.
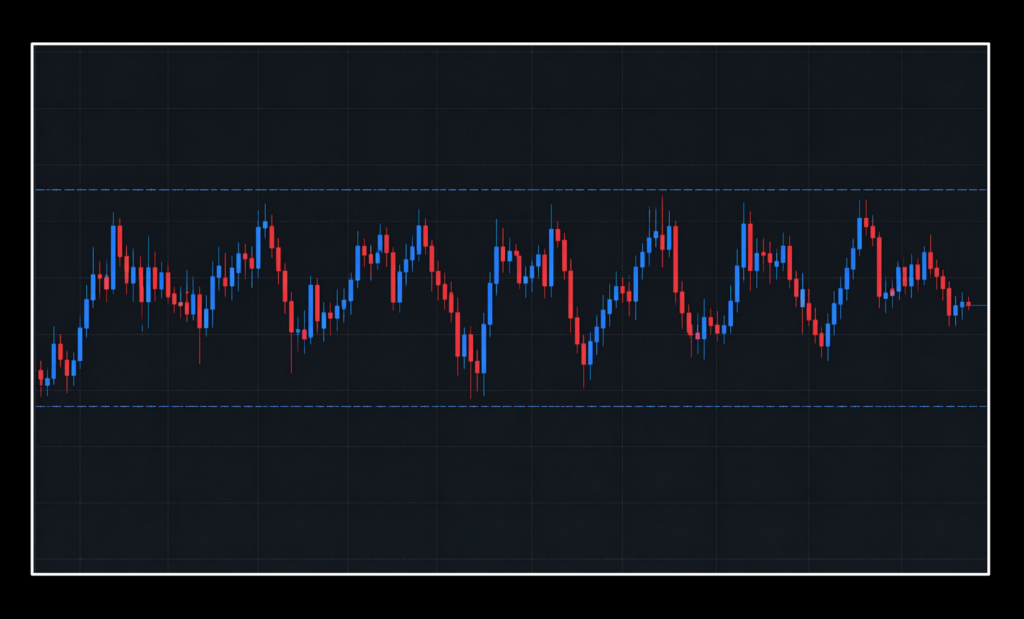
Rangebound – (difficult to trade) Where prices are “stuck” between two levels.
Volatile – (just stay away) Where prices move in quick, significant price fluctuations with sizable swings over short periods.
What We Need
What are the things which cause markets to move? We came up with a short list which can be divided into two groups.
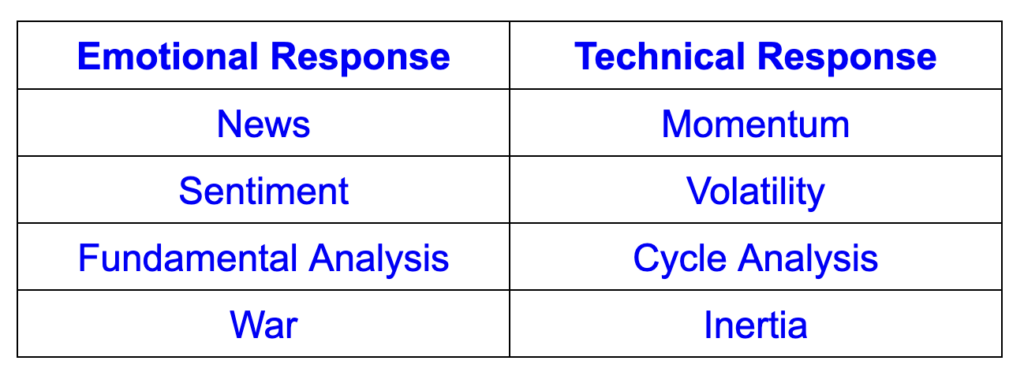
No matter what moves the market, we can’t control it so the best thing we can do is react to what’s happening. How do we do that? We use technical indicators that focus on what the price is actually doing, instead of worrying about all the emotions behind the scenes. This makes things simpler and helps us understand when to trade. In the end, focus on what you see on the chart and don’t force anything; let the opportunities come to you.
It’s Been a Minute
It’s been awhile since we did a volume type indicator. In fact, the last one was way back in October 2024.
Check It Out
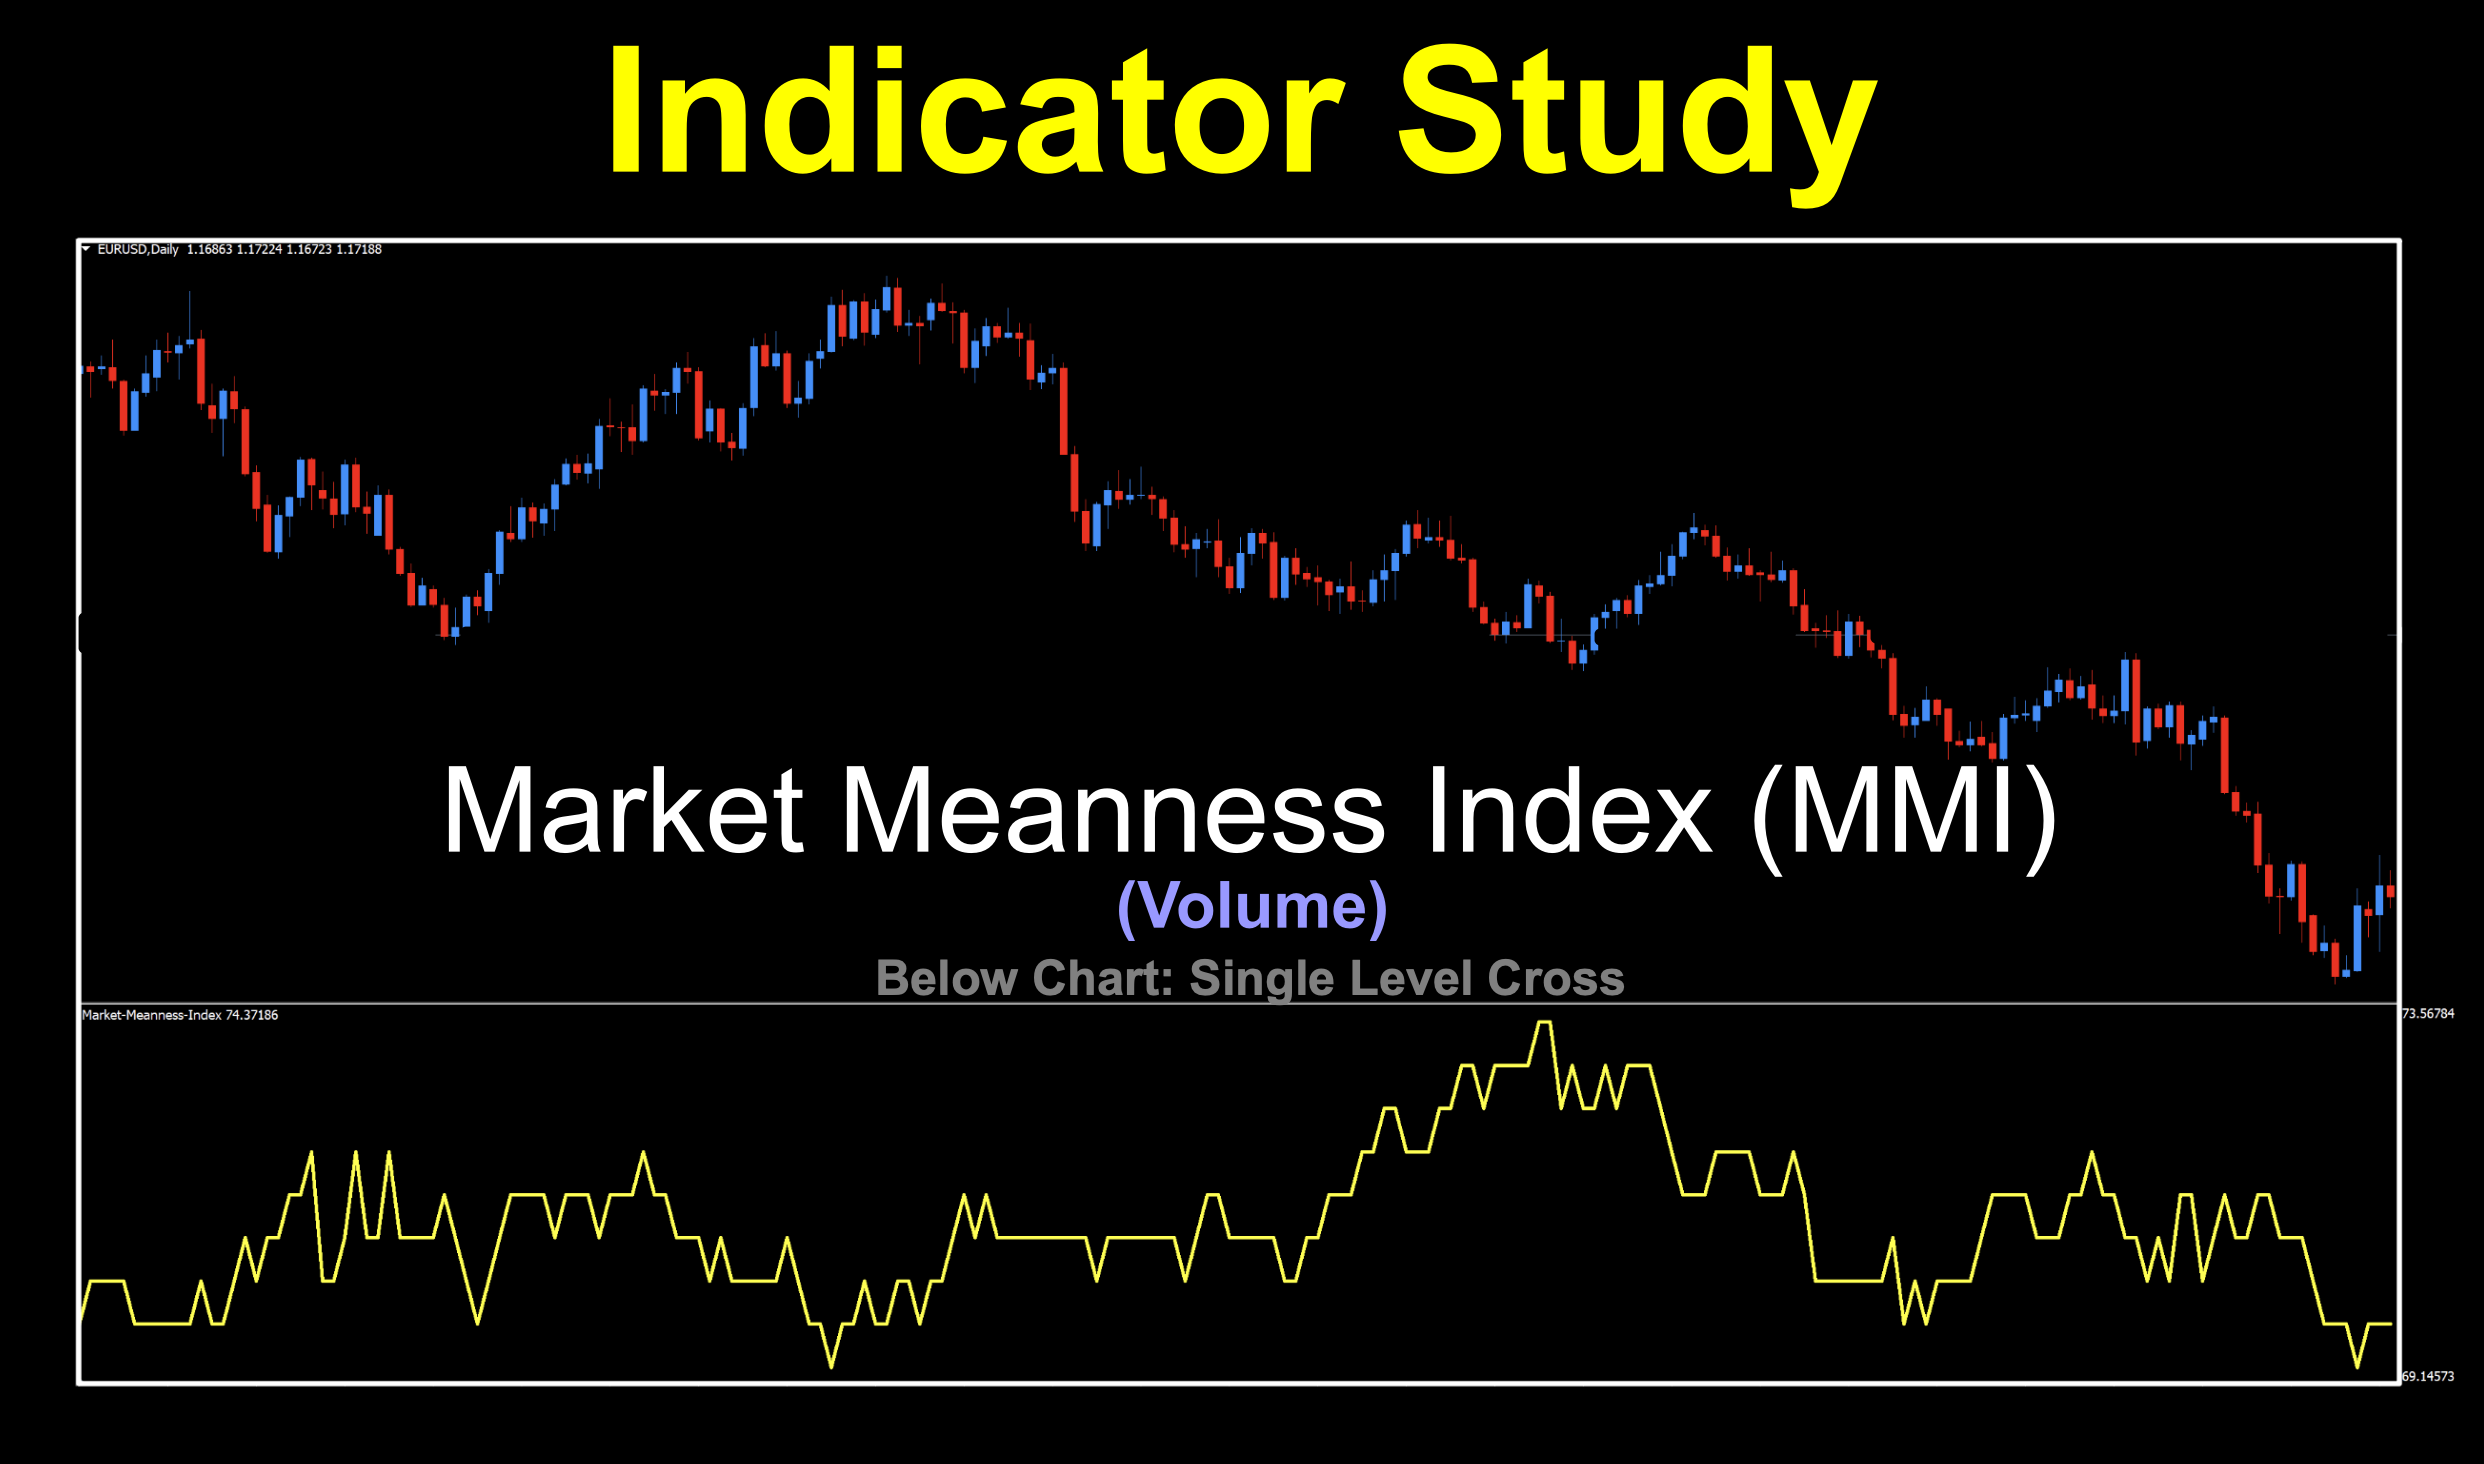
MMI was created by Jörg Mittendorf in the early 2010s, but people didn’t really start using it until around 2012. The main idea behind it is pretty simple: it uses math and probability to figure out whether the market is moving randomly (just bouncing around) or showing signs of a real trend.
Whatcha Look Like?
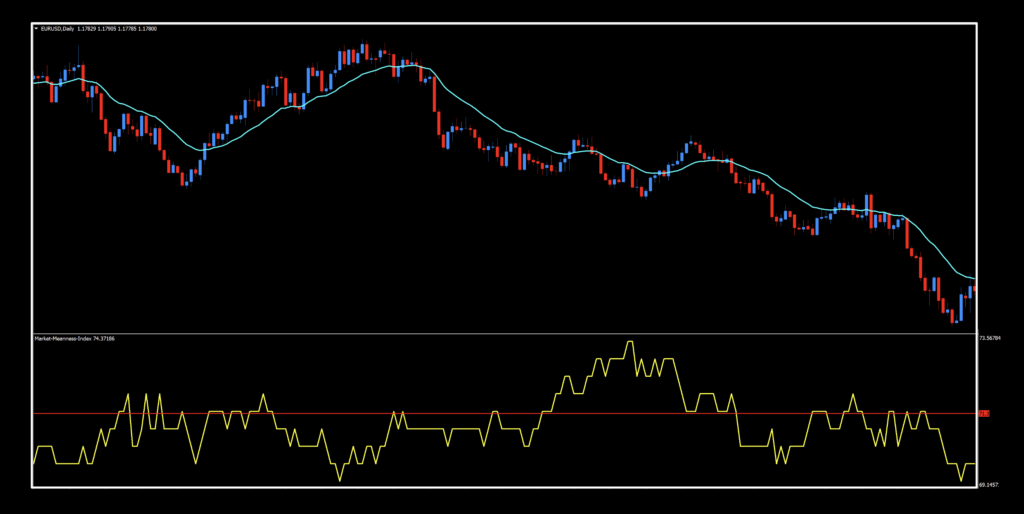
Below is a chart with the indicator looking sharp as a below chart mid-line cross and our old standby, the SMA(20) – that’s the Simple Moving Average set to a 20 period in aqua blue for newer traders. A red mid-line was added (which will be addressed later in the blog).
Settings
This indicator has three settings, but we only use the top one. The other two relate to overbought and oversold levels which we don’t subscribe to anyways.
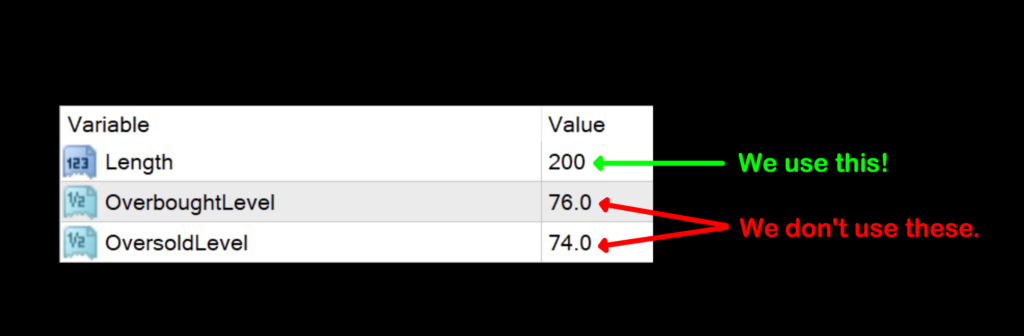
Length: The number of periods which is the centerpiece for all the calculations in the indicator. The default setting is 200.
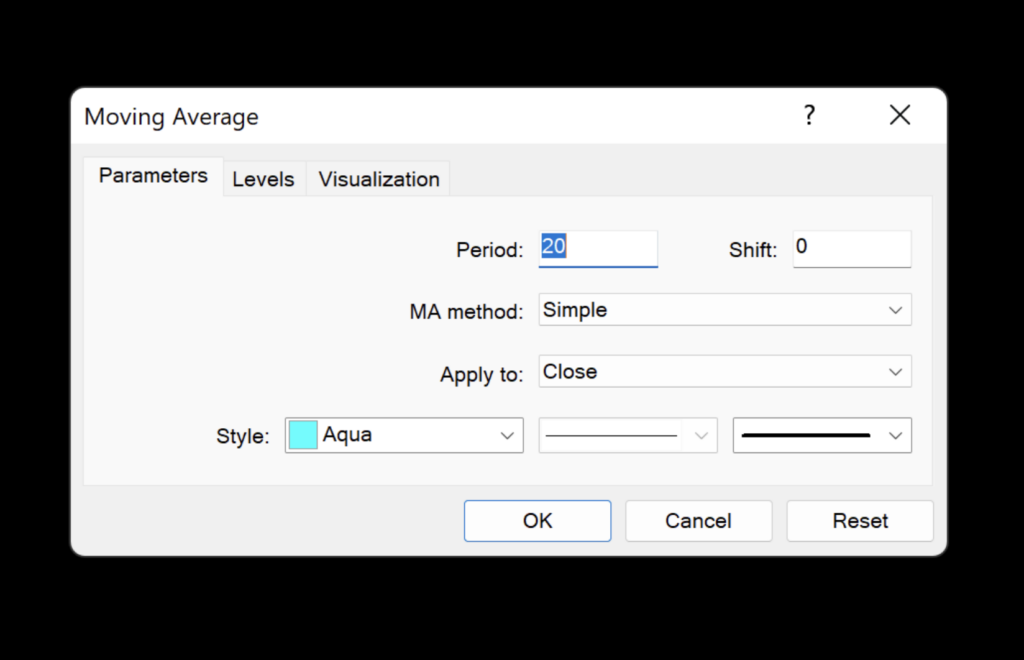
SMA(20)
The Simple Moving Average is part of the “boxed set” in the platform and its menu looks like this.
How It Reads
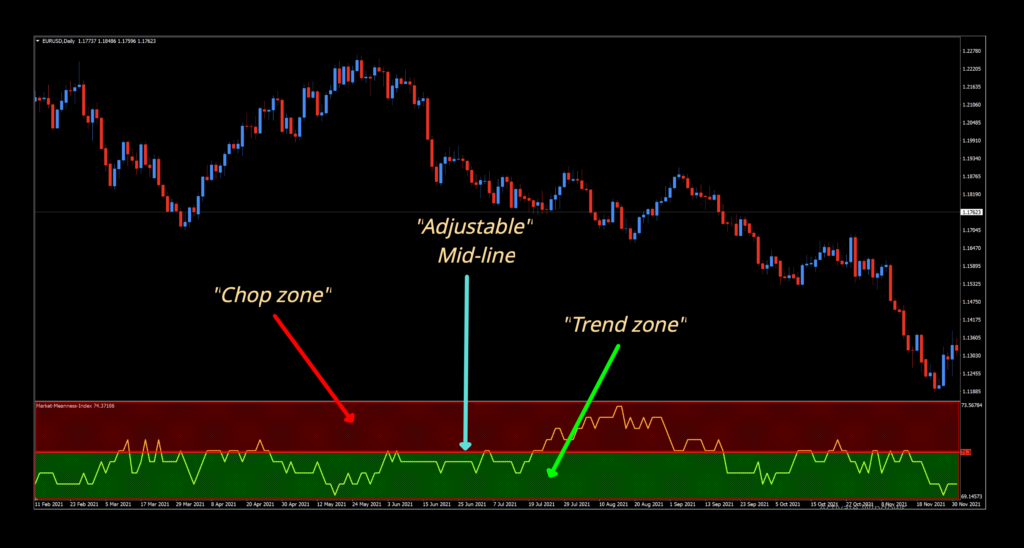
Simply stated, if the signal line is below the midline, then price is in a trending state. If the signal line is above the mid-line, then it’s “mean” and price is choppy and not agreeable for a sustained trade.
The Midline
The midline of each pair is dynamic. This means that it changes over time. Not so much that you need to check it daily, but every few weeks, just make sure that it makes sense, mathematically.
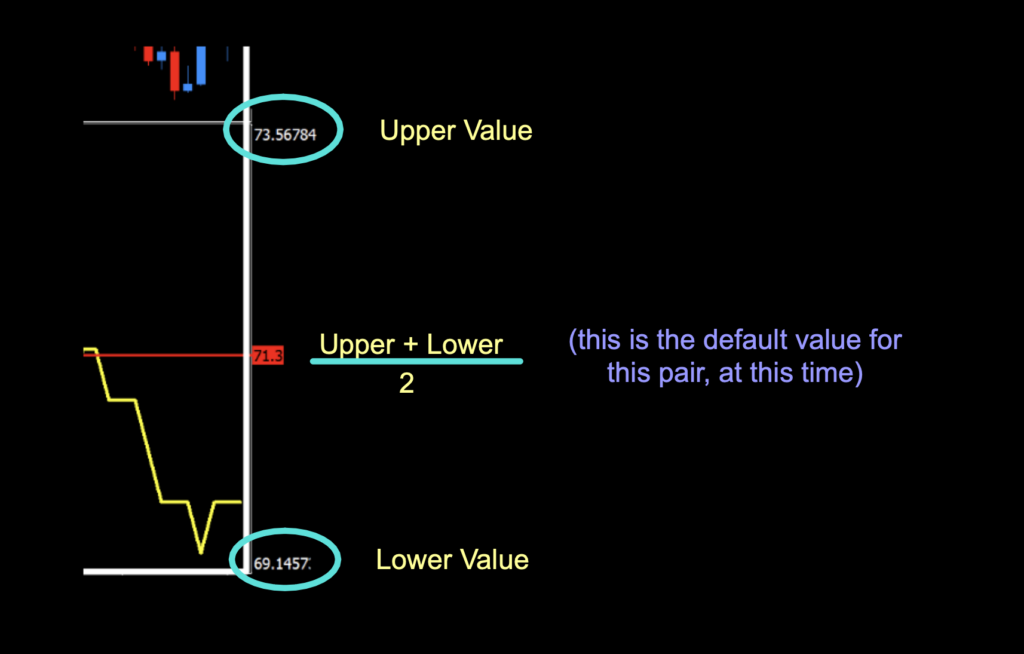
Calculating The Midline
It’s actually very simple. Take the current high value and low value of the indicator’s window, add them, and divide by two. For our example chart, it would be:
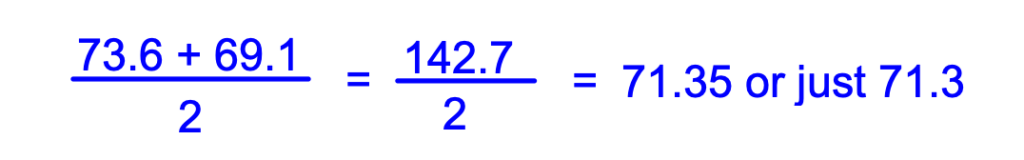
And in the screenshot below you can see where those numbers came from on the chart itself.
Different Strokes
The one thing we noticed was that different pairs have different numbers so be aware of that. We made a few minor adjustments when we did our testing to accommodate the varying number. But, its not a big deal.
Testing Midlines
When we did our testing, we were able to test through various midline settings – meaning that we looked for better mid-line values…which technically means our midline is a single level line cross. Semantics.
Important Bonus Feature
Be sure you watch the technical video as it has a bonus section at the end explaining how to test this indicator on the NNFX Algo Tester software for those who use it.
Last But Not Least
When Do We Use MMI, or any volume type indicator. That’s a valid question. It is the last “hump” you have to cross before opening up a trade. Once your pre-trade work is complete and your other algorithm parts are in agreement, this is the final step before actually pulling the trigger. Don’t ignore it. As we saw in the mark up, it could have saved you from tears in a few areas.
The Work Up
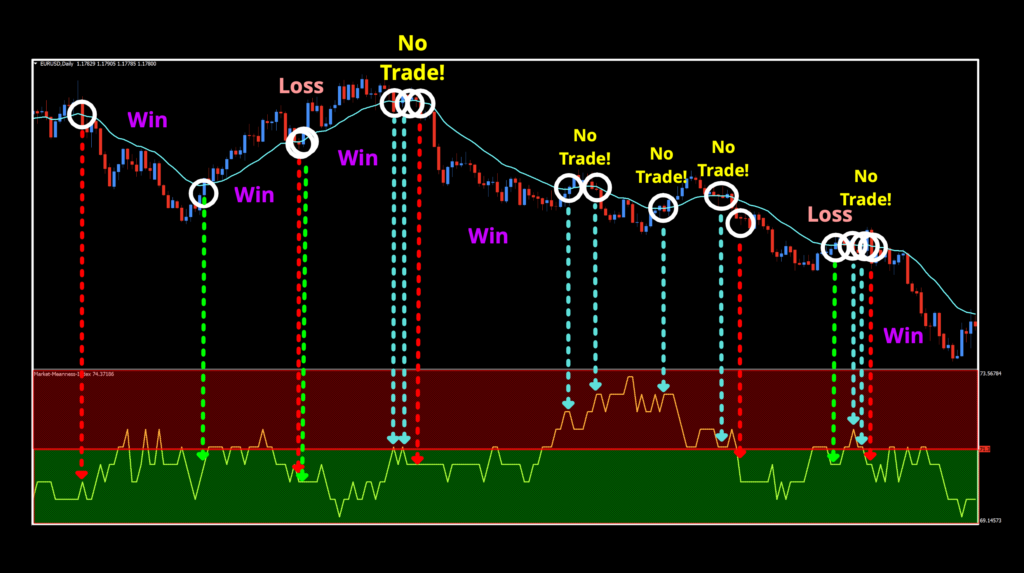
What you see here are different colored arrows;
Red – valid sell signal. This is where the baseline closed below price and the MMI is BELOW the midline.
Green – valid buy signal. This is where the baseline closed above price and the MMI is BELOW the midline.
Blue – disagreement, no signal. This is where price closed either above or below price; however, the MMI signal line is ABOVE the midline, indicating that conditions are not good for a trade.
Trading Hint
If you’re getting ready to enter a continuation trade, then volume needn’t apply here. Volume is applicable only if you’ve received a whole new set of signals; i.e., things went the other way, then reversed, and resumed in the original direction.
Reminder
Those white circles in the marked up image above only depict where valid entries would apply using the volume indicator and a sample baseline. It’s not an entire algorithm. If it were, some signals would not have been considered, especially in the congested areas.
Daily Check-In
Once you’re ready to perform daily maintenance on your trades during the last 20–30 minutes of the trading day (1700 New York time), you’ll be presented with one of four options.
- Opening a trade.
- Closing a trade
- Maintaining a trade; i.e.
- Moving a stop loss level.
- Exiting a trade.
- Taking a pass (nothing to do).
Finally – Test Results!
Below are the results we got. There were better settings (higher metrics) but that’s not what we’re after. We’ll help you along by demonstrating that this indicator can do better, but the heavy lifting is up to you.
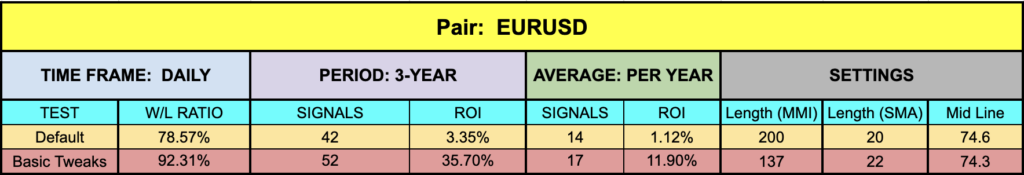
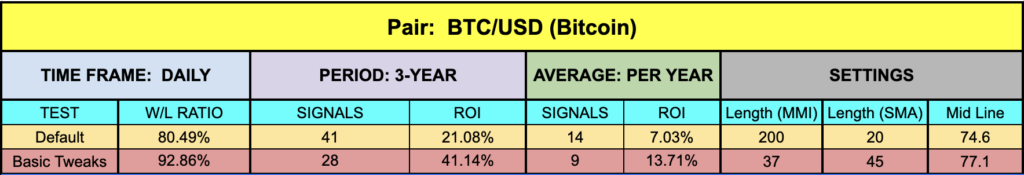
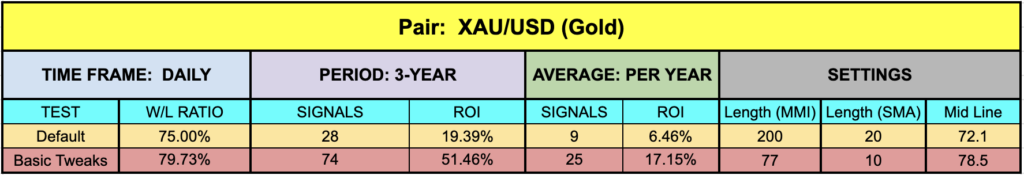
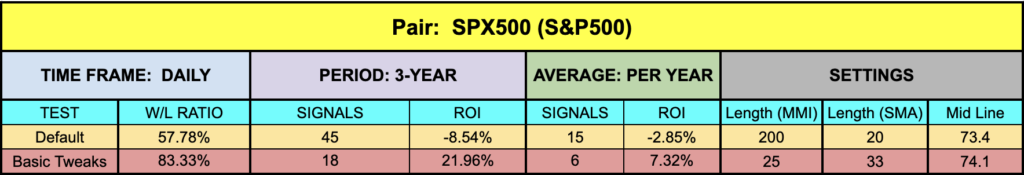
First things first. Remember that a volume indicator is a filter, not a long/short indicator. But, what a nice filter it is. We had pretty good numbers all the way around. All but the SPX500 posted positive numbers on the default settings and it only got better from there.
Resources
You can get this high level trade filter for free and it’ll have “NEW” in red to alert you to its location HERE.. Additionally, be sure you’re subscribed to the Stonehill Forex YouTube channel so you can see how we use it and more importantly, how to test it. The Advanced NNFX Course is HERE to help get you trading, faster.
Our only goal is to make you a better trader.
*Our published testing results are based on money management strategies employed by the NNFX system and depend on varying external factors, which may be different between individuals and their specific broker conditions. No guarantee, trading recommendations, or other market suggestions are implied. Your results and subsequent trading activities are solely your own responsibility.
BTW — Any information communicated by Stonehill Forex Limited is solely for educational purposes. The information contained within the courses and on the website neither constitutes investment advice nor a general recommendation on investments. It is not intended to be and should not be interpreted as investment advice or a general recommendation on investment. Any person who places trades, orders or makes other types of trades and investments etc. is responsible for their own investment decisions and does so at their own risk. It is recommended that any person taking investment decisions consults with an independent financial advisor. Stonehill Forex Limited training courses and blogs are for educational purposes only, not a financial advisory service, and does not give financial advice or make general recommendations on investment.