Things That Make You Go Hmmmm…
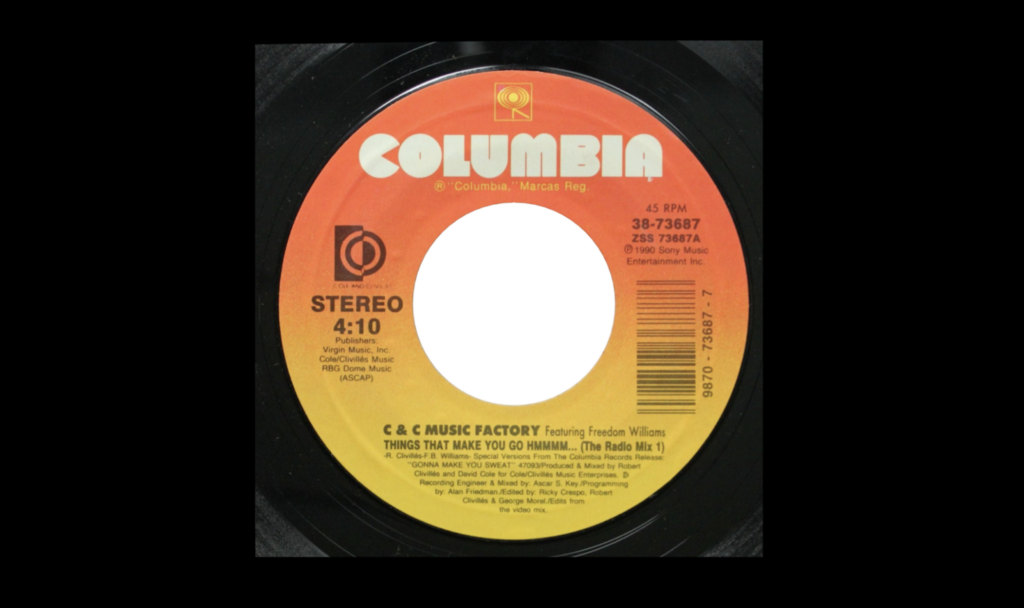
Remember C + C Music Factory? Kickin’ house music from the late 80s and early 90s. Fun stuff, right? This has nothing to do with that. Except for the “C + C” part.
What?
Weird start to a technical forex trading blog. Sorry, not sorry. We need to keep it fresh. After all, who wants to read a boring academic tome? So…we’re referring to two major components of the algorithmic trading system taught through the NNFX (No Nonsense Forex) lens.
Confirmation 1 (C1)
The first confirmation indicator (C1) is sometimes referred to as the “fast” confirmation. By this, we mean that signals appear quicker, because the indicator reacts quicker to price action. Below is a video example of a C1 indicator to best demonstrate what we mean. We’ve sped up the chart recording about 800% to keep things interesting, but the goal is to visually compare the two different types of indicators we advocate using.
Confirmation 2 (C2)
The second confirmation indicator is one which is (relatively) slower than the first one. This combination helps you find higher confidence trades…which we’ll explain further into the blog. Below is an example of an indicator which might fit the bill for a slower C2. The style is the same as the first video…quick and to the point.
Hanging With Us
If you’ve been with us for any length of time, you may have heard us mentioned this from time to time. We wanted to clear up any confusion and miscommunication and will dive in a bit more so you can utilize this stragegy in your algorithm, like…now.
Faster Pussycat
As decribed just a moment ago, one indicator was described as “fast” and the other “slow”, or rather…slower than the other. The generally accepted sequence was to take the faster indicator’s signal before the slower one signal. However, at the end of the day, both have to be in agreement with the rest of your algorithm, so there’s that. We wanted to shed a little light on what the point was of having both indicators.
The Rest of Us
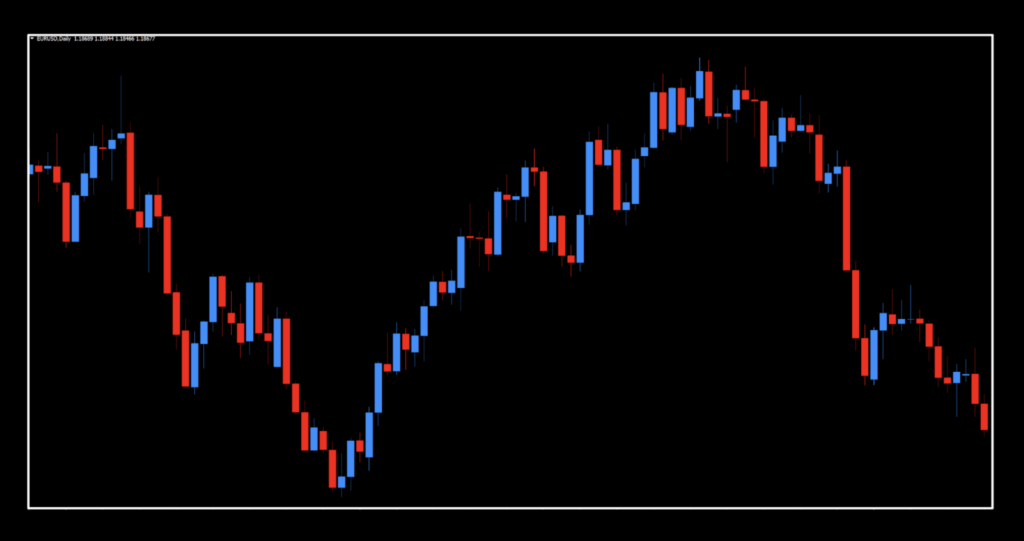
For the rest of us, and especially newer traders, we’ll take a more detailed look at how the set-up works. Below is a chart: it’s not fancy or especially colorful, but it’s the default chart we like to use when we look at indicators. It’s our “random chart” that we picked a long time ago. It wasn’t cherry-picked but rather, had elements of various markets; trending, range bound, dead, and volatile. This way we could see how indicators reacted through those different market characteristics.
Old Standby
No Base…or Treble
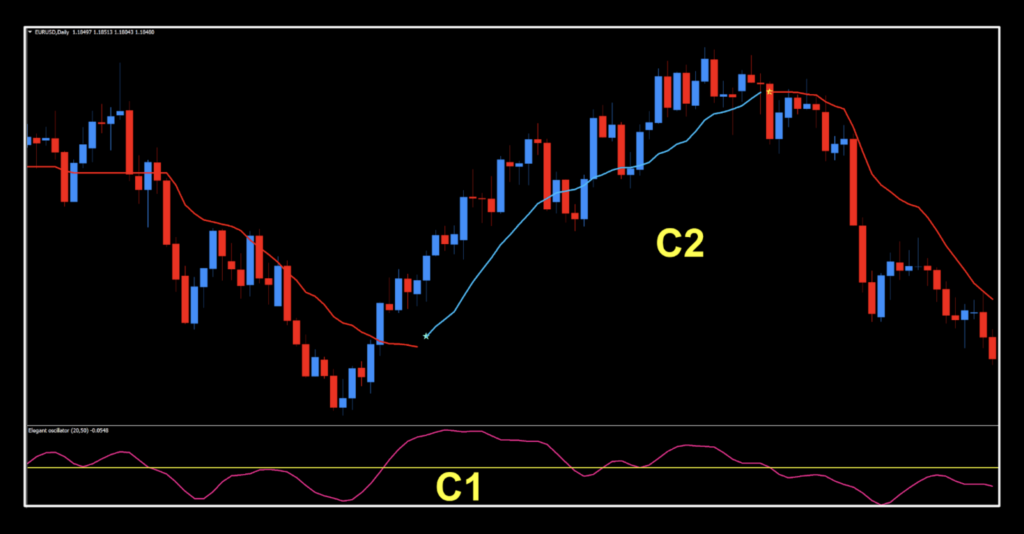
Since this is not about baselines, we’re not going to discuss them or include them in our discussion. We zoomed in a little provide some focus on what we’re talking abot. In the next chart a little further down, we’ll plot a C2 (slower) indicator to help us identify and confirm the trend. For our illustrative purposes, we’ll be using the Coral indicator, which we profiled back in 2022.
No Volume/No Exit
We’re not taking into consideration volume for entries and not thinking on exits as well. We’re just looking at the entry portion of the two confirmations working in concert.
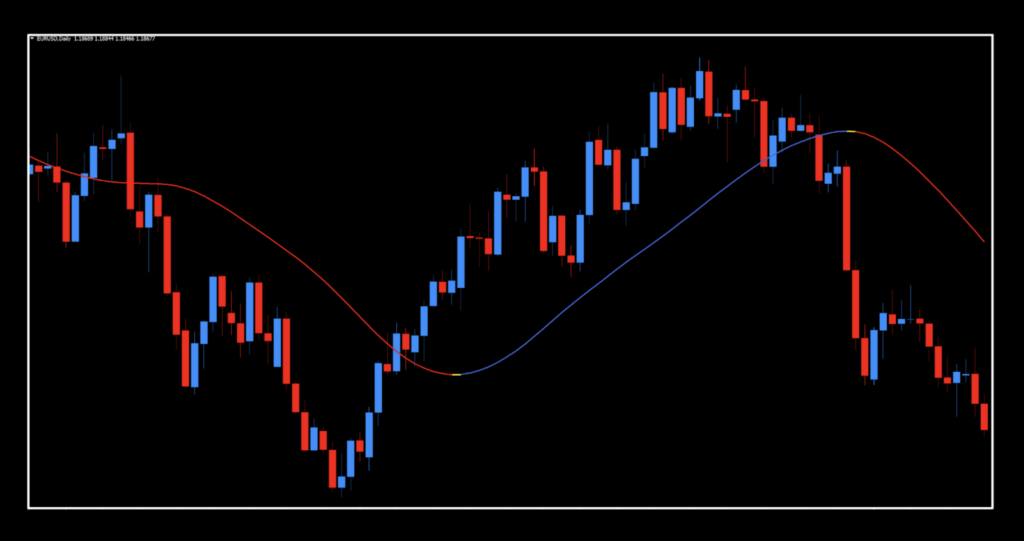
We liked the Coral indicator. Easy to read signals and fun to use. While this appears to encompass longer trend patterns, there will no doubt be retracements, continuation trades, take profit and stop loss levels encountered along the way. This is why we need something faster to help us better pinpoint higher confidence entries.
Math by Any Other Function
 Before we get to the next chart, we wanted to quickly mention a few things. It’s important that you choose confirmation indicators that use “different math”. By that, we mean you don’t want to have two confirmation indicators that rely on (for example) moving averages or other similar math formulas. Cycle analysis, derativates, regression, comparative values, and other types of math should be considered.
You Look Marvelous
Also important, is having indicators that are of a different type. Meaning that if one is a price overlay, try to find something that is a two lines cross, zero/mid-line cross, histogram, etc. I mean, you could have everything as a price overlay, but it gets a bit congested and frankly, having below chart type indicators like a zero cross or midline cross have proven to be quite effective.
Settings
The final caveat we wanted to bring up is that we’re just plopping indicators on a chart using the default settings. Most likely, they’re not the best (or worst), but for our purposes, we’re just illustrating the mechanics of how they work together. Okay, now that’s all out of the way, let’s look at a chart with a C1 indicator added.
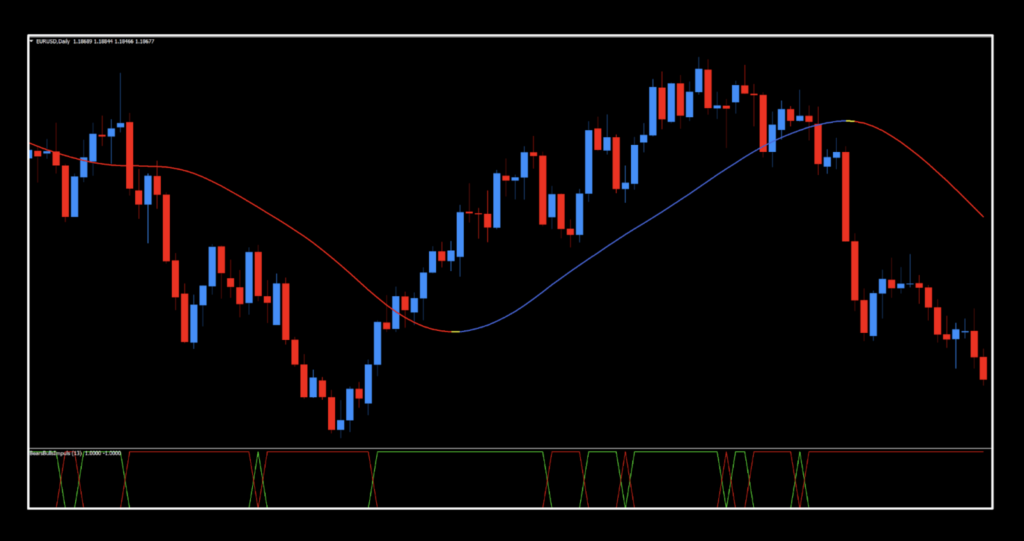
The below chart two lines cross gem is another one we profiled at the end of 2024 called Bears Bulls Impulse.
Marking it Up
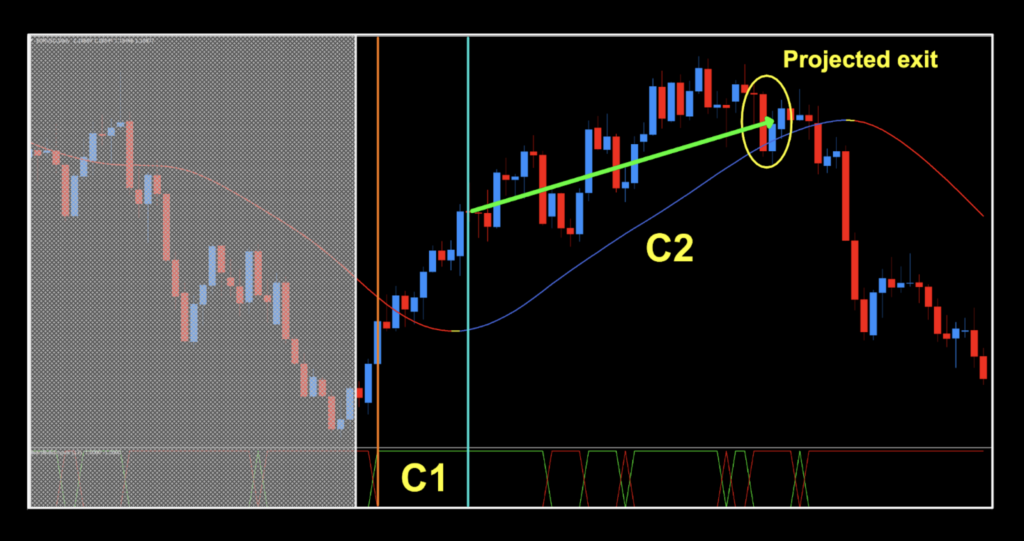
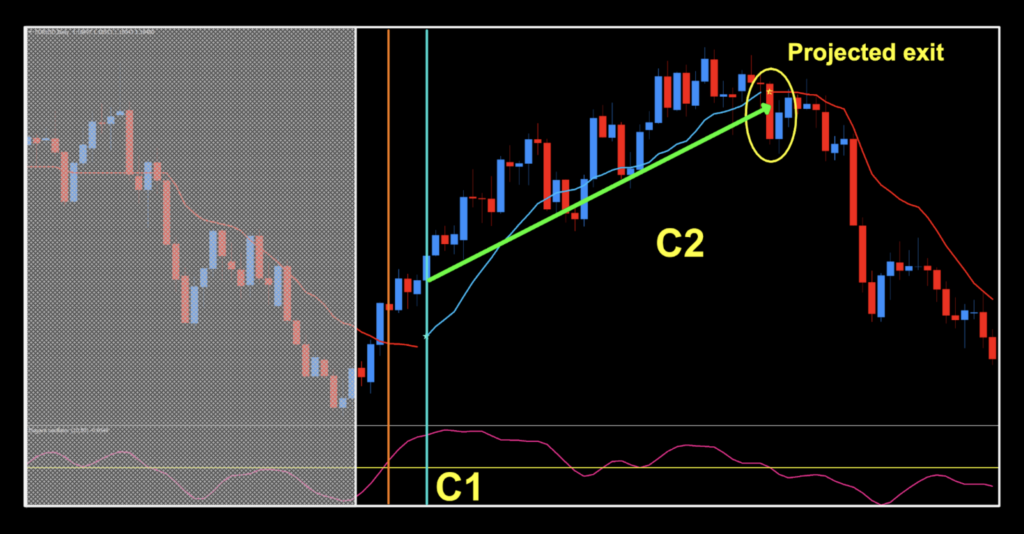
Now, we’ll grey out the chart and concentrate on a single trade by marking up all the signals we see.
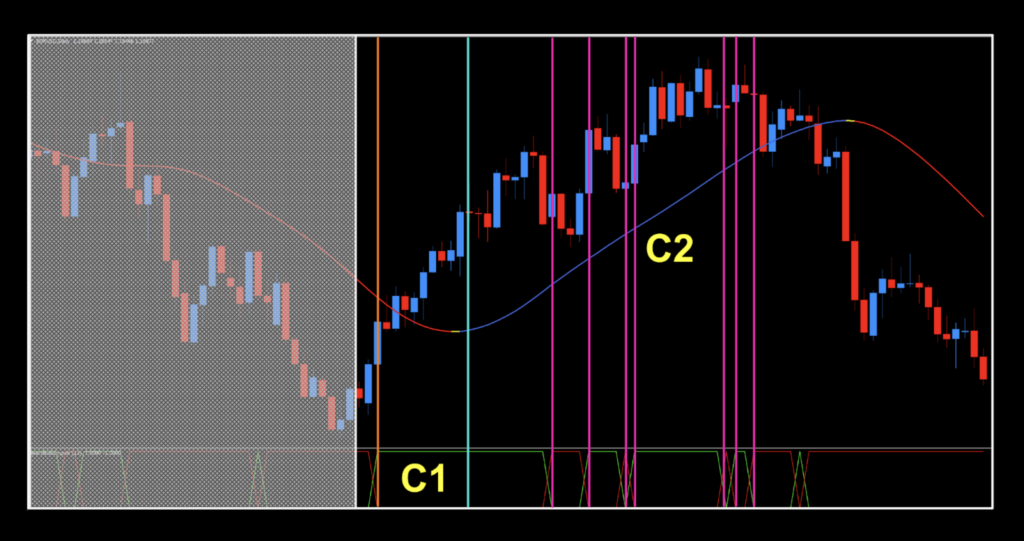
Granted, it looks pretty busy and that’s okay. This is where you need to train your eyes on what’s important. The image below only has the C1 and C2 signals.
By ignoring the subsequent signals given by your faster indicator, you won’t get shaken out of a trade and let the slower indicator provide opportunities for more profits.
Preventing losses
Remember “Not losing is the same as winning”? Preventing losses will definitely help you. It’s so important, there is actually a lesson module in the advance course detailing nothing else but why preventing losses is so critical to your success.
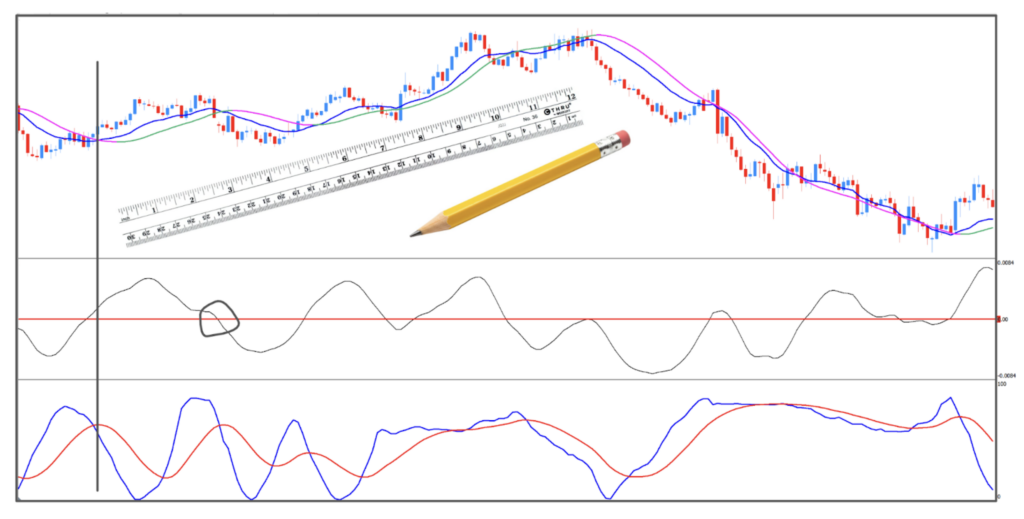
Analog Versus Digital
Finally, we wanted to mention something that goes back to when VP and yours truly started trading. While the digital mark ups are really cool, they take time. In the past, and even now, I printed my charts on a white background which has my indicators darkened to see them and mark things up with a good old #2 Ticonderoga, a ruler, and referencing the on-line chart for pip values. Calculations were done right on the sheet. They became my research “library” and served me well.
Why Not a Second Helping
We’ll provide you a second example with two different indicators. The C1 (fast) is the Elegant Oscillator, which we profiled at the start of 2024. The C2 (slow) is the Bams Bung, which we profiled mid 2025. Like before, we’ll plot both indicators using their default settings. This first image is how it looks on the chart.
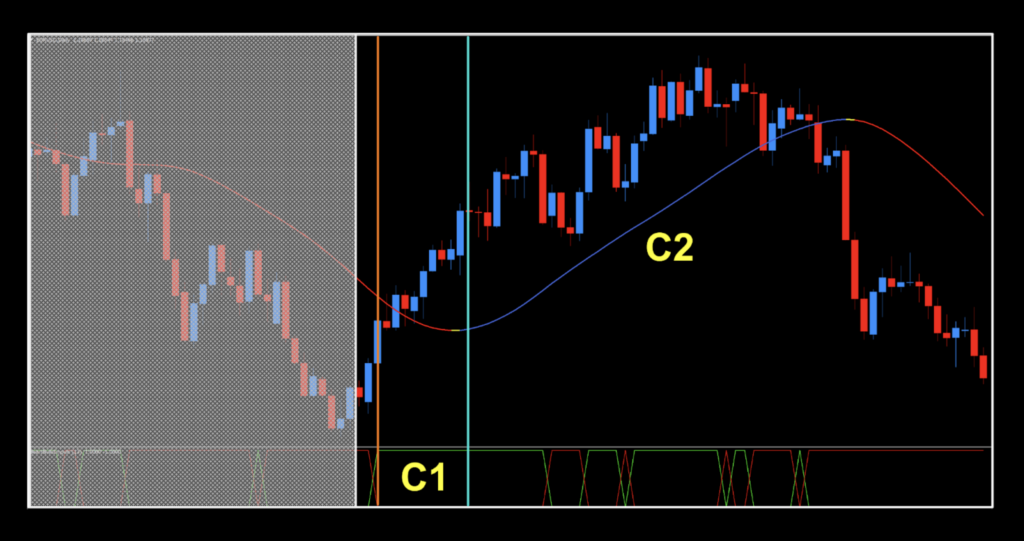
Now, we’ll add our shaded area and signal lines.
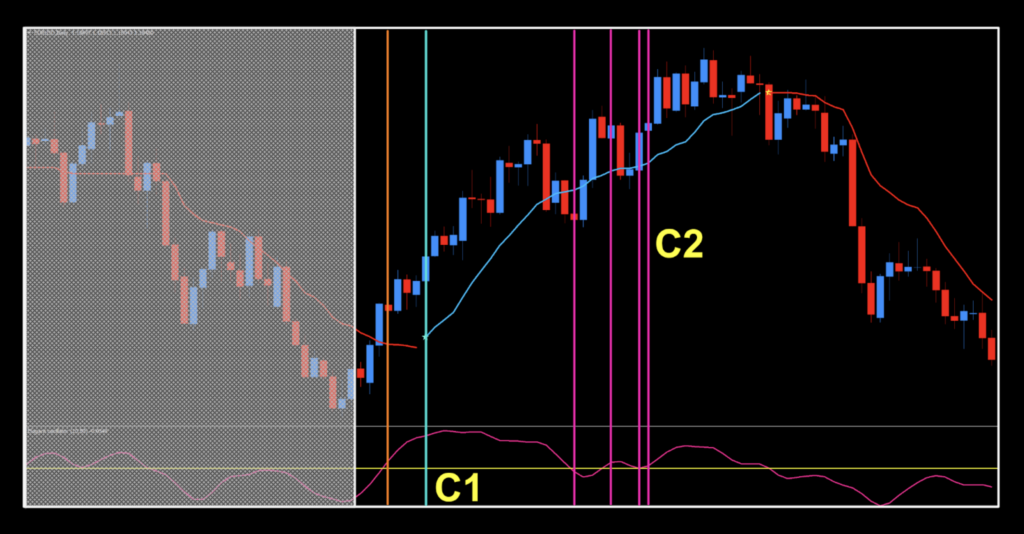
Now, we’ll remove those “extra” signals lines our C1 gave us to see what your trade may have looked like.
And there you have it. This trade was actually better than the first so by trying different indicators to see who plays “better” with another is something to include in the research and development of your algorithm.
Flipside
On the flipside to all of this is can you have too many confirmation indicators? The answer is decidedly; “YES!”. Many years ago when trading 4X was comparable to the wild west, I worked with a guy who had his own system and ran a workshop teaching others how to sell. The interesting thing is that it worked perfectly in hindsite, but not so much going forward. It was (for the most part) a technical system; however, there were just too many moving parts. Below is a sample chart which contained the following indicators;
- Moving averages (3)
- 5 EMA
- 8 EMA
- 21 EMA
- Upper and lower trend lines
- Fibonacci lines & extensions
- Pivot points
- MACD
- Stochasic
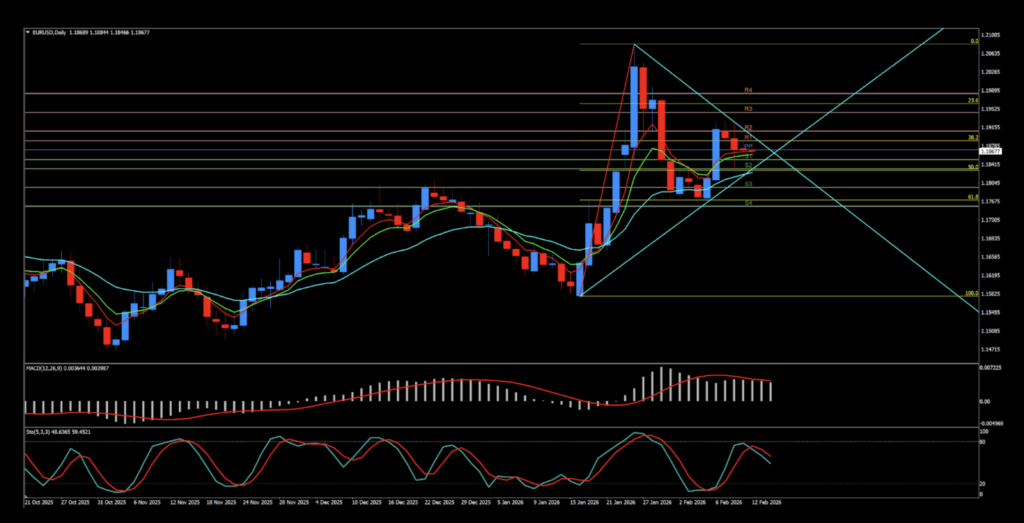
Paralysis
There may have been a couple of other indicators, but at this point, I don’t recall. The premise of opening a trade was built on more degrees of confidence. The more, the better. The problem was that with so many indicators, we all seemed to suffer from something called “analysis paralysis”. Simply put, you would not have the ability to open a trade from trying to make sense of so many inputs.
Why Ours Works
This is why what we do works. If you notice the list of indicators, they’re all older ones from the “boxed set” on MT4, and nothing was optimized for better performance. Our system advocates using an appropriate balance of indicators which are not locked in to using default settings. It’s a better system, with simple rules and proven results.
Resources
If you head on over to the indicator library, you’ll find a great source of indicators to start (or continue) developing your algorithm. Now crack on and come up with your own winning combination of confirmation indicators and show the market who’s boss! Don’t forget to the Stonehill Forex YouTube channel to watch the technical analysis portion of this week’s installment. For fast-tracking your trading success, be sure to consider the Advanced NNFX Course HERE.
Our only goal is to make you a better trader.
*Our published testing results are based on money management strategies employed by the NNFX system and depend on varying external factors, which may be different between individuals and their specific broker conditions. No guarantee, trading recommendations, or other market suggestions are implied. Your results and subsequent trading activities are solely your own responsibility.