 We’re Back
We’re back with new material for the new year after a short break from all the action. Additionally, we’ve been busy researching, writing, testing, coding, and investigating all that good stuff out there as we strive to bring you nothing but the best. Fresh, funny, and festive. That’s us. Just ask our agent, Phil “the pill”. He thinks we’re a barrel of laughs.
Bonus
As this is the first blog in a while, we’ll also include a few psychological concepts stemming from recent emails that touched upon some rather significant items. These affect us all. It’s not that long of a read, and it can only help. Stay with me…
Mail Call
We received an email not too long ago from an English gentleman named Marcus who hails from Oxford (just outside London), and was very interested to know if inertia was a “thing” in the markets. A legit question and one that impacts this indicator installment. So naturally we responded with a brief definition of what Sir Isaac Newton discovered and published as the 1st law of motion, defining inertia.

We explained that market price might be considered an object in space and the market forces (big banks, institutional traders, war, economic events) all worked individually and collectively to change the speed and force of price.
Why It Matters

The hidden “lesson” here (and what we constantly preach) is that we, the very small group of retail traders, have no real effect in moving the market(s). Trying to guess what happens next is just a crystal ball, fortune cookie, tea-leaf, chicken bone kind of fancy.
Technical
So we remain technical traders at heart, reacting to price movement as it, too, reacts to market forces by only trading what we see. I know this sounds like a broken record to you seasoned NNFX/SHF card-carrying members, but it needs to be repeated from time to time, especially to newer members — which reminded me of another email from recent past.
Giving Up
The second email came from a long time member out of Melbourne, Australia. He bought the course a couple of years back, and we’ve engaged an active email discussion over the years (he’s written us 24 times). He had become disheartened because things weren’t working for him the way he initially thought they would.
Having Faith
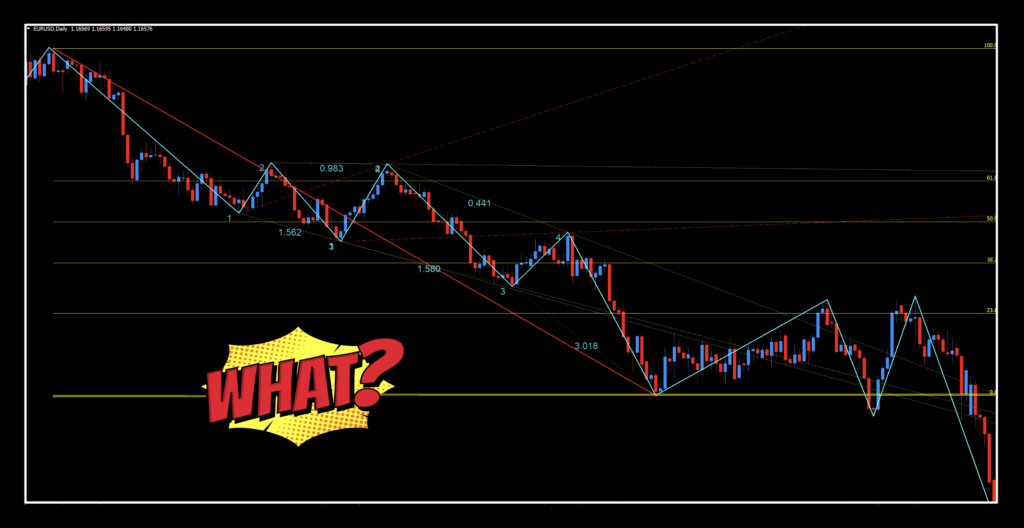
He mentioned wanting to try pattern trading tools, including Elliott Wave Theory or Market Patterns. He asked if it seemed a viable alternative to how we trade, but was at a loss if they were better and how to proceed. His algorithm wasn’t producing results he had hoped for, the indicators within the algorithm didn’t really seem to work well together. All these things (pros — us/cons — them) have been discussed by both VP and yours truly at different times under different titles.
What Was Suggested
Clearly, he was not sure what to do, so we made him a list. Here it is in its unedited form.
- Review the rules of our trading style if you’re not sure.
- If you have any doubts of how to use the tools on the MT4 platform, become proficient at that (opening/closing/adjusting trades).
- Consider watching the course again. Putting fresh eyes after taking a break can open your mind to seeing things differently or create understanding of where it may have been missing.
- Go back to testing indicators. Keep a good journal. Back test and forward test them. Keep a good journal. Did I mention to keep a good journal?
- Rethink your algorithm. Remember, not all indicators “play nicely” with others. Look through all the work we’ve done. Watch the exit indicator series I made for additional help. With all the indicators we’ve profiled, there are millions of possible combinations — this is where the real work is. Make multiple algorithms.
- Be sure you’re using the proper risk profile; i.e., 20:1 leverage and never risk more than 2% of your account balance at any given time. Slow and steady wins the race. Many people think they’ll be living the high life within a few months on a $250 account balance.
Bottom line…do not throw any additional money at the market until you can prove consistent profitable results. The market will be there waiting for you with open arms and will happily take your money.
Getting Back to Basics
The message was all about getting back to basics. I haven’t heard back yet, but I am looking forward to hearing from him.

One of the first things VP alludes to is that over 99% of traders fail. Working through the NNFX system may help you be part of the 1% that finds success. It takes commitment, following rules, and staying relentless. Now that we’ve taken a short journey which seemed apropos for the new year/new beginnings, let’s mount the off-road tires and get into some dirt.

2026 — First Up
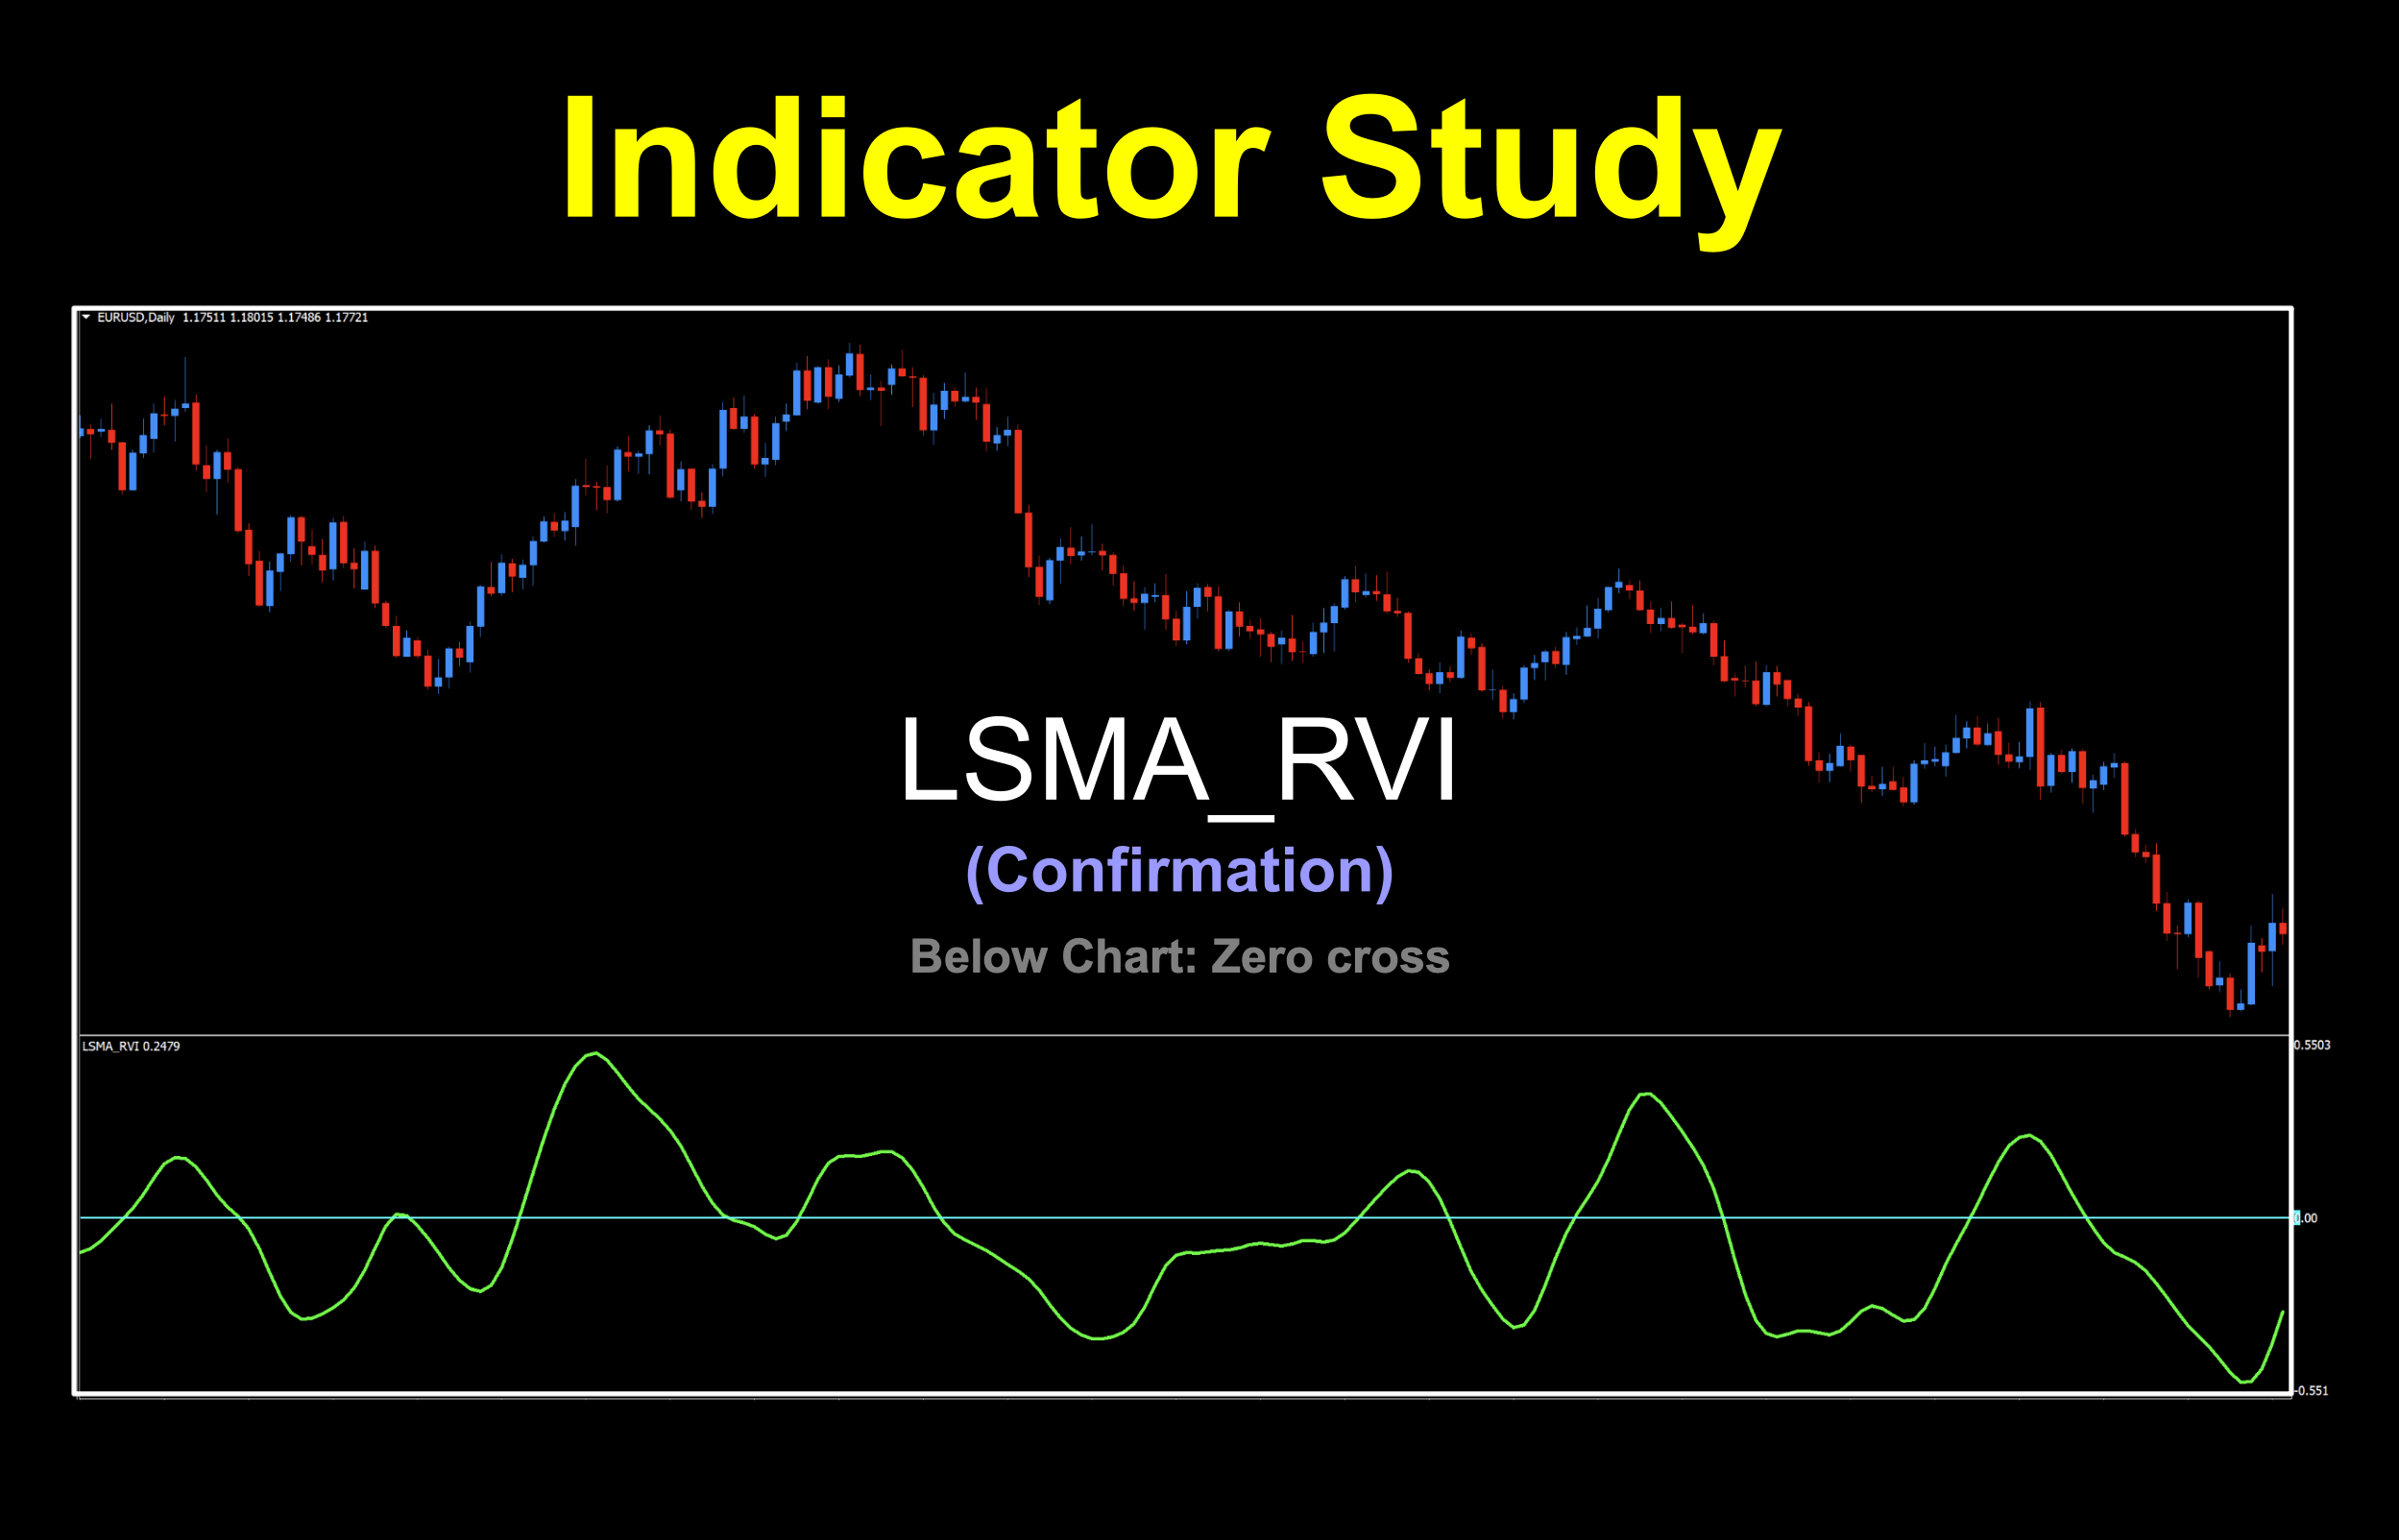
For our first installment of 2026, we’re going to cover a mash-up of two indicators; the LSMA — Least Square Moving Average and the RVI — Relative Vigor Index. Some have attributed some similarities to other indicators, which we’ll mention shortly. This mash up was coded back in 2009 as a request from a guy who wanted the following formula turned into an indicator.
Inertia = LstSqrMA(RVI)
A few things that popped out at us were;
- This is about inertia — something we’ve discussed elsewhere and mentioned earlier in this blog.
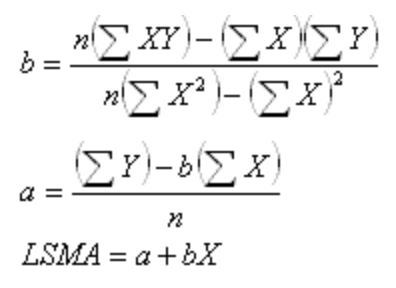
- This uses a linear regression value to alter RVI and…
- The concept was based on an older indicator by a guy named Donald Dorsey, who devised the Dorsey Inertia Indicator, which was first described in the September 1995 issue of Stocks & Commodities Magazine.
By the way, we profiled the Dorsey Inertia Indicator about two years ago, which you can read about HERE and watch the technical analysis video HERE.
Simplicity
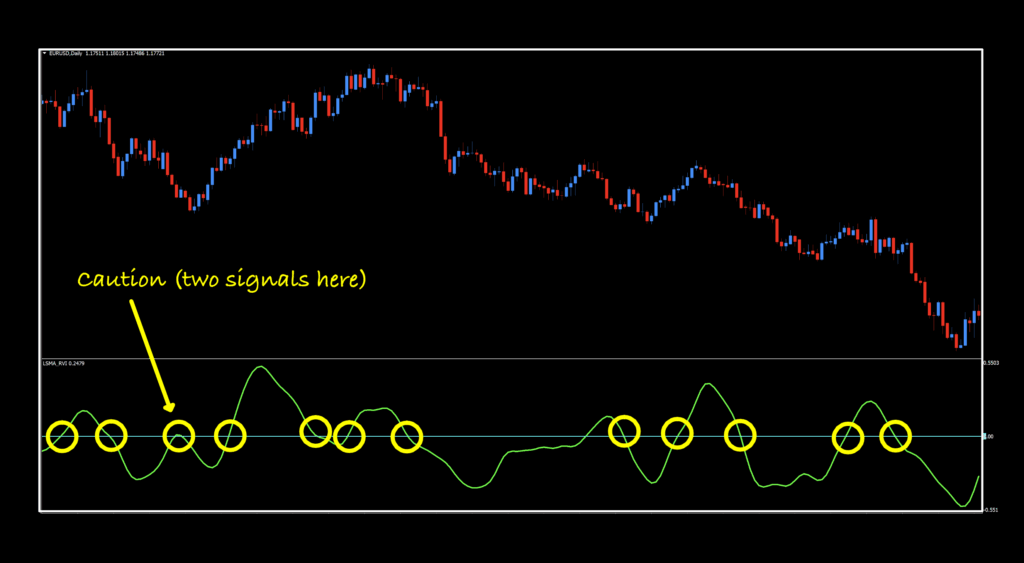
For simplicity’s sake, that mess of algebra above comes to us as a pretty curving green line, crossing over another pretty straight line. This makes our indicator a below chart, zero cross, which can be deduced to two decisions; long or short. Gotta love it. No stressing over a lot of static. Let’s take a look at the default view with a few color tweaks.
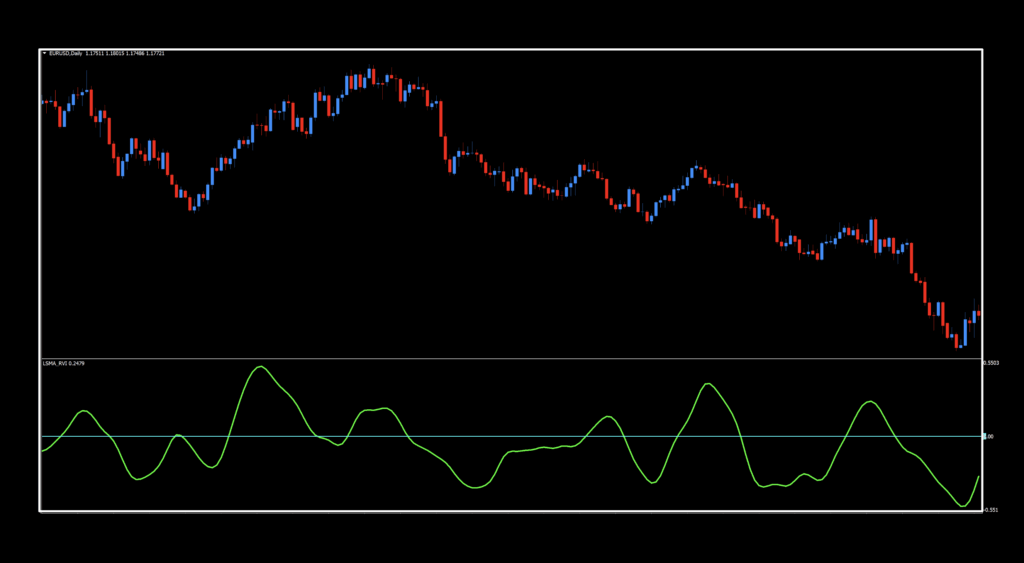
Not too shabby on the default settings. It reacts reasonably well to directional change without whipsaws. The one curious “moment is that quick long/short signal on the left side of the chart, as noted below.
Once you’re ready to perform daily maintenance on your trades during the last 20–30 minutes of the trading day (1700 New York time), you’ll be presented with one of four options.
- Opening a trade.
- Closing a trade
- Maintaining a trade; i.e.
- Moving a stop loss level.
- Exiting a trade.
- Taking a pass (nothing to do).
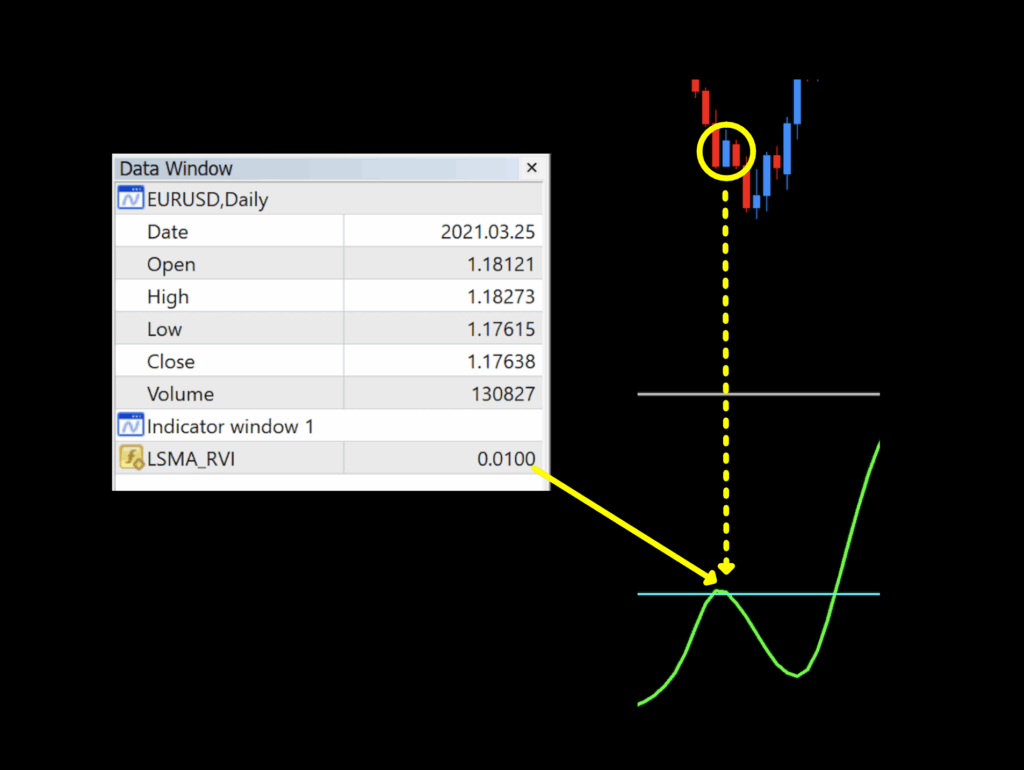
Remember, if visual signals are the least bit vague, be sure to use the “Data Window” tool (that bullseye looking thing in the toolbar) to get confirmation as depicted below. It’s interesting to see how inertia changed on that one long candle before resuming its original path. Had you not jumped the gun, the move between the top of the long and the bottom of the swing low was 103 pips. The possibility of adding a little more cushion to your account was there. Hey, that’s a Money Management moment for you. We’re covering it all today…
Settings
This indicator has two settings and, coincidently, one affects the LSMA and the other affects the RVI.
RVIPeriod: Adjusts the value of the RVI in the overall calculations. The default value is 10.
LSMAPeriod: Adjusts the value of the LSMA in the overall calculations. The default value is 14.
Compare/Contrast
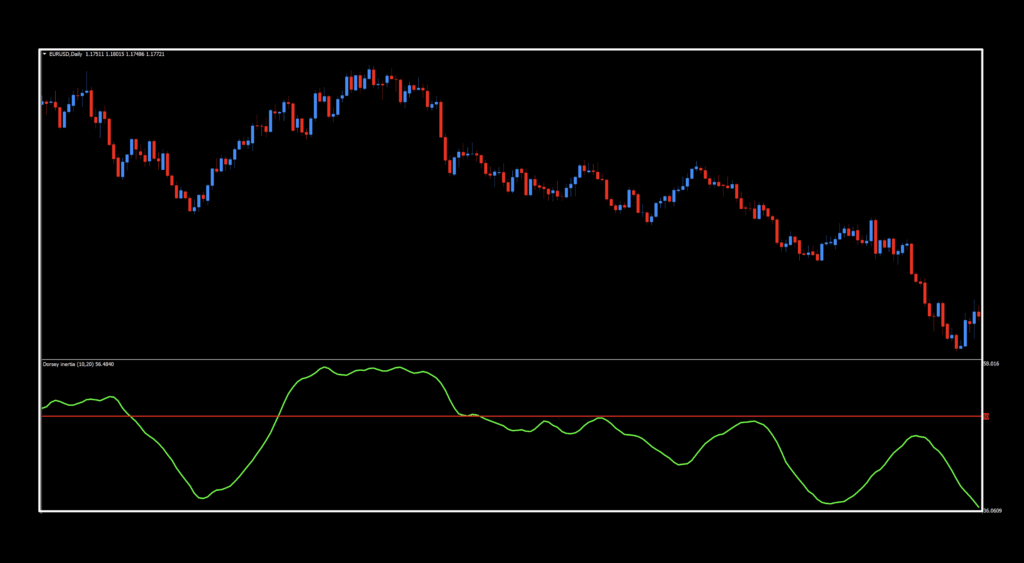
Just for comparative purposes, we’re including the Dorsey Inertia Indicator below to see how they match up. We’re just a curious as you all since a few folks thought they were similar. While it is a mid-line cross, it works the same way as a zero cross; above the “50” line for a long signal and below it for a short signal.
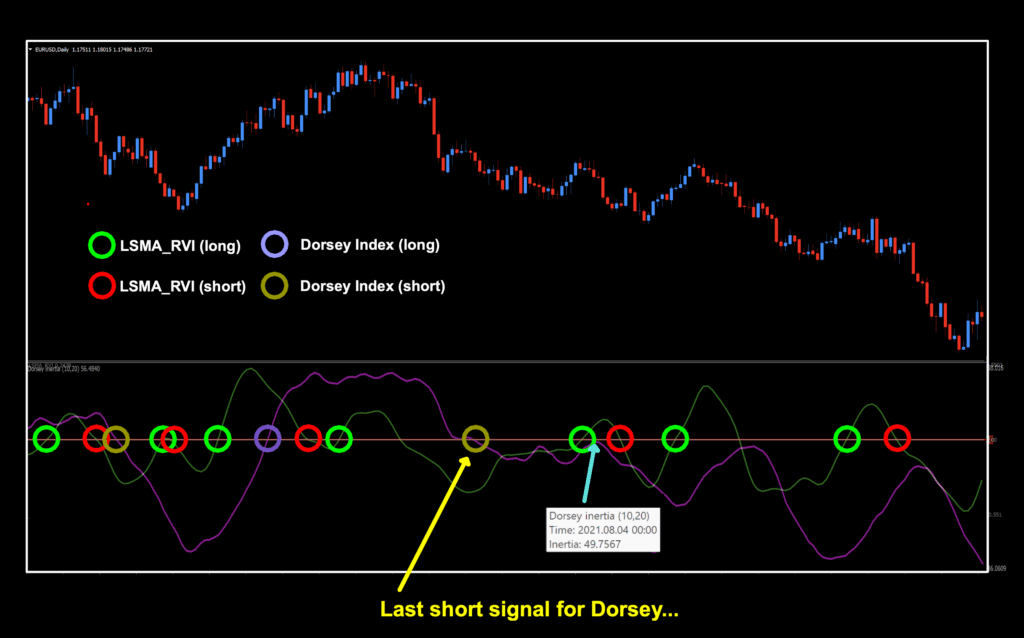
Creative License
Below, we took a little creative license and overlaid both indicators, adjusting the scale. The Dorsey Index appears to be a lot slower. Who knows, maybe you could try using one as your C1 and the other as your C2 and see how things play out. Note that we verified the Dorsey Index (look mid-chart) to ensure there wasn’t a long signal. You have tools, use them…after all, that’s the name of the game here. Nobody puts Baby in the corner. Now, get your dance on.
Back to Civilization
That was certainly a foray into the woods. You should know by now we don’t just give you the Cliff Notes version of indicators, we bring you the whole enchilada. But the time has come to get into our testing data. This is where the rubber meets the road and all bets are on the table. Let’s see what we can see.
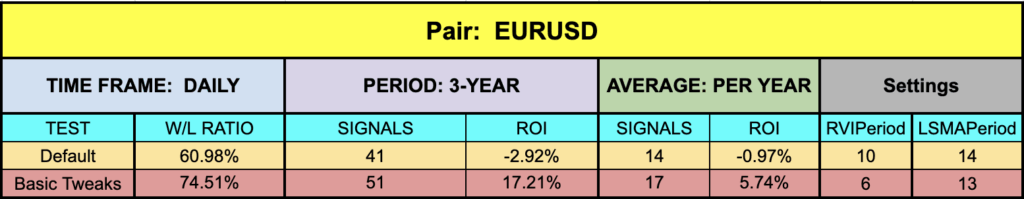
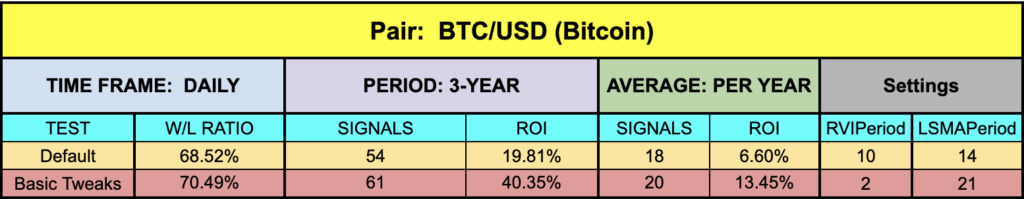
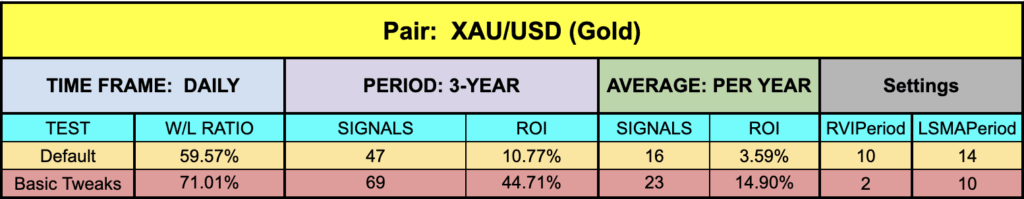
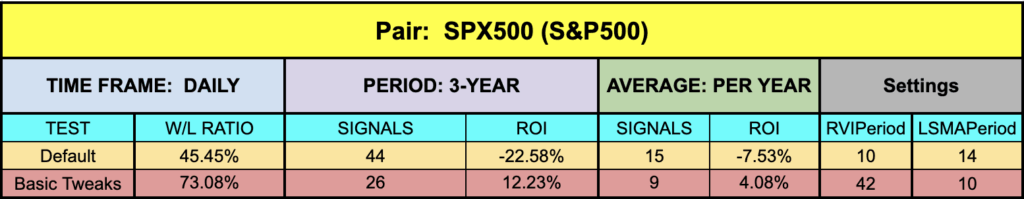
Not bad. XAU and BTC pulled off some pretty good numbers, and even the number of trades increased nicely. The EUR was batting around average and the SPX trailed somewhat, which we expected. Remember, these are just random choices from our optimization tests to see if we can make these better. We don’t post best, middle of the road, or worst.
Resources
The LSMA_RVI indicator is available in the Stonehill Forex library for free and will have “NEW” in red to alert you to its location. Get it HERE. Be sure you’re subscribed to the Stonehill Forex YouTube channel to watch the technical analysis portion of this week’s installment. Get your trading to the next level by signing up for the Advanced NNFX Course HERE.
Our only goal is to make you a better trader.
*Our published testing results are based on money management strategies employed by the NNFX system and depend on varying external factors, which may be different between individuals and their specific broker conditions. No guarantee, trading recommendations, or other market suggestions are implied. Your results and subsequent trading activities are solely your own responsibility.
BTW — Any information communicated by Stonehill Forex Limited is solely for educational purposes. The information contained within the courses and on the website neither constitutes investment advice nor a general recommendation on investments. It is not intended to be and should not be interpreted as investment advice or a general recommendation on investment. Any person who places trades, orders or makes other types of trades and investments etc. is responsible for their own investment decisions and does so at their own risk. It is recommended that any person taking investment decisions consults with an independent financial advisor. Stonehill Forex Limited training courses and blogs are for educational purposes only, not a financial advisory service, and does not give financial advice or make general recommendations on investment.