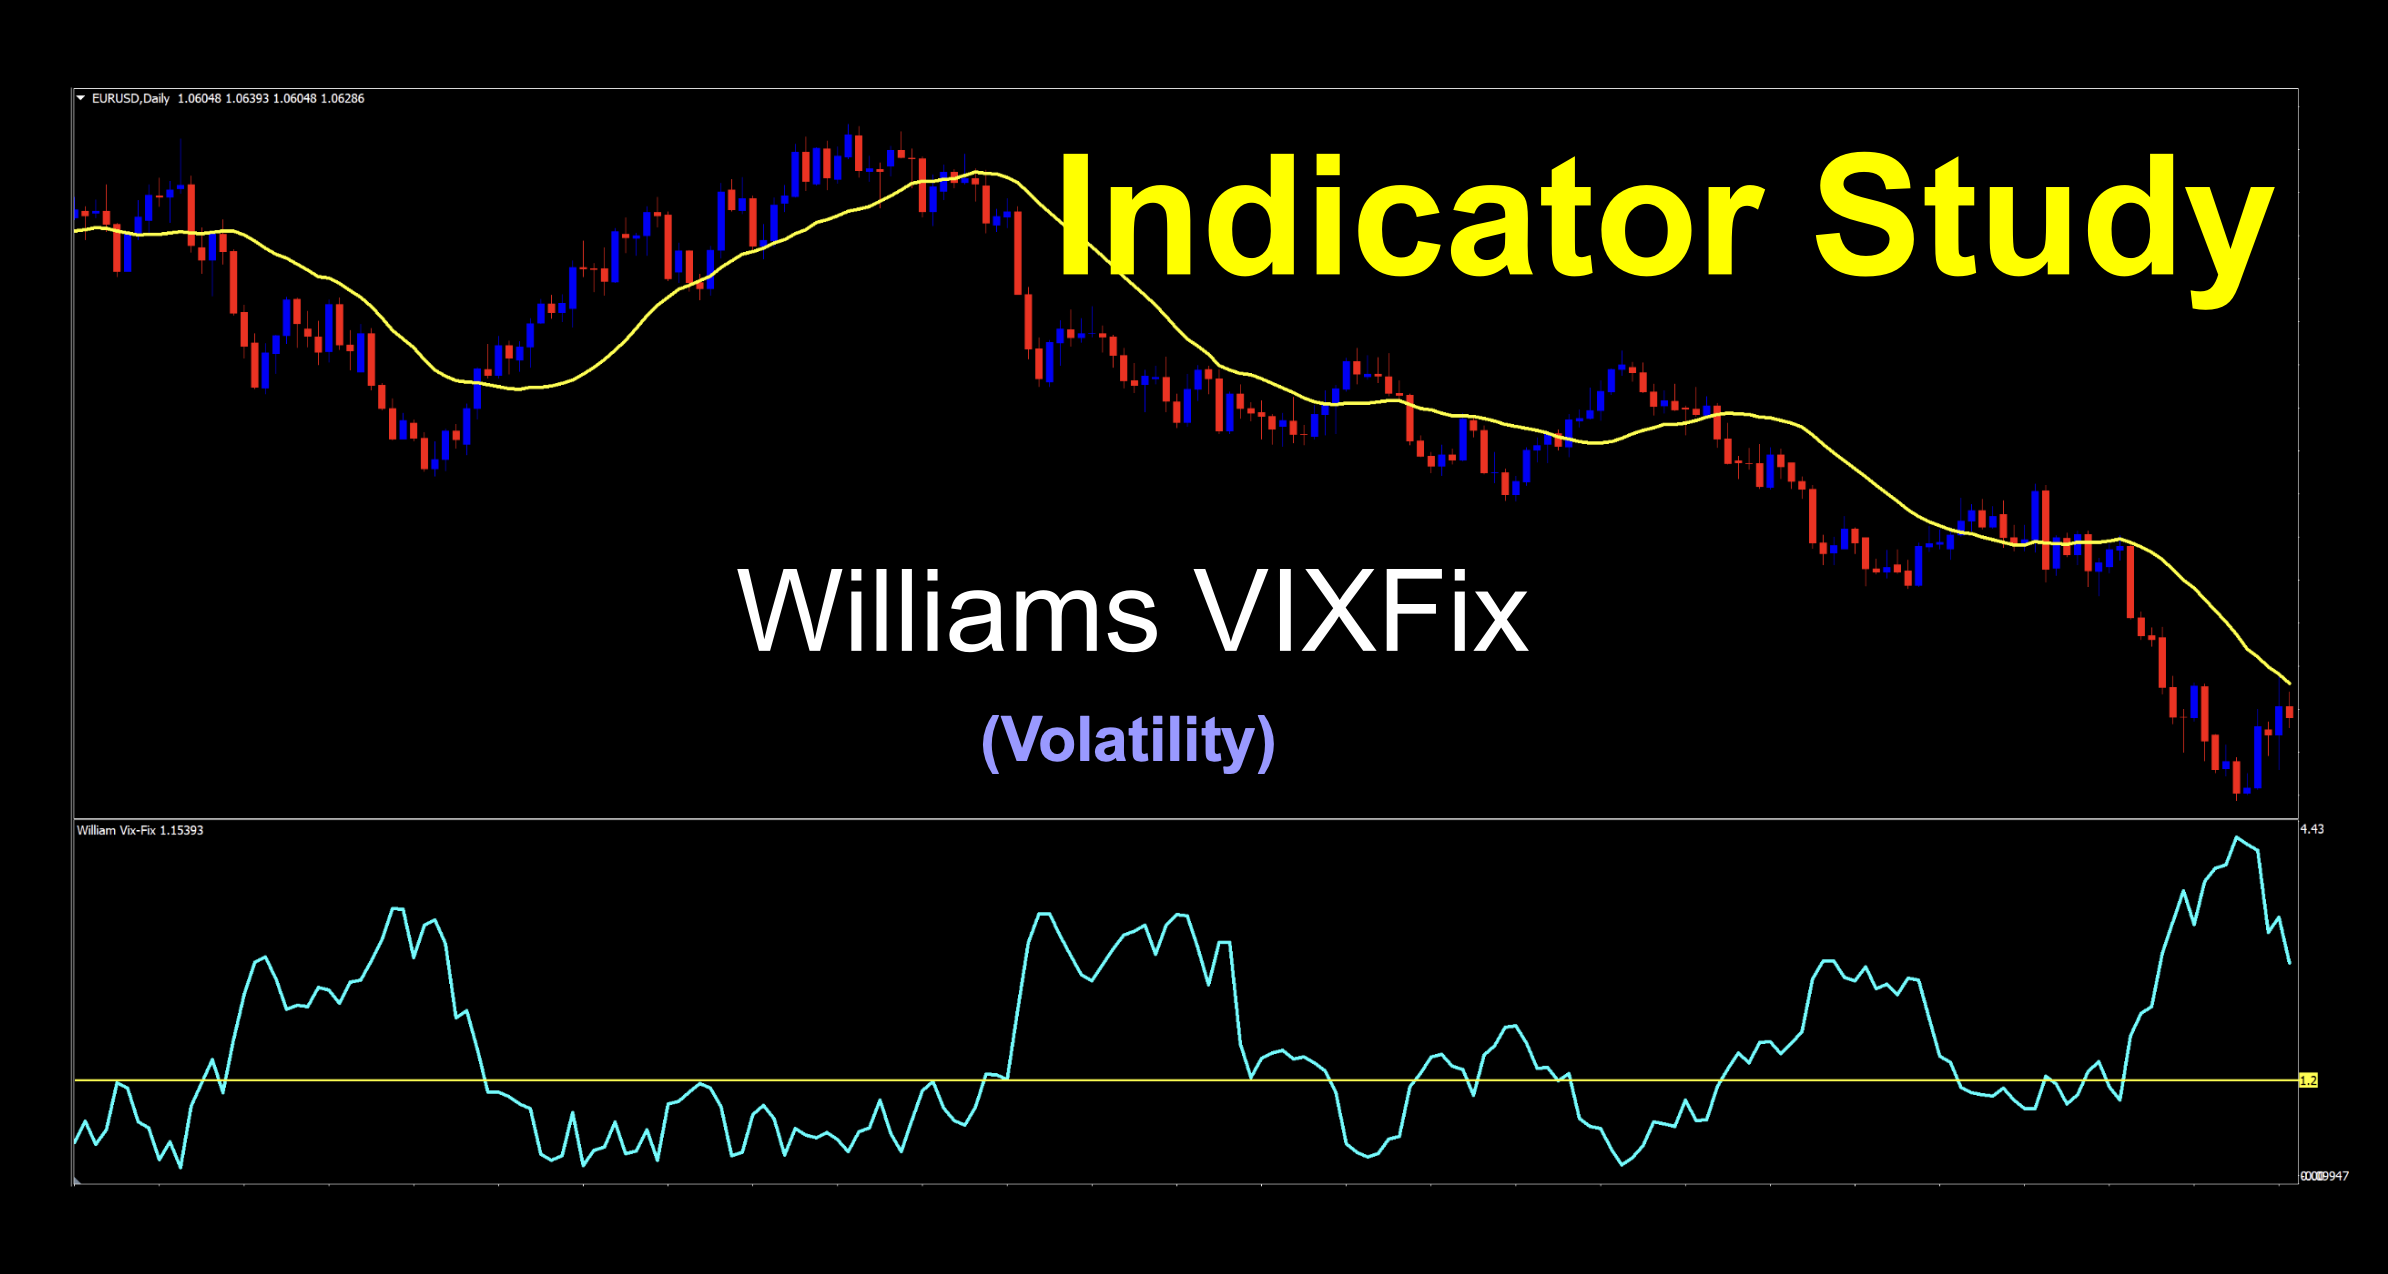
Williams VIXFix
If you’d like to follow along with the e-book version of the blog, click on the play button in the audio player below (at the bottom of the page).

Won’t You Be My Neighbor
Having a trading friend could be your best neighbor…or your worst, depending on the type of relationship. I had a trading friend back in the early 2000s. We spent a lot of time noodling with charts, trying out new indicators, and chasing rainbows. We never really made any significant money, but we had fun. There are a few “neighbors” in our world who we can make money with, and perhaps we’ve found one this week. So clear a spot on your couch for a guy who keeps good company.
It Takes Two
Last week, we tried something a little different with respect to gathering our technical analysis data, and we think it worked out pretty well. We also didn’t tie up one of our computers for eight hours, another bonus. This week, we’ve got an indicator which requires a partner to better demonstrate how it’s used. We’ll get into that shortly.
No Stamp Required
Sending us ideas, indicators, questions, comments, and even assistance doesn’t cost anything. With just a few keystrokes, we get to know what’s on your mind. We appreciate that. We had an email this week which prompted a long chat with VP regarding the very item we’re going to be investigating this week. Please keep sending those encouraging communiqués our way to stonehillindicator@gmail.com. We look at every keystroke.
We Got The Fix
If you recall from some time ago, a trading tool was brought to light which gave us retail traders a peek into institutional level market volatility. That tool was called the VIX, otherwise known as the Volatility Index. Before we get into the indicator itself, let’s take a quick moment for a mini lesson. This is for newer traders, or those who just want a refresher. You experts can do breathing exercises, or something.
Vicks or VIX

Not to be confused with Vicks, The VIX is a real-time index introduced in 1993 and belongs to the Chicago Board Options Exchange (CBOE) which measures the 30-day forward market expectations for near-term price changes of the S&P 500 Index. For us traders, that means the higher the number, the more market volatility, the lower the number, the less interest. We want high numbers for better trading opportunities. If you’ve consumed the NNFX material, you’ll know that this is the first thing you want to check before going forward with a trade.
How Convenient
What if…what if, there was an indicator that could help us understand what the big picture was, right on our chart? Wouldn’t that be awesome? Well guess what. We found something that just might help you with that. Through an email dialog with Dennis B., one of our community members, he suggested an indicator from an exceptionally well known guy named Larry Williams. Yes…that Larry Williams. The “Williams %R” indicator, Williams. The guy who has his own template on the MT4 platform. That suggestion led us down a rather interesting path. Let’s see what Mr. Williams has for us today.
What’s Your Fix
What we’re showcasing this week is called the Williams VIXFix Indicator, from an article written by the man in 2007. It’s been covered numerous times in various forms and fashions by others, but the indicator we’re using was coded in 2015.
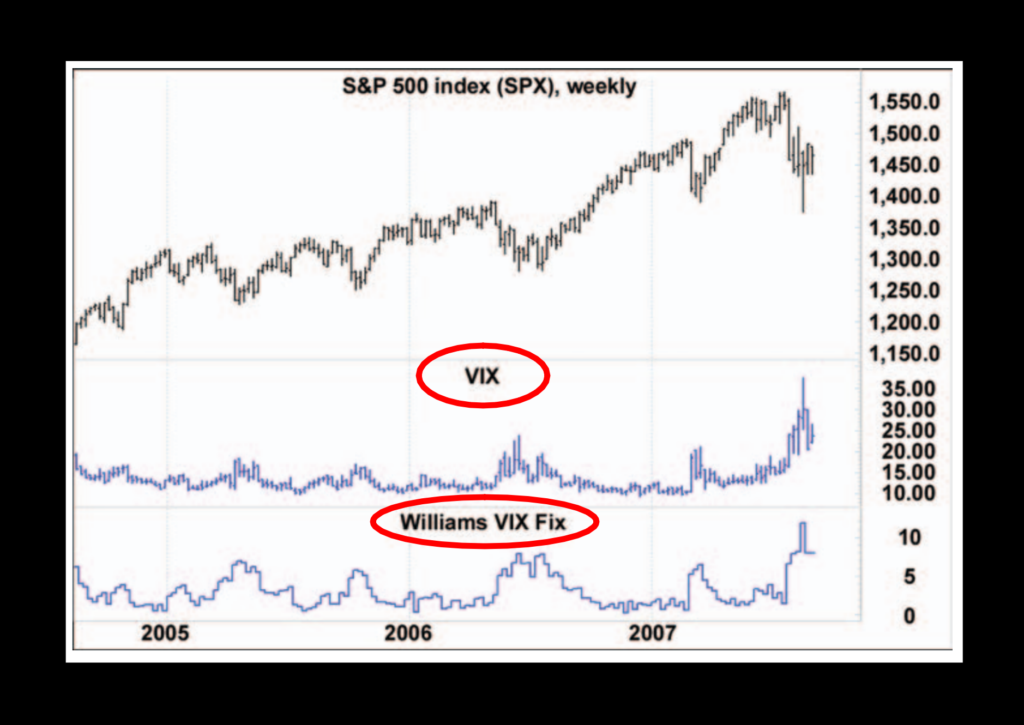
So, What is it?
The Williams VIXFix indicator is a “synthetic” interpretation of the actual VIX. Numerically, it calculates the difference between low price deviation from highs within a specified period. We ripped an image from the article demonstrating the VIX compared to the Williams VIXFix. It’s pretty accurate.
Category Allegory
Now, how do we classify this indicator? It kind of looks like a single level cross confirmation, which you’ll soon see. But, it’s not. Remember the function of the VIX? It’s a “go or no go” situation…what your volume/volatility indicator does. There, and now you have it. That’s how we’ll classify it. A volatility indicator because, that’s what the title tells us. VIX = Volatility Index.
Provocative Pixels
When we loaded up the default view, it was very difficult to imagine that it would be helpful in its native imagery. Want to see it? The signal line is actually a red oscillating line below the chart. Not very helpful here…
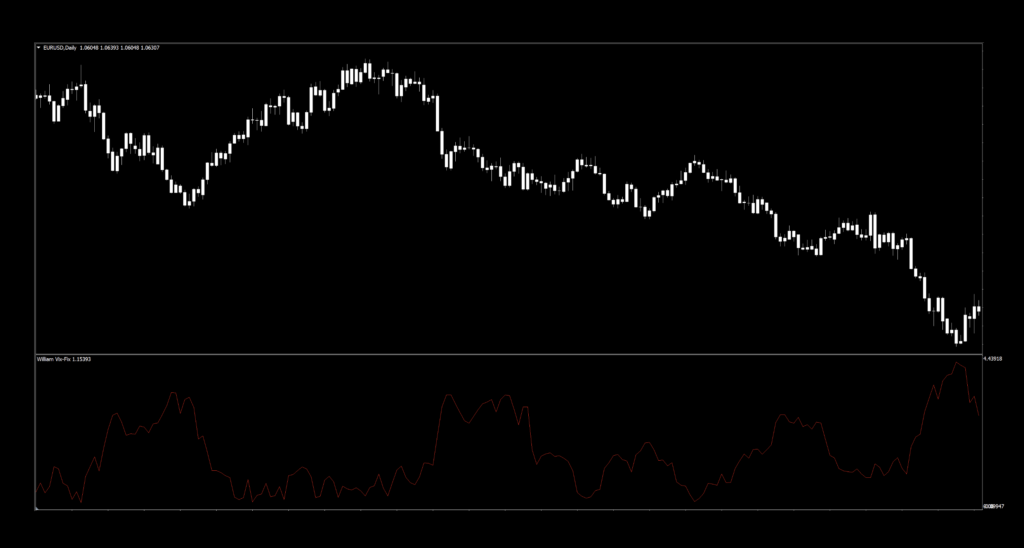
Not easy to see, at all. So, we always do what we do. We change colors, thicken up the lines, change candle colors, add various components and voilà, easy to see. Like this.
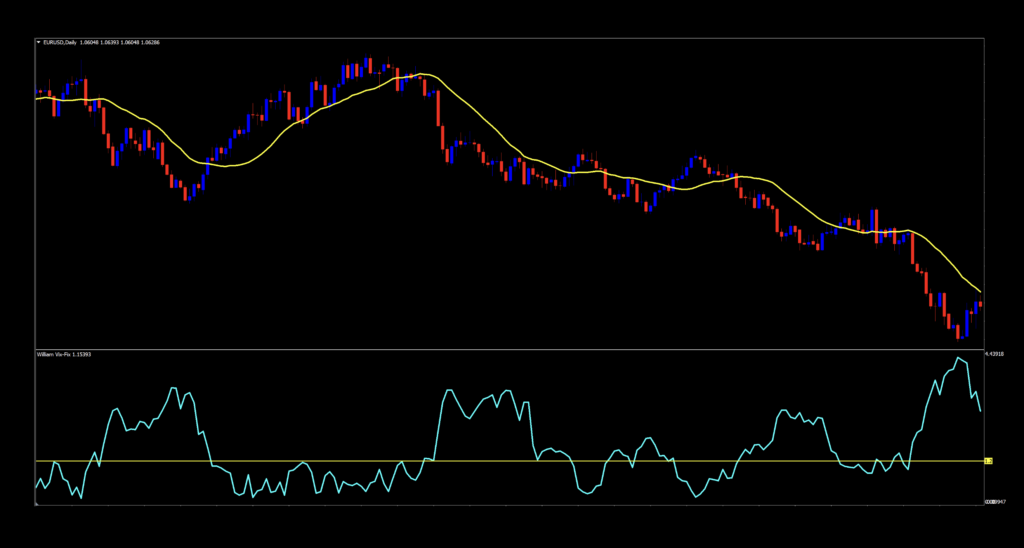
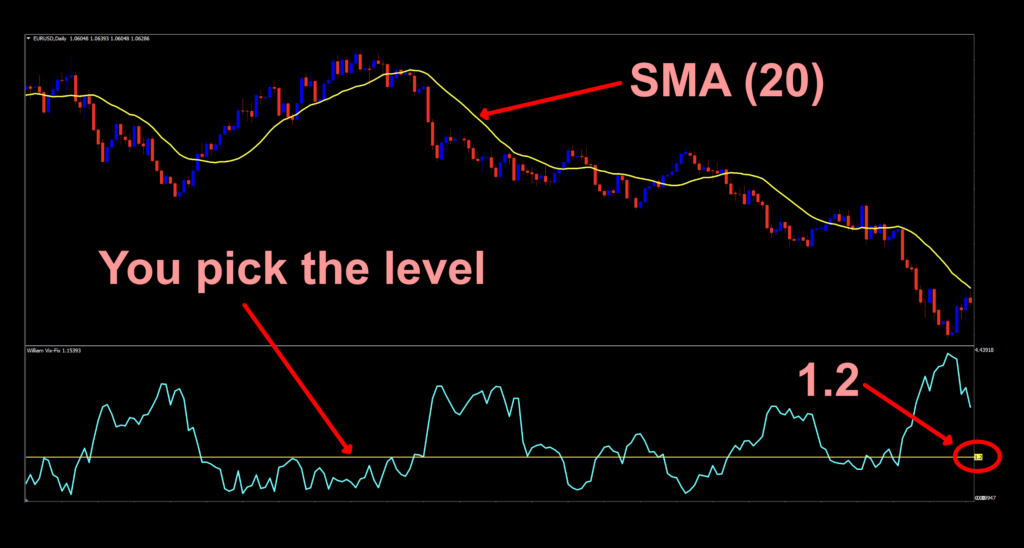
Isn’t that better? Now, you may ask yourself, “What is yellow line over price”. Fair question. Those of you who have been following the series already know. I can see you smiling to yourself because you know what’s coming. If you’re new, what you see is the SMA (20), or the Simple Moving Average Line (20 period). The reason for that line is that we need something to provide context to the volatility, you know, like a trade signal.
Don’t Gotta Be
Does it have to be the SMA(X)? Not hardly, friends. You use whatever you have in your own algorithm, or testing indicator. It can be a baseline or a confirmation indicator, or any combination of more than one, which is actually how to use it.
What’s the Other Yellow Line
Another great question! That horizontal yellow line in the indicator window is what we affectionately call a “threshold level”, meaning that if the Williams VIXFix is above it, there is sufficient volatility in the market and subsequently, if it’s below that level, then sit on your hands for the moment. The best catch is, you get to adjust that level. It doesn’t have to be a numerical average of the top and bottom like a mid-line cross, which is why we call it a single level cross.
Let’s get to the settings. Happily, there is only one. Although, there is a second setting that we’ll get to momentarily.
Settings
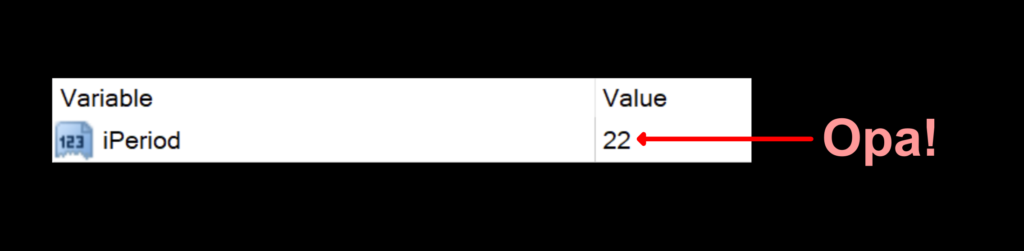
iPeriod: This number determines the number of look-back periods for the indicator’s internal calculations. The default setting is 22.
The Other One
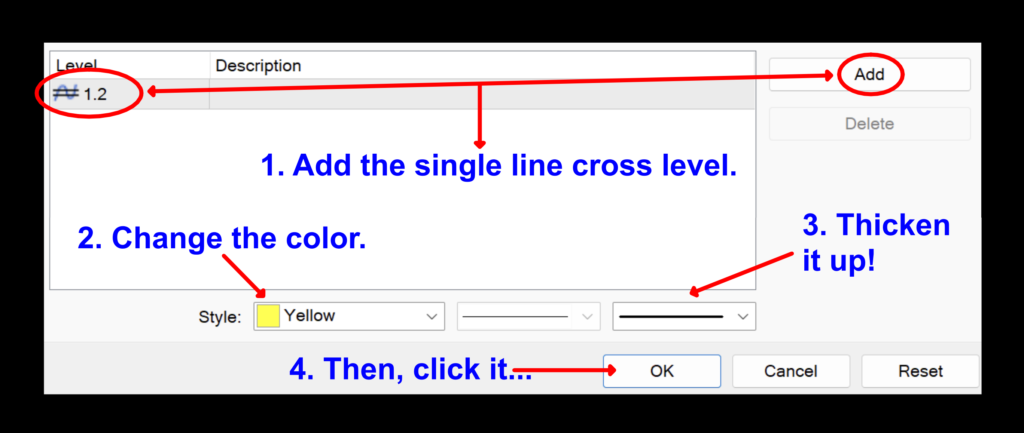
We mentioned a second setting. That setting is your “threshold” level, i.e., the single line cross aka, the yellow line. We need to put something in for that value, so we have a visual of when to enter a trade, if all other conditions are met. That can be found in the “Levels” tab of the settings menu.
Advantages
* Has a “cool” factor with a major tool on your charts.
* Simple settings for quick adjustments.
* Instantly provides graphic illustration of market volatility.
How We Use It
The purpose of this indicator is to identify sufficient volatility in the market. It does NOT provide long or short signals. Make sure your brain understands that we’re looking for “Yes – trade”, or “No – wait”. Remember, that’s the reason for a volume/volatility indicator. We’re only interested in a trade if the blue volatility signal line crosses above the yellow line.
Addendum
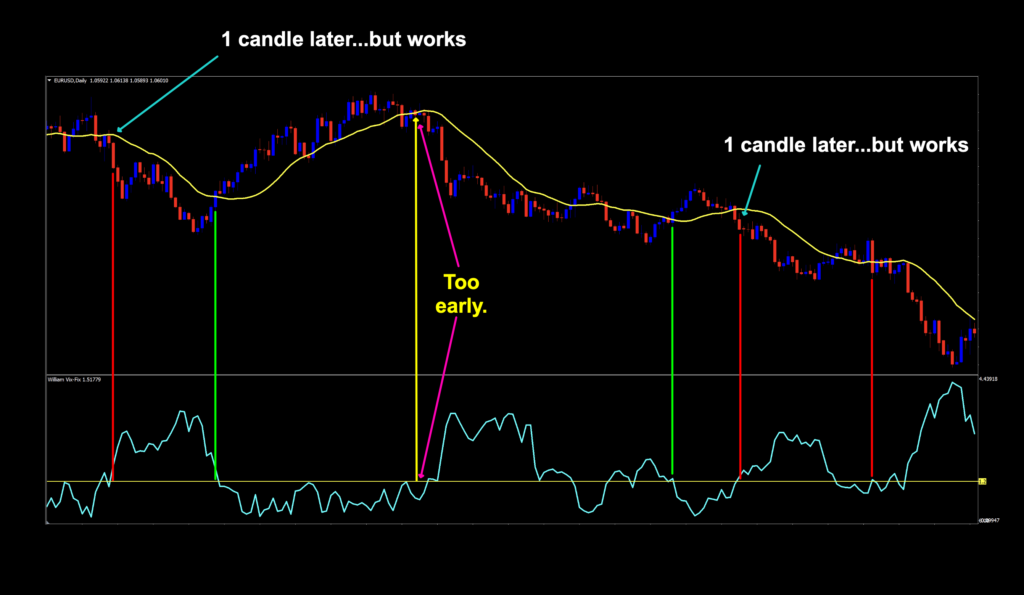
As we mentioned before, we need something else on the chart. We added an SMA (20) for our illustrative and testing purposes. Is it the best choice? Maybe not, but we’re going with simple. Whatever you’re using in your algorithm is what you’ll compare with the Williams VIXFix. Let’s put up our chart again and look at the signals.
Squeaker
Very interesting. We had a few signals just squeak by with regard to volatility levels. A quicker reacting indicator may have picked up more signals, but that’s the fun of it all. You have options. That nice start of a downtrend didn’t really fit the bill where it’s labeled (Too early.) Remember, things change with the market. We’re looking at history. Let’s get to the testing phase and see how we do. Remember, you have a LOT of changeable options here. If you’re using different baselines and confirmation indicators, your results will be significantly different.
Don’t Forget
Just a quick reminder. Your trade signal for long or short comes first, THEN the volatility indicator. Not the other way around. Do not get those confused. If you want a little more in depth reminder on that, go back and read the Silence as a Volatility Indicator blog HERE for additional information. The accompanying video is also helpful. We provide two graphic examples in that video. Education; that’s what we do here.
Gone Hunting
For our testing research, we’ll use the default settings we’ve discussed and with regard to tweaked settings, we’ll be changing those values across the iPeriod, Level, and SMA to see if we can do any better.
Can Testing Fix It?
If you’re new to these studies, we recommend looking at some of the older blogs to understand how we conduct our testing.
The six pairs we recommend testing are…
EUR/USD
AUD/NZD
EUR/GBP
AUD/CAD
CHF/JPY
CAD/SGD
The markets we test our indicators are the:
EUR/USD (Euro/US Dollar)
BTC/USD (Bitcoin/US Dollar)
XAU/USD (Gold/US Dollar)
SPX500 (S&P500 Index)
Timeframes and Results
We’ll run the Williams VIXfix indicator on the EUR/USD, BTC/USD, XAU/USD, and the SPX500 using the default and tweaked settings across the daily and 4-hour timeframes on the MT4 strategy tester.
We focus on three metrics;
Total trades
Win/Loss ratio
ROI (return on investment)
Results for the Taking
Below, you’ll find the testing results from our endeavors.
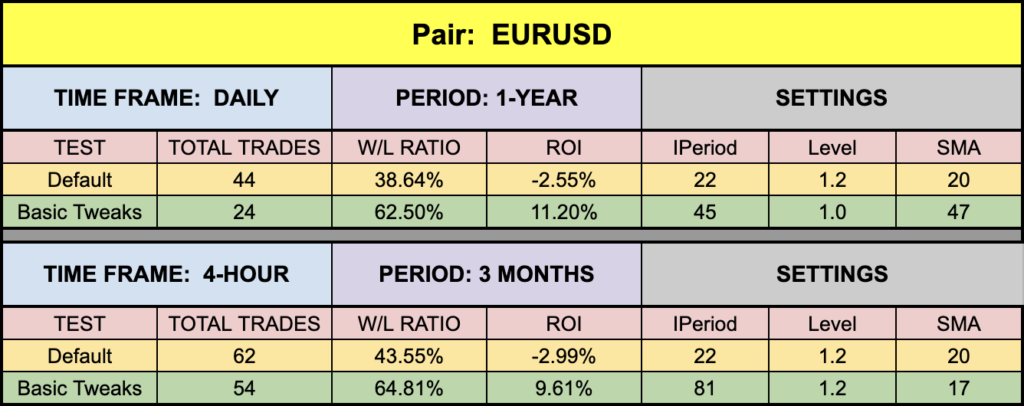
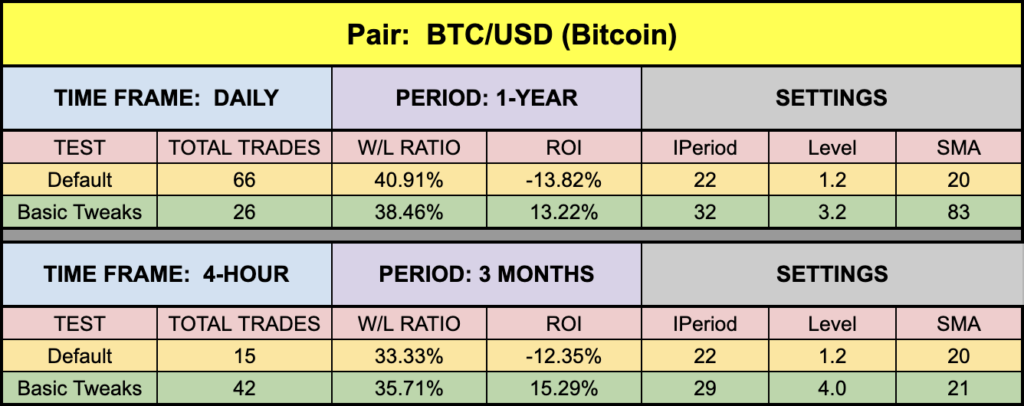
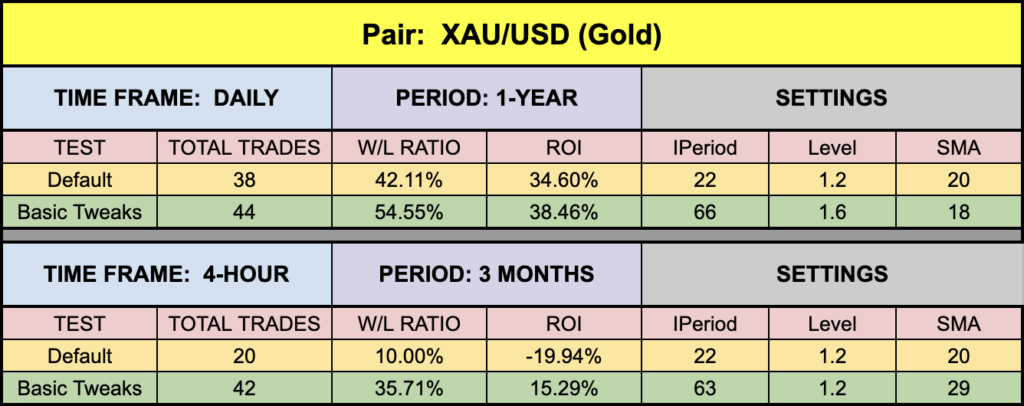
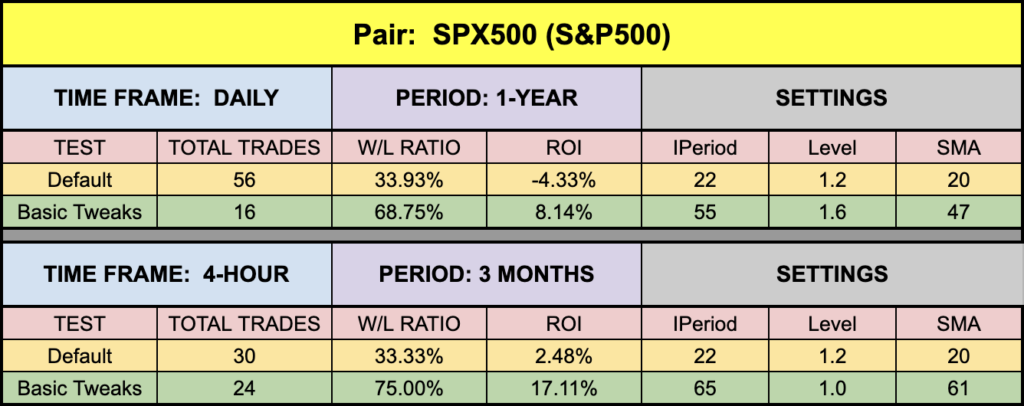
Pretty Good
Our numbers were actually pretty good across the board. Especially with two indicators running in tandem. Gold was the expected darling here, although the EUR daily pulled in some decent returns as well. BTC did fairly well and the SPX500 was somewhat moderate, although that 4-hour data was nothing to sneeze at. Go on, kick the tires, then take it for a spin. You know where to go find it.
Money Management
Money management is based on the NNFX risk profile. That information can be learned in the Advanced Course.
Resources
We’ve made the Williams VIXFix indicator available for download on our site from the indicator library, for free. When you’re ready to get it, click HERE.
We’re Here For You
Make sure you’re signed up for the latest digests. If you’d like a copy of the most recent one, email dan@stonehillforex.com with the title “Latest Digest Please” and we’ll send it off to you within 24 hours. Don’t forget to subscribe to our YouTube channel for the technical analysis videos. Finally, be sure to check out Facebook and Quora, where we answer questions relating to Forex.
Our only goal is to make you a better trader.
BTW – Any information communicated by Stonehill Forex Limited is solely for educational purposes. The information contained within the courses and on the website neither constitutes investment advice nor a general recommendation on investments. It is not intended to be and should not be interpreted as investment advice or a general recommendation on investment. Any person who places trades, orders or makes other types of trades and investments etc. is responsible for their own investment decisions and does so at their own risk. It is recommended that any person taking investment decisions consults with an independent financial advisor. Stonehill Forex Limited training courses and blogs are for educational purposes only, not a financial advisory service, and does not give financial advice or make general recommendations on investment.