It’s Good to Have You Back
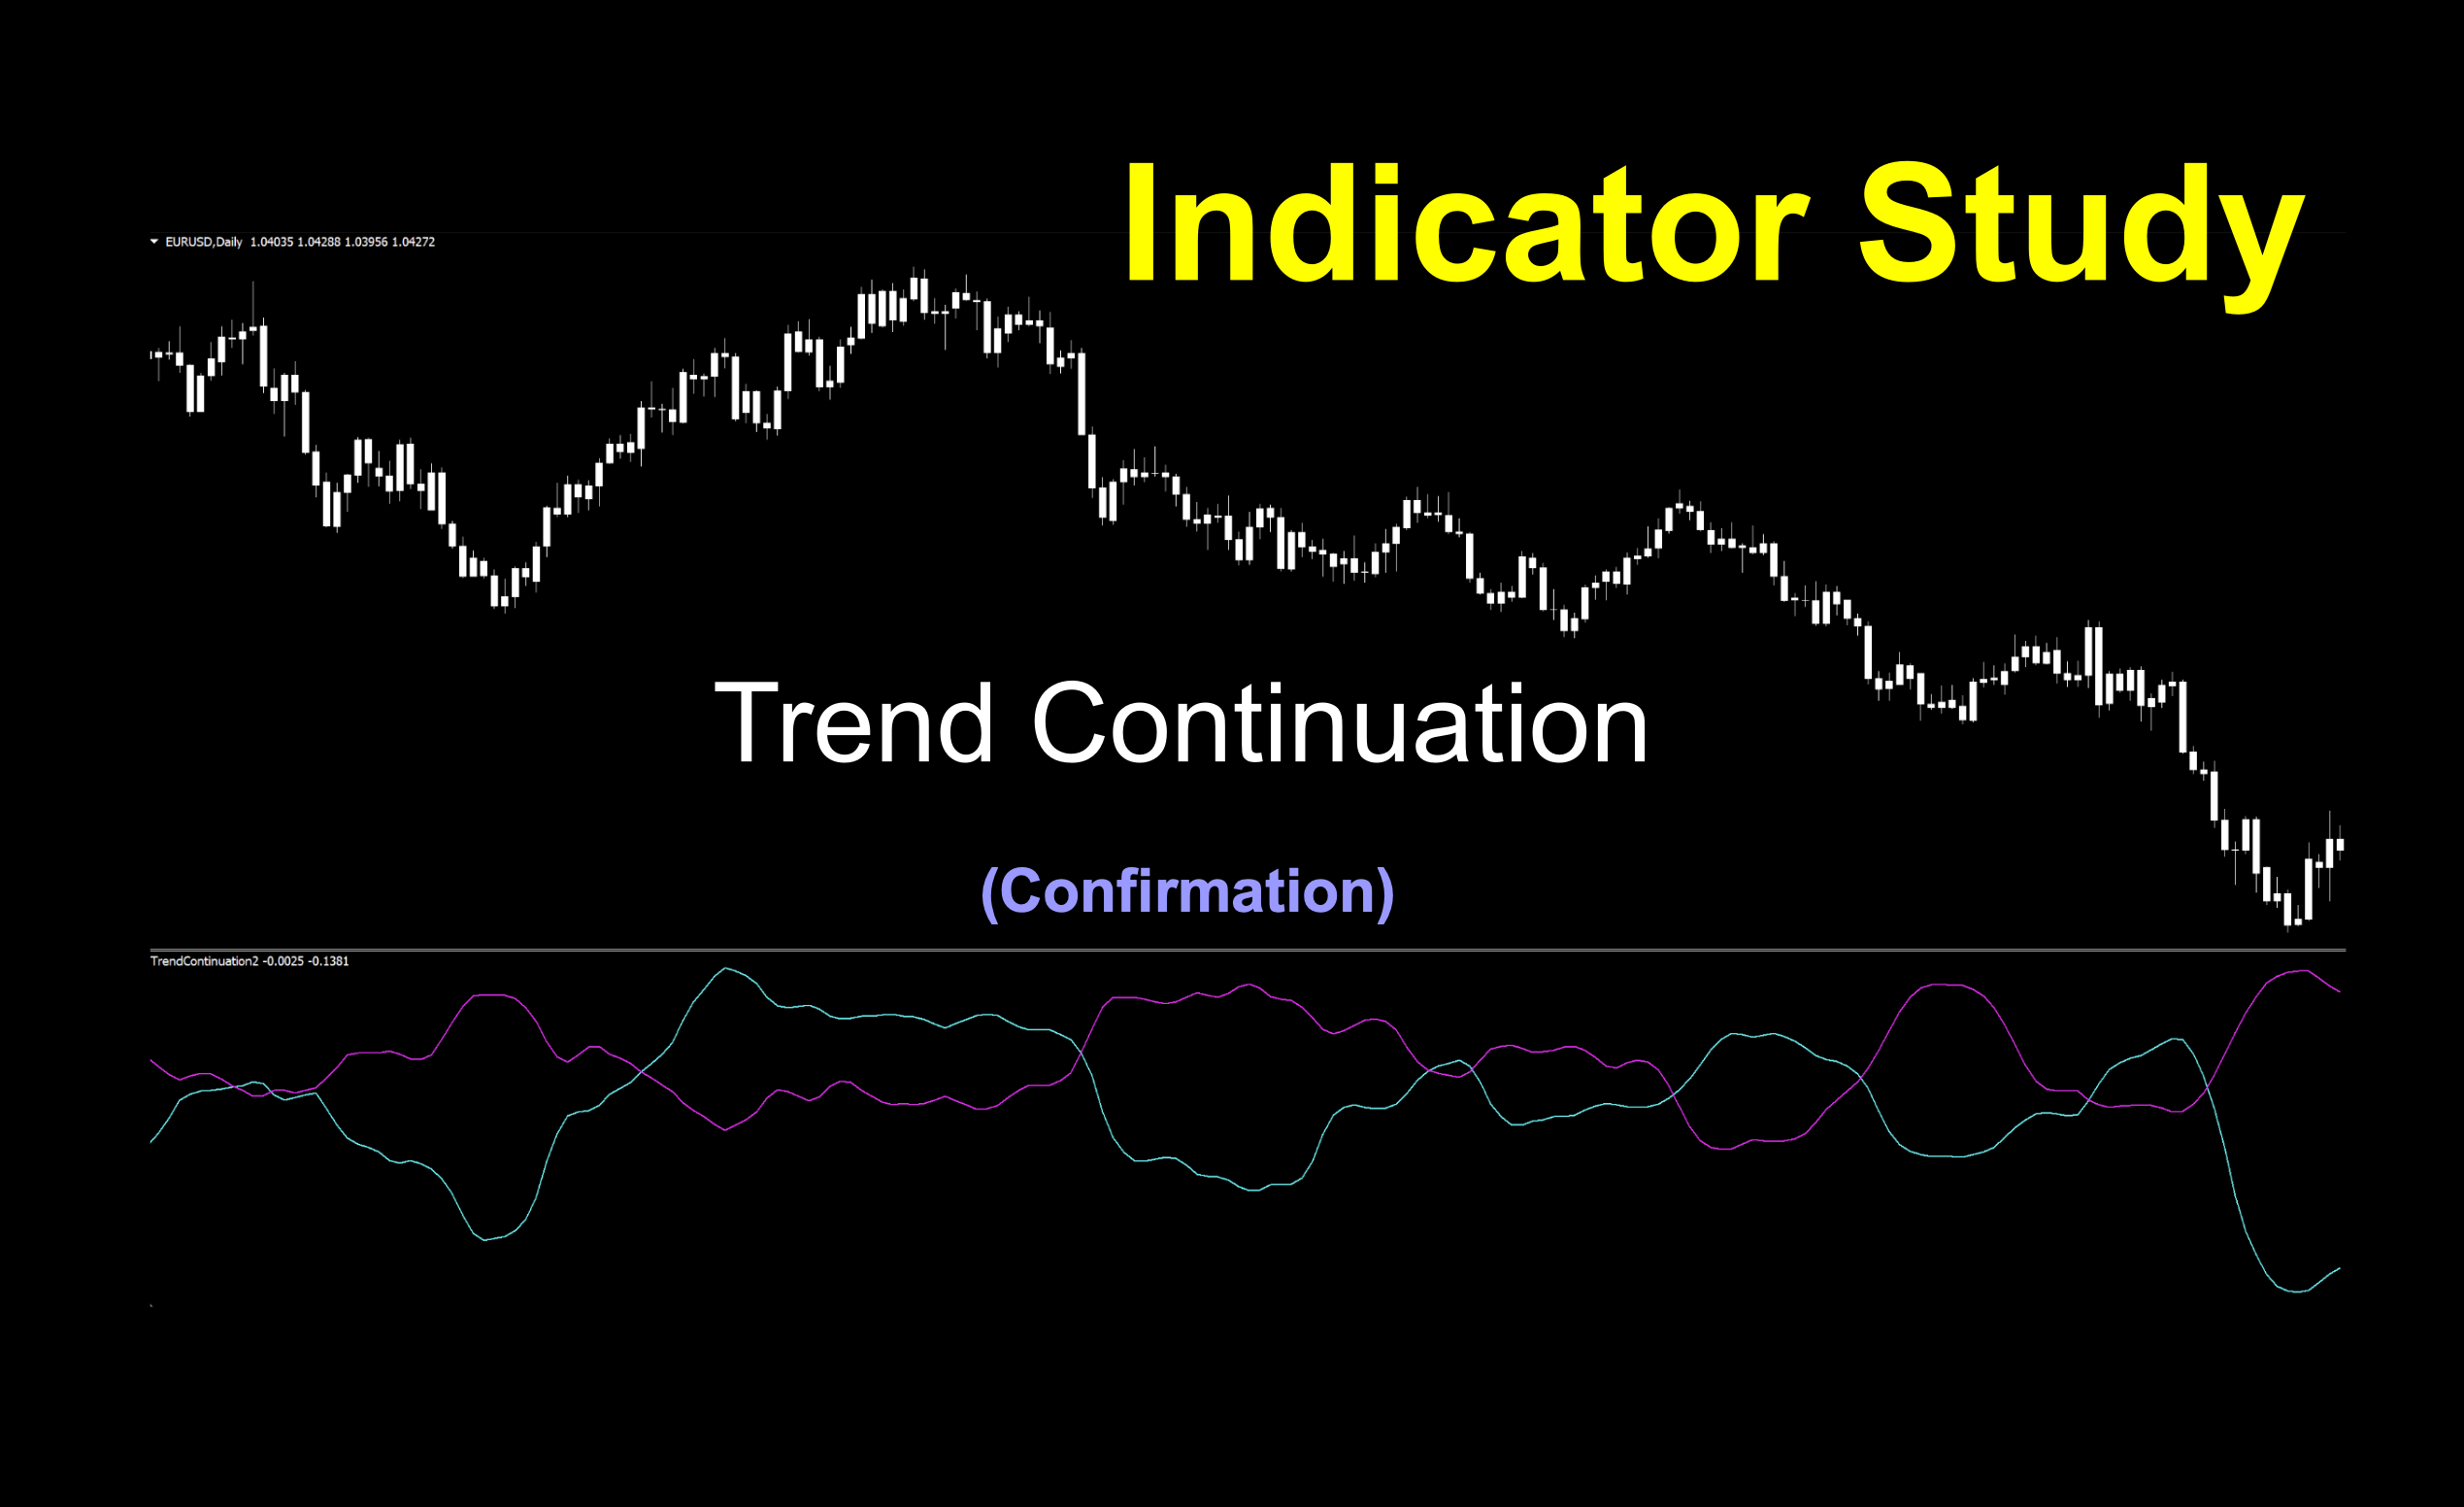
Welcome back to the next indicator installment. We’ve got an interesting indicator this week called Trend Continuation. Part of our mission is to provide helpful indicators that you can use immediately and are not part of the included set of the MT4 platform. Try them out in your algorithm and see how they perform for you.
What’s Your Function
The function of the Trend Continuation indicator is fairly self-evident in its title. Identifying when a trend as begun. We live for those since we are, in fact, trend traders, right?
Who’s That Man?
This idea was developed by M. H. Pee and discussed in the March 2002 volume of the Technical Analysis of Stocks and Commodities Magazine. His primary goal was not only to ascertain when a trend was in place, but the direction of the trend. He states that if you’re on the wrong side of the trend, you can sustain significant losses. We’d have to agree with him…
Math Factor
If you’re really interested in reading about the math and delving into his spreadsheets, you can check out his article HERE. Basically, it’s a comparison between daily closes over a period of time which are divided into positive and negative to generate our signal lines, but we’ll leave the detailed explanation to Mr. Pee. The lines separately correspond to bullish and bearish momentum, and together, can make magic!
Confirmation Indicator
This is a confirmation indicator and can be used as either your first or second as a good check point in your algorithm. A two line cross over that lives below your price chart, this one is pretty easy to use.
You Pretty Thing
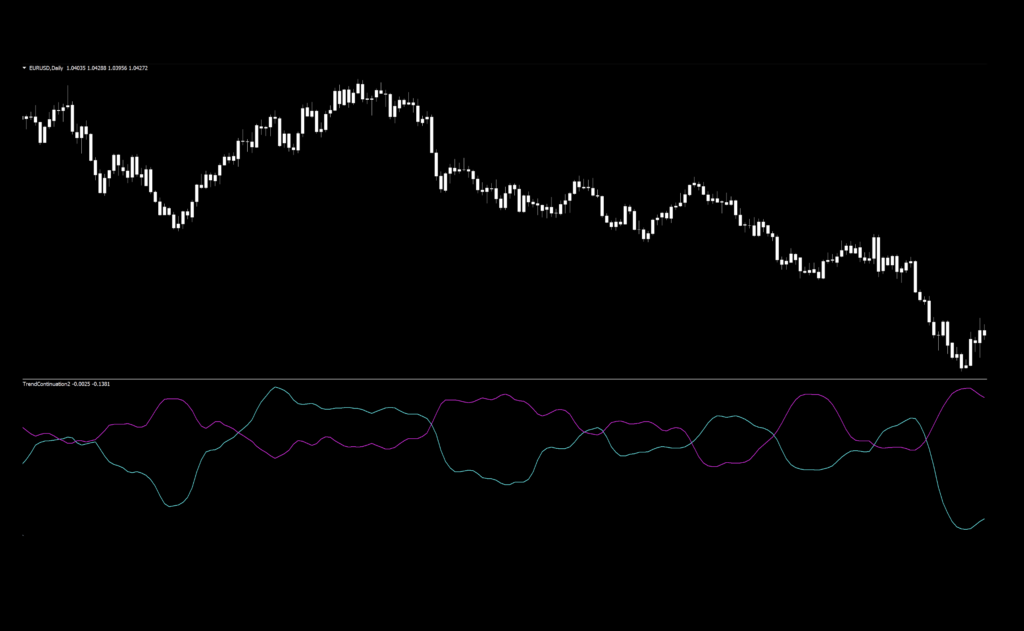
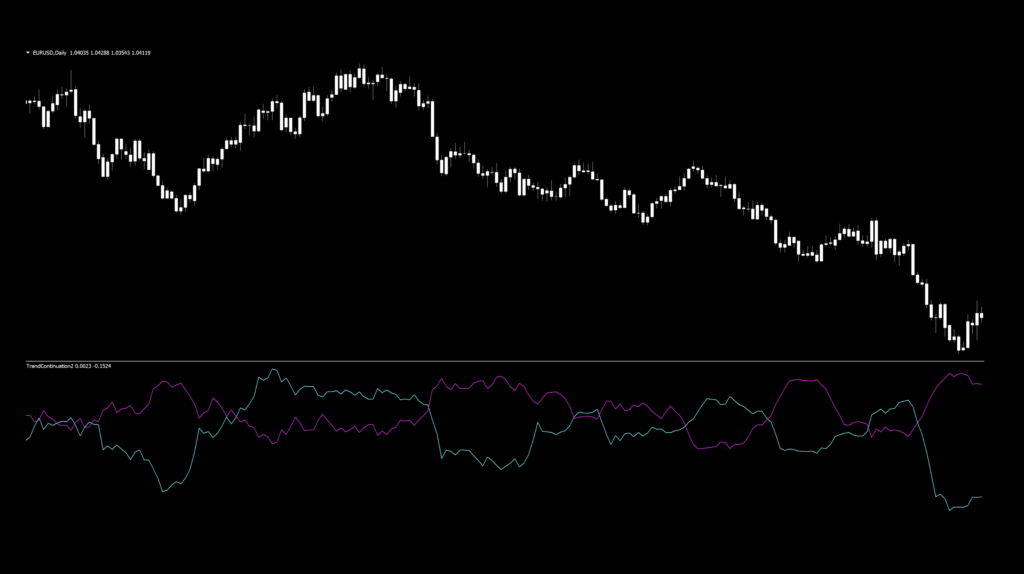
In the screenshot below, we’ve brightened up the indicator’s lines from blue/red to aqua/magenta and thickened the lines for better visibility. As we generally like to do, the candle colors are changed to white, which removes bias, allowing us to focus strictly on the indicator.
Settings
This indicator has four variables in the settings window, but you only need to adjust one of them for testing purposes. Below is the settings screen.
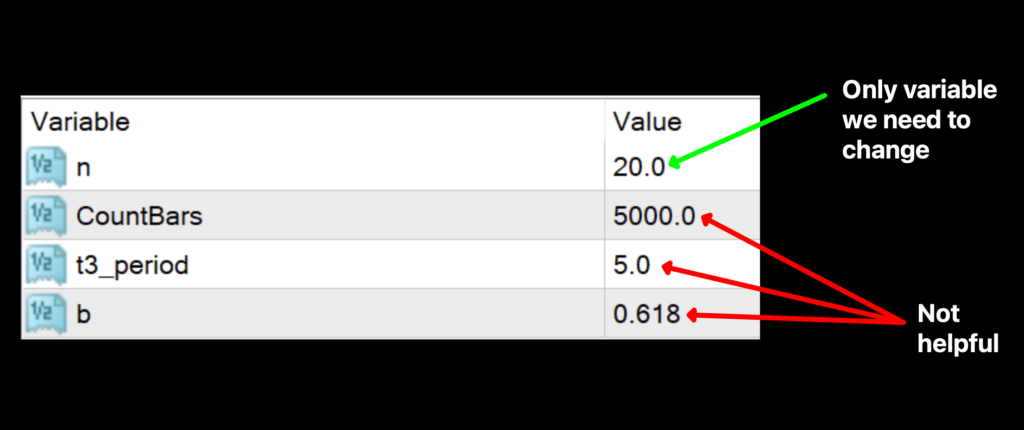
n: The number of bars (or periods) the indicator looks back to gather data for consideration. The default value is 20.
CountBars: This setting tells the indicator how far it can go back. For our purposes, the default value of 5000 is more than sufficient.
t3-Period: A very slight adjustment to the signal lines is made with this setting, which appears as a tiny shift forward or backwards and the “smoothness” of the signal lines are affected. In our testing, we found it to have virtually no effect, as noted in the mark-up below.
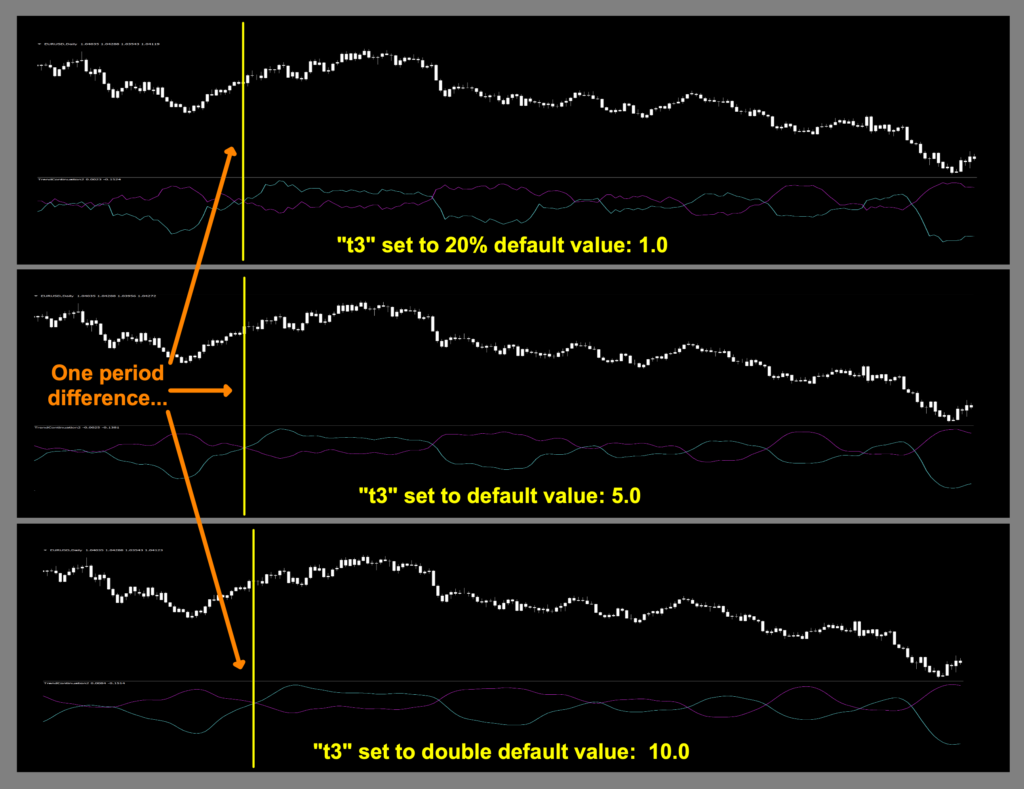
Notice that the changes in the setting do not make much of a difference where the two lines cross. Leave it at the default value of 5.0.
Here is a close up of the indicator setting “t3-Period” at 1.0 to exhibit the “jaggedness” of the lines – which does not really affect the signals.
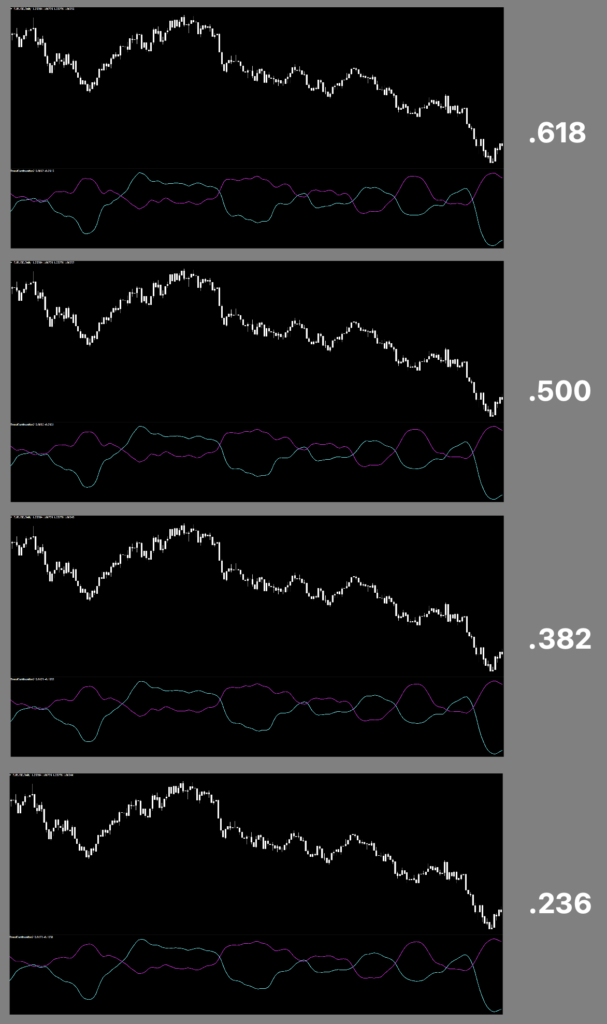
b: The default number of “.618” is part of the Fibonacci sequence (.236, .382, .500, .618) when discussing retracement levels. While Italian mathematician Leonardo Fibonacci, who introduced the sequence in his 1202 book “Liber Abaci” was a truly amazing individual, this variable just doesn’t do much for us in this indicator.
Leave it on the default value. The screenshot below exhibits the various Fibonacci sequence settings in the “b” variable. Notice there is very little (almost zero) change.
Advantages
* Easy to identify cross over signals.
* Only one indicator to change for testing.
* Possible use as an exit indicator, depending on settings and the rest of your algorithm.
How we use it
Long signal – When the blue line crosses and closes above the red line, your entry is made on the open of the next period.
Short signal – When the red line crosses and closes above the blue line, your entry is made on the open of the next period.
Let’s take a look at a marked up default chart to see where the entries would be.
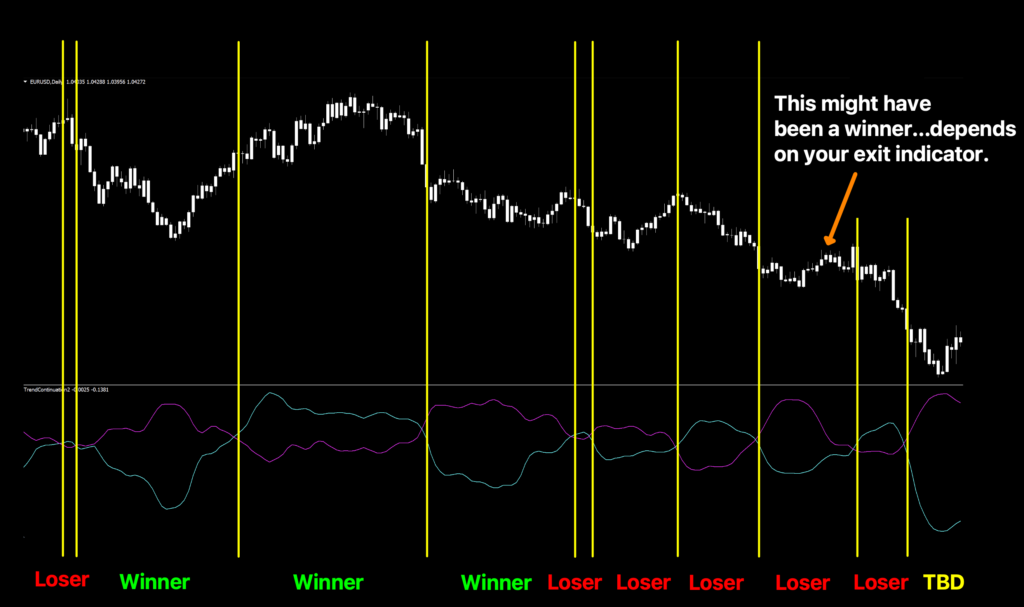
Ew.
Not such a pretty picture at first blush. But remember, this is the default setting. Would it make a good exit indicator “as is”? Not hardly. Will a few tweaks and embedded in a tested algorithm, some of these losers would have never happened.
Never discount something without giving it a chance. If you think it might work, find out…it cost you nothing but time, and you’ll be a better trader for it.
Exit or No?
As we’ve seen in previous images, the default settings don’t make for a good exit indicator. Does that mean it can never be a good one. Of course not. Market conditions change over time, and different settings react differently as markets change.
Test it backwards and forwards. Various currency pairs (and other markets) will yield different results. That’s what makes what we do so wonderful. You are rarely constrained by a narrow set of rules. YOU get to make the rules.
Testing…Testing…Testing…
Remember, comprehensive analysis is strongly suggested, and we advocate backwards and forward testing indicators or systems prior to trading actual funds. We propose conducting your tests on the following five pairs.
EUR/USD
AUD/NZD
EUR/GBP
AUD/CAD
CHF/JPY
If it doesn’t work on these five pairs, chances are it won’t work on other pairs. This is not an absolute, but we’ve found this rule is reliable in most cases.
The markets we test our indicators have grown from one, to three and not too long ago, we added a fourth based on the feedback we received and our collaborative discussions with VP.
They are the:
EUR/USD (Euro/US Dollar)
BTC/USD (Bitcoin/US Dollar)
XAU/USD (Gold/US Dollar)
SPX500 (S&P500 Index)
Timeframes and Results
In our initial test, we’ll run the Trend Continuation on the EUR/USD, BTC/USD, XAU/USD, and the SPX500 using the default settings across the daily and 4-hour timeframes on the MT4 strategy tester. We use the fast method of testing the indicator to get a general idea; however, you may also run the tick-by-tick data set for a more precise result (which takes considerably more time).
As No Nonsense Traders – and therefore Swing Traders, we will not examine shorter time frames in these studies. We will also run an additional test, using different values for the settings, to analyze which one may work better and examine the following results:
Total trades
Win/Loss ratio
ROI (return on investment)
There are other metrics included in the strategy tester report, which can be compared, but these three metrics provide the necessary gauge to make quick decisions as to the usefulness of a particular indicator and its settings.
Next, for comparison, we’ll explore the following;
Daily – 1 year
4-hour – 3 months
The reason exceptionally long (or short) testing periods are not included is due to changing market conditions, which might return irrelevant information. A balance of statistically significant data is necessary for accurate results.
And the Outcome…
Below are the spreadsheets illustrating the results from our tests.
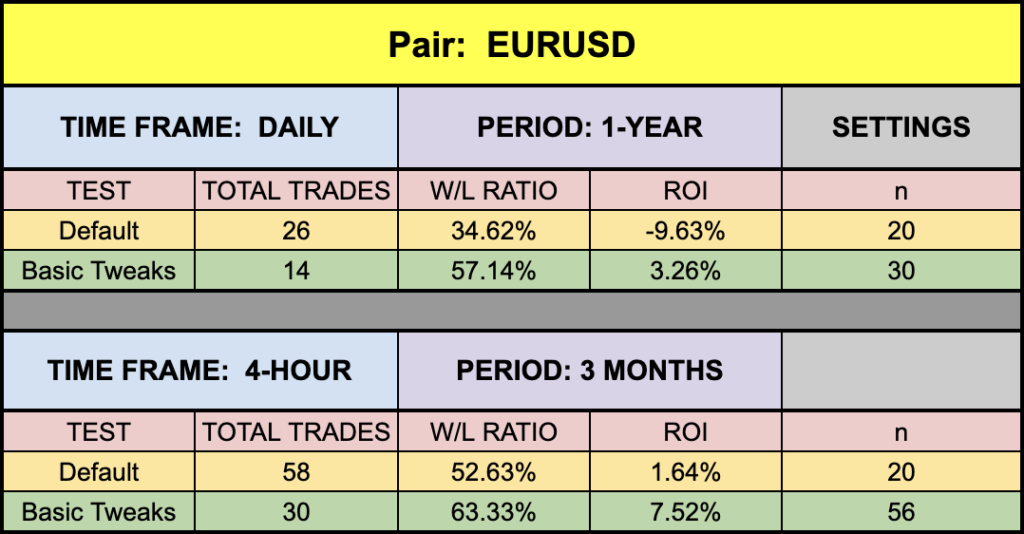

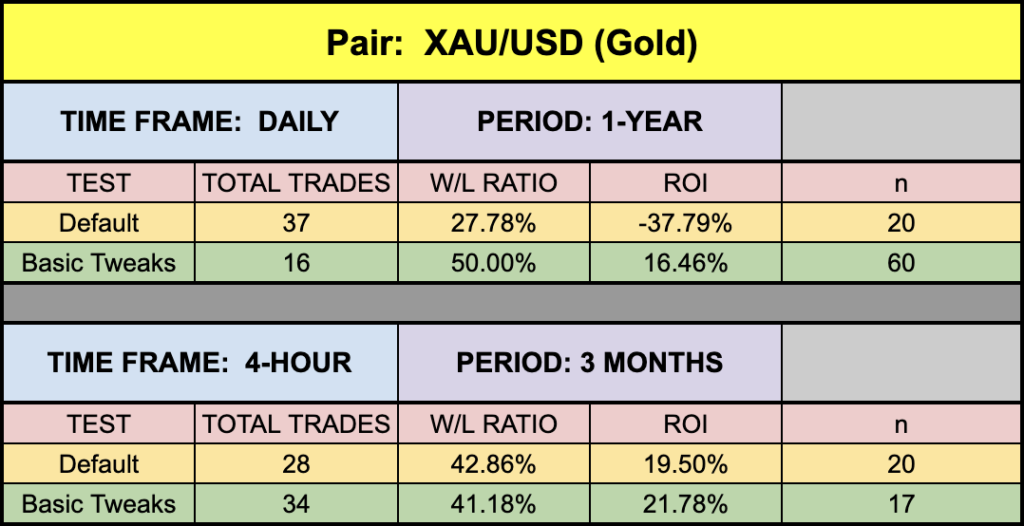
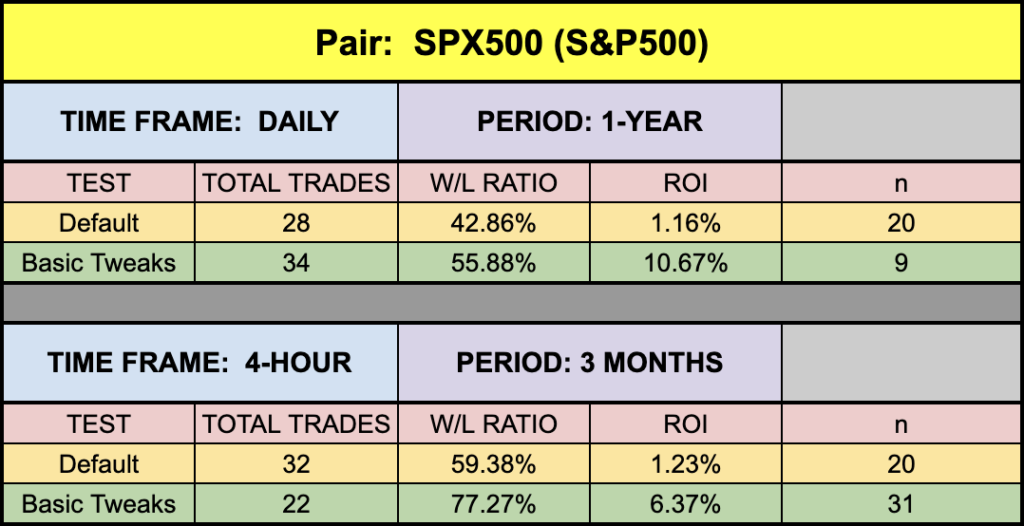
The green highlighted rows represent “basic tweaks” on the settings which returned better results. Are these the best? Not necessarily. Given that variables including testing date range and broker data are different from person to person, you may find better settings.
Trust In Yourself
Remember, the overall NNFX philosophy of taking profit, risk, and drawdown is that YOU are creating a system which YOU will be trading. Don’t let anybody else take that away from you. Part of the learning process is digging in and doing the work yourself. To learn more about these topics, check out the Advanced Course!
That being said, the results we post in these blogs should never be considered specific trading advice.
***Note: Remember, never use just this one indicator as your decision of whether to open or close a trade. It should be part of a system.
Money Management
If you are curious as to what money management is used on our tests; we have a certain way of determining wins and losses, which can be found in the Advanced Course. Our goal here is to determine how well the indicator reacts to price with respect to producing a long or short signal. Your system, with its risk profile, will dictate individual returns.
Resources
As we did with past indicator studies, we’ve made the Trend Continuation indicator is available for download on our site from the indicator library. We will keep adding better indicators with each study for your use, at no charge. When you’re ready to get it, click HERE.
Next Blog
We posted the “Why Traders Lose Most/All of Their Money” Part 1 last week. Next week, we’re going to post Part 2. Be sure to check it out.
More to Come
There’s a lot more to come. We are excited to provide more trading tips in the near future. Sign up on our contacts page or subscribe to our YouTube channel. Receive early notifications as we continue to publish helpful, relevant, and informative Forex related material to support your quest to become a better trader.
And, now you are aware of another indicator that many traders don’t know or use.
Our only goal is to make you a better trader.
BTW – Any information communicated by Stonehill Forex Limited is solely for educational purposes. The information contained within the courses and on the website neither constitutes investment advice nor a general recommendation on investments. It is not intended to be and should not be interpreted as investment advice or a general recommendation on investment. Any person who places trades, orders or makes other types of trades and investments etc. is responsible for their own investment decisions and does so at their own risk. It is recommended that any person taking investment decisions consults with an independent financial advisor. Stonehill Forex Limited training courses and blogs are for educational purposes only, not a financial advisory service, and does not give financial advice or make general recommendations on investment.