Crystal Clear
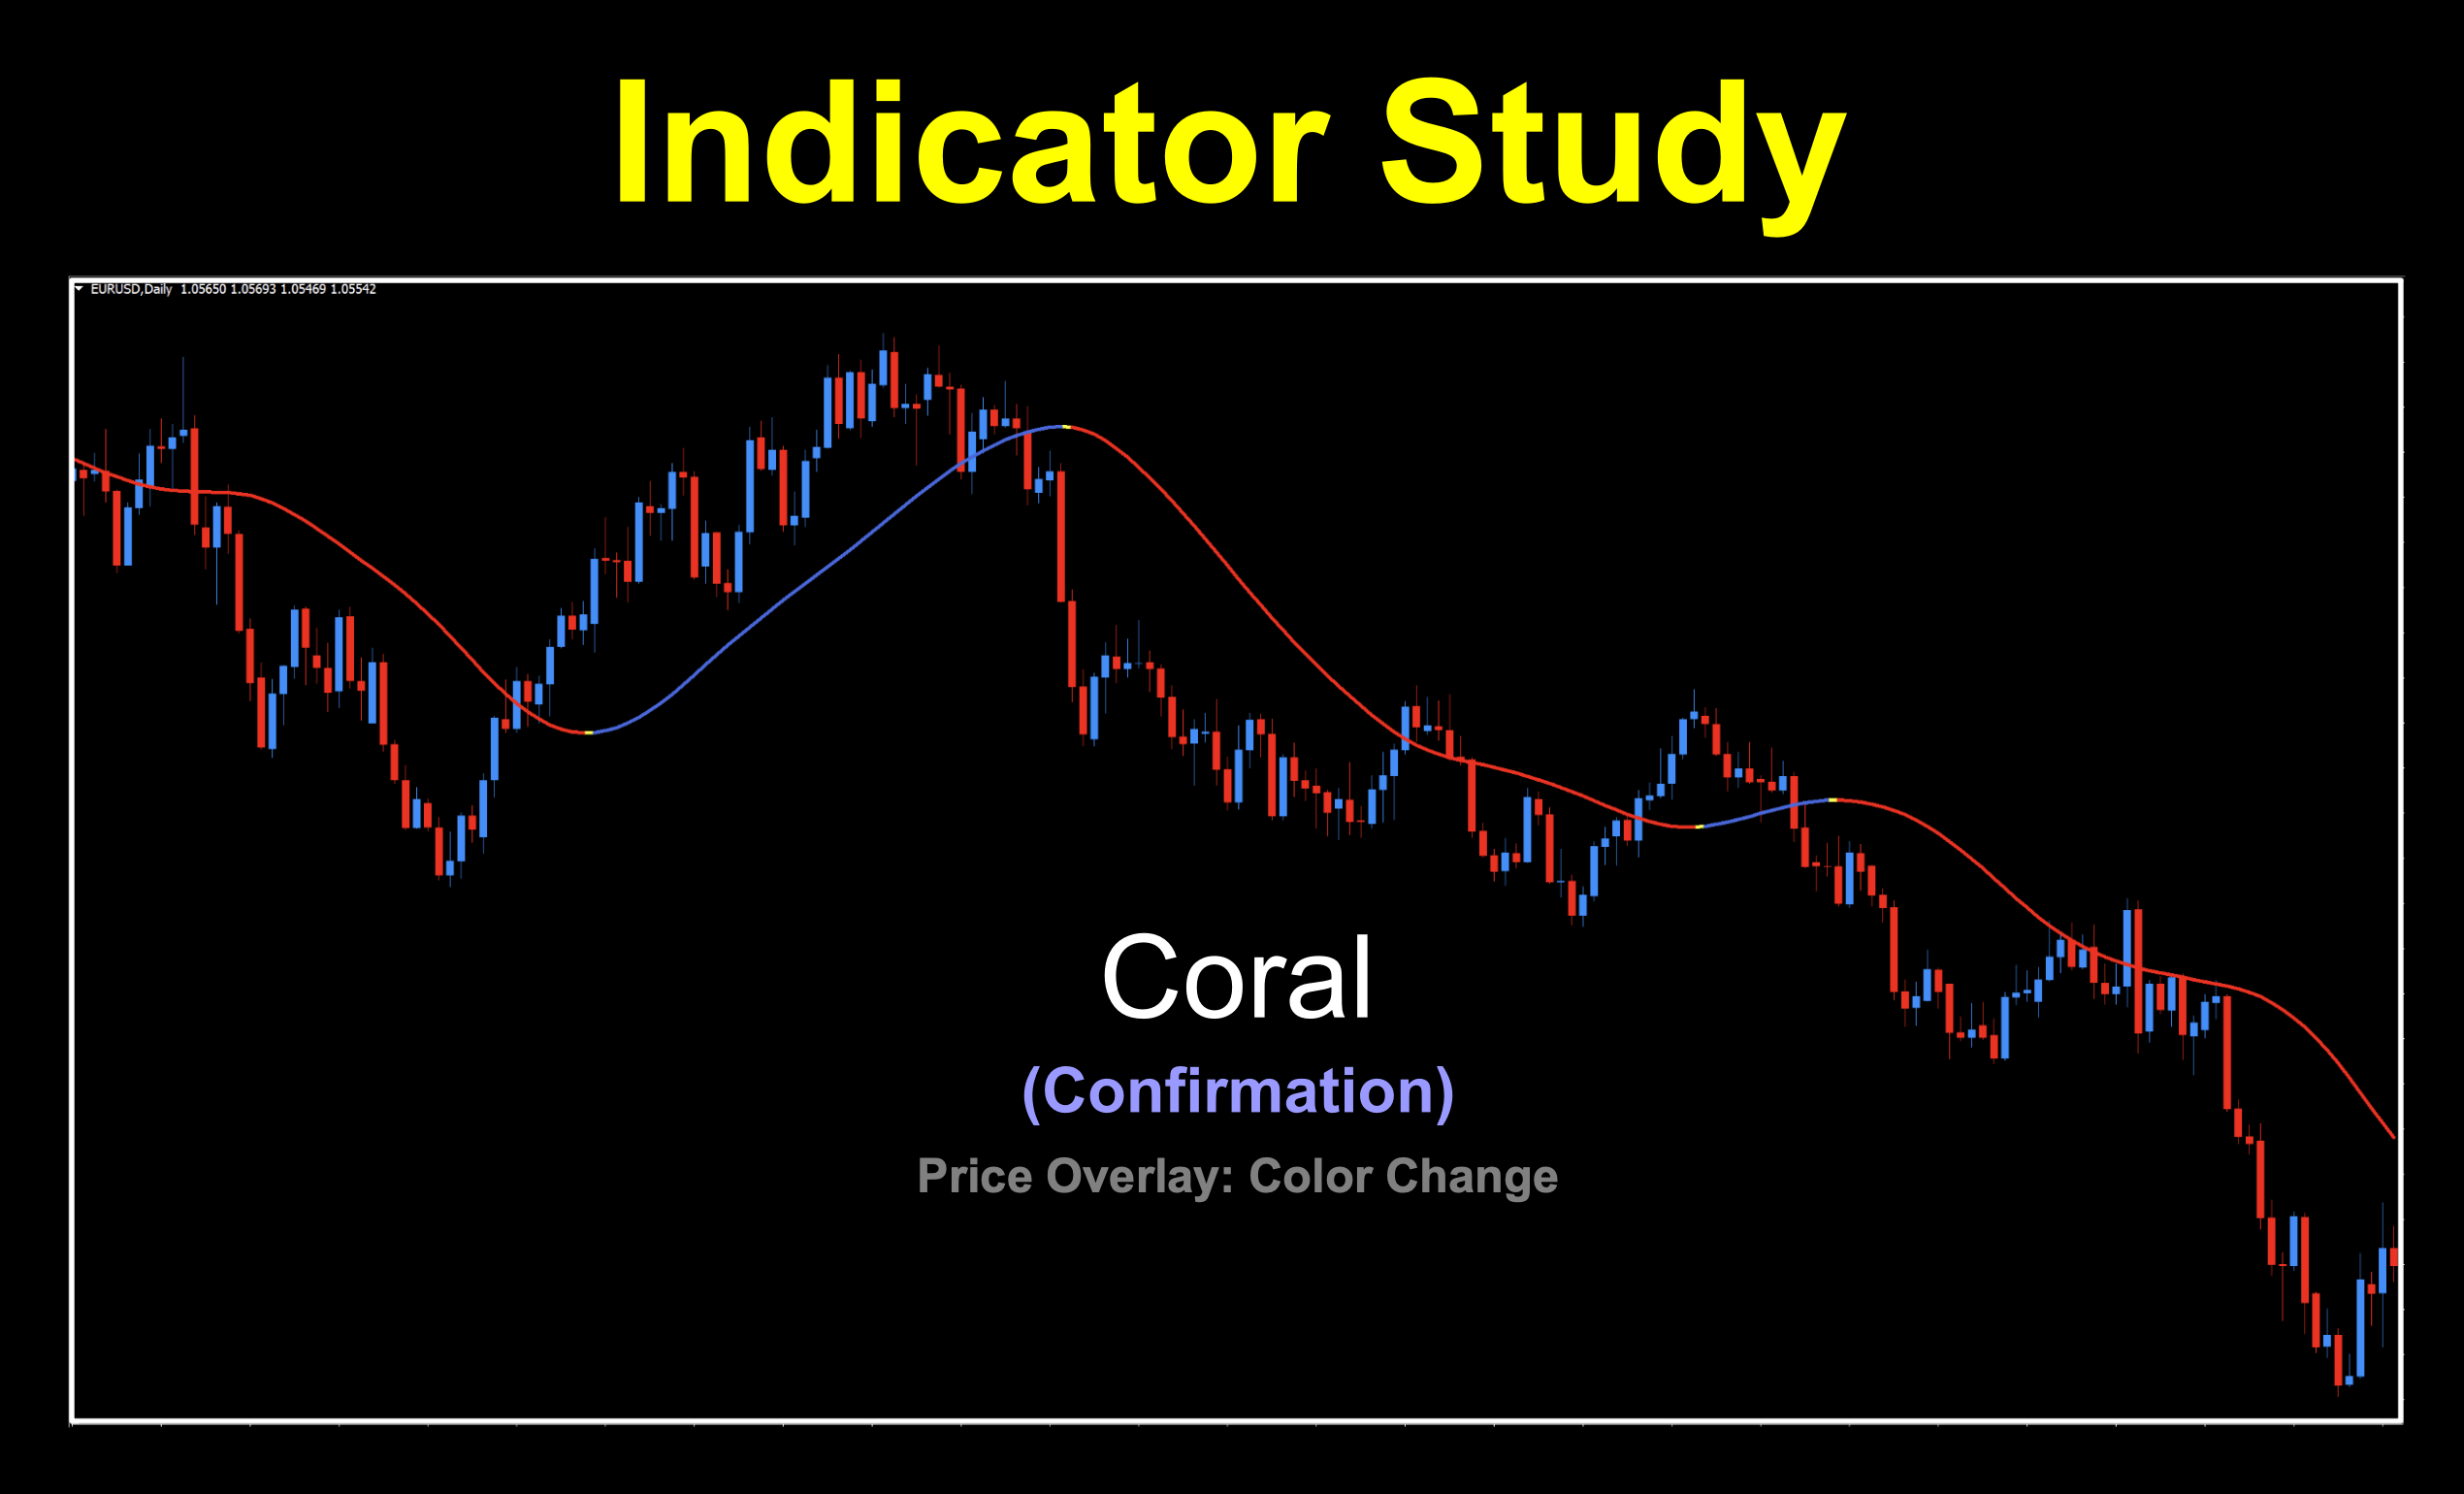
We’re highlighting a very easy to use indicator this week called Coral. This indicator identifies trends by using a moving average type of line; however, the signals are exceptionally clear…and there’s a value added bonus, which we will discuss below.
Thank You Mysterious Person
Through our research, we were a bit surprised to discover how many coders have made different versions compatible on different trading platforms other than MT4. This told us that there was something special about it. We even found it being sold for $147 on one site. Thankfully, you can get it from us for free. Most of the dates we uncovered were between 2019 and 2022; however, the oldest recorded date we could locate was 2015 with no credit given to its original inventor.
Why So Special?
For such a simple looking indicator, it certainly hides a lot going on in the background. The Coral indicator uses something called a “Linear IIR Filter”…the IIR stands for “Infinite Impulse Response”. It is a combination of moving averages obtained by triple (or higher) order exponential smoothing based against something called the “normalized slope of the plot”. This gives the indicator a nice smooth line. Some versions have added features and more settings; but we’ll be testing one of the more basic versions.
Exit, Stage Left?
Should this indicator be used to signal exits? It can…after all, it gives you clean and definitive signals. Is it the best? Maybe, maybe not. But we thought it was pretty darn good.
Blue & Red…and Yellow
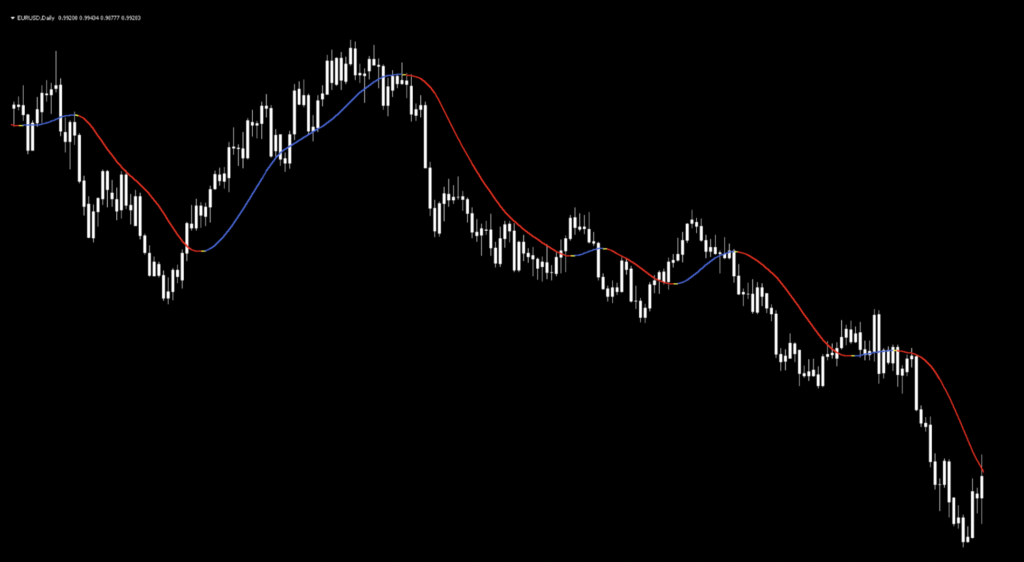
Below is a screenshot of what the original indicator looks like on the daily time frame. Note that we’ve changed the color of the candles to white to remove any emotional bias and that only the indicator is prominent.
Settings
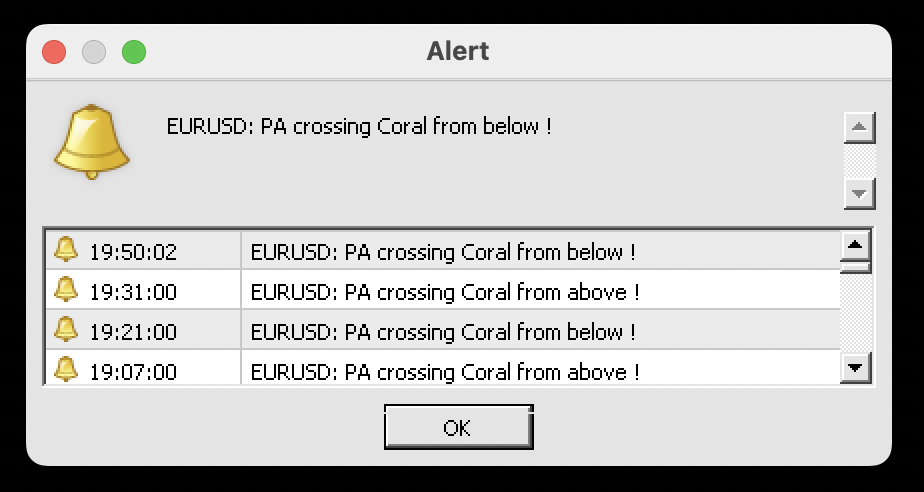
Alert_Coral_Crossing: This setting toggles between “false” and “true”. A helpful alert, when toggled to “true”, a pop-up window in the chart indicates when Coral is crossing from above/below. The default position is “false” or off, in this case.
gi_84: The number of periods that the indicator uses to calculate data and draw the line; similar to a “period” setting for a moving average. The default value is 34.
Advantages
* Colors indicator direction of trend.
* Entries/Exits are easy to interpret.
* Can be used an exit indicator.
How We Use It
The wonderful thing about this indicator is that it’s so easy to use. Between the color change and pop-up alert, it’s really simple to understand.
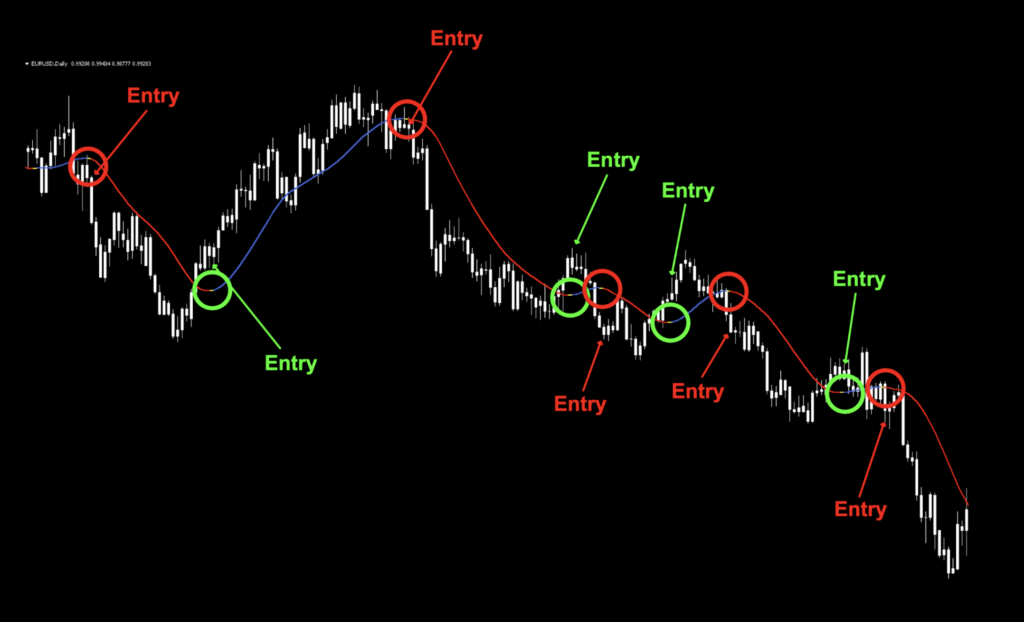
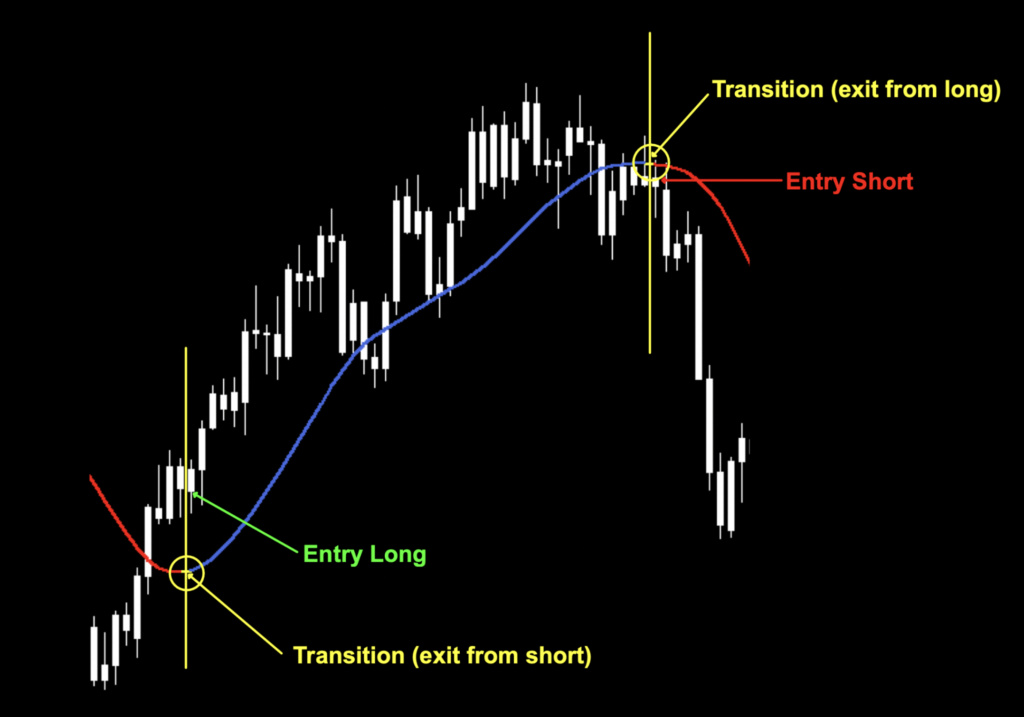
Long: The signal line goes from red, to yellow, to blue. The entry is the open of the period after yellow, while the exit (if used as an exit signal) is the close of the current signal candle.
Short: The signal line goes from blue, to yellow, to red. The entry is the open of the period after yellow, while the exit (if used as an exit signal) is the close of the current signal candle.
Let’s take a look at a marked up example to see how you might interpret the long and short signals.
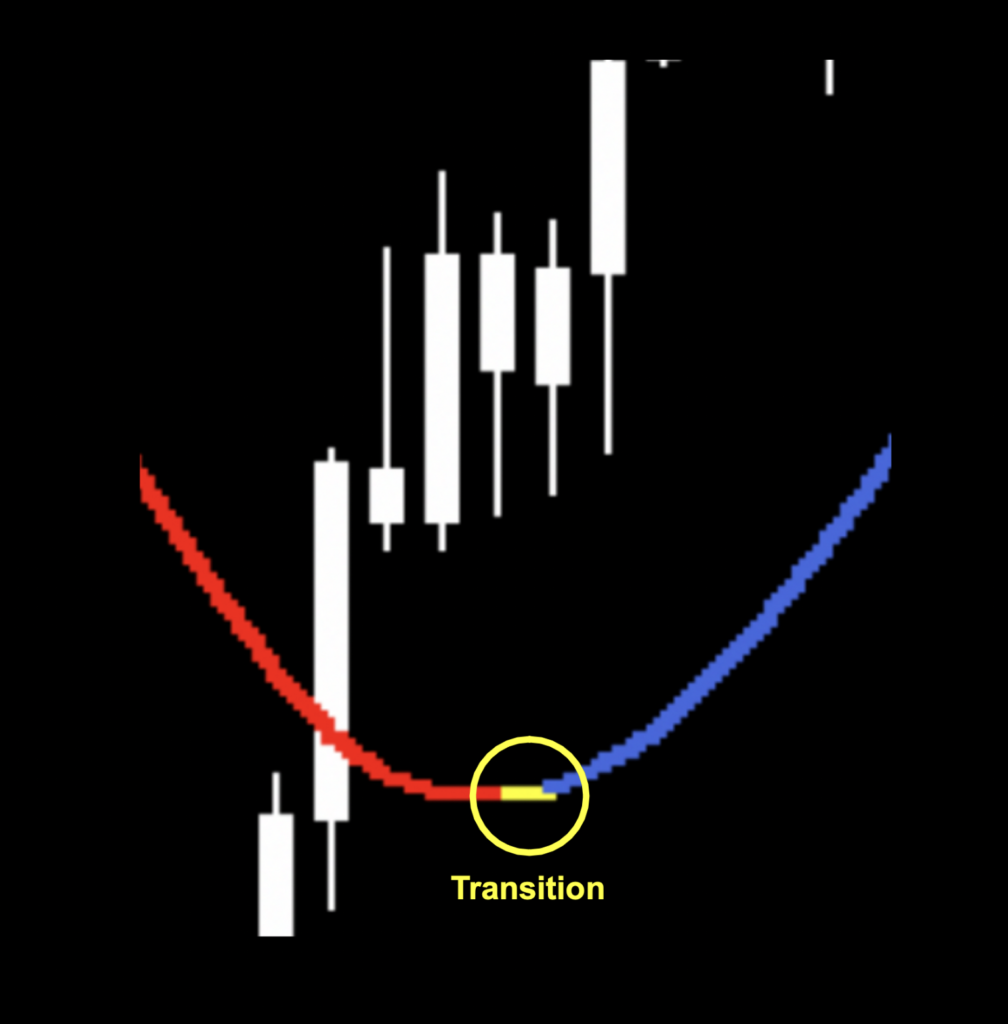
Looking closely, you can see a very small section of yellow line between the trend changes, colored in “yellow”. We’ve zoomed in to give you a better view of this.
And an extreme close up, so you can see exactly where exit/entry points are.
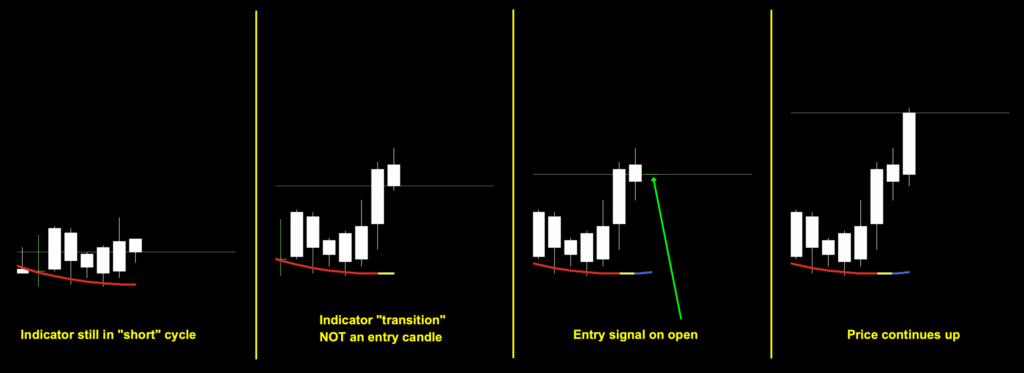
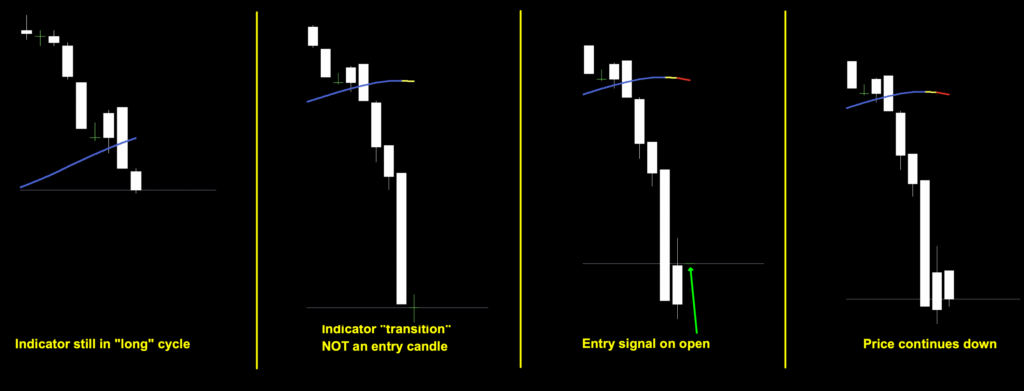
To better illustrate the mechanics, we made two screen recordings to demonstrate the indicator in action. Below are snapshots of each sequence.
Go LONG!
Go SHORT!
And the Outcome…
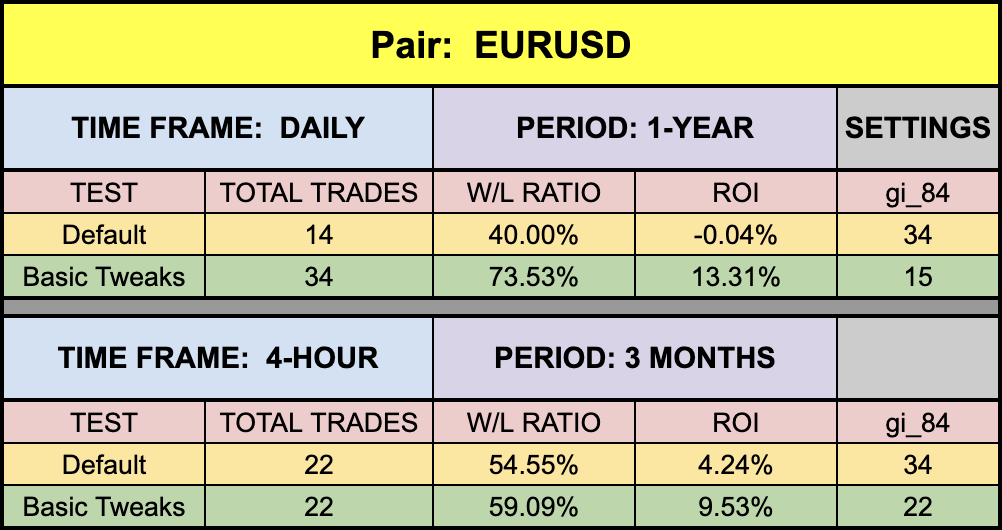
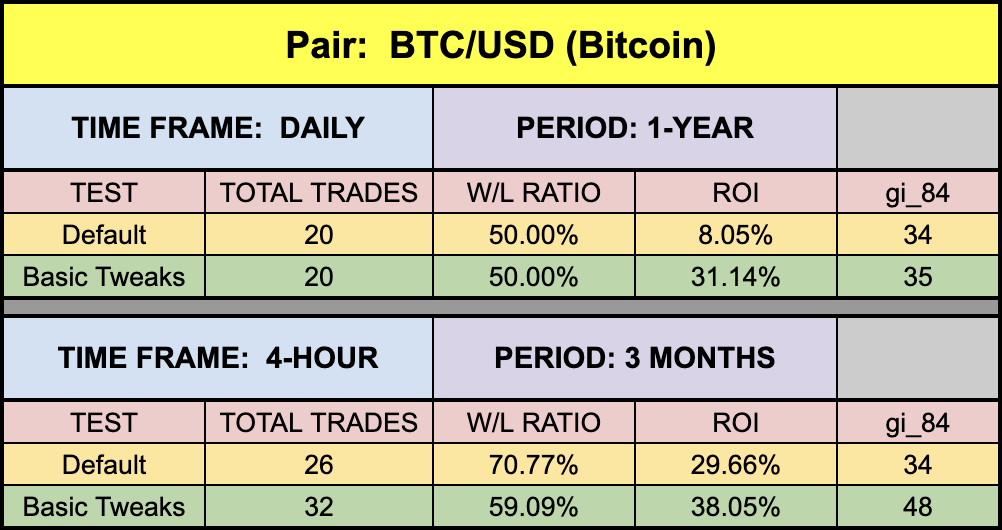
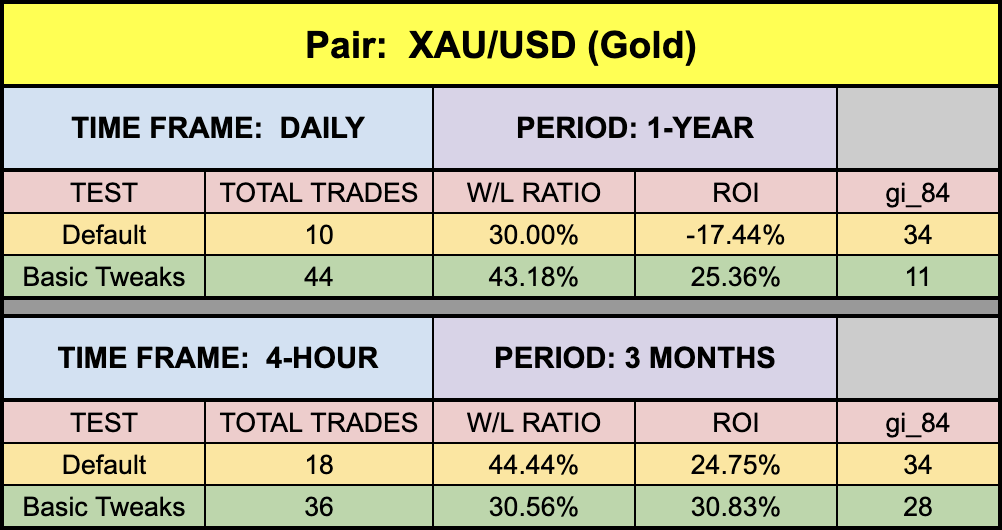
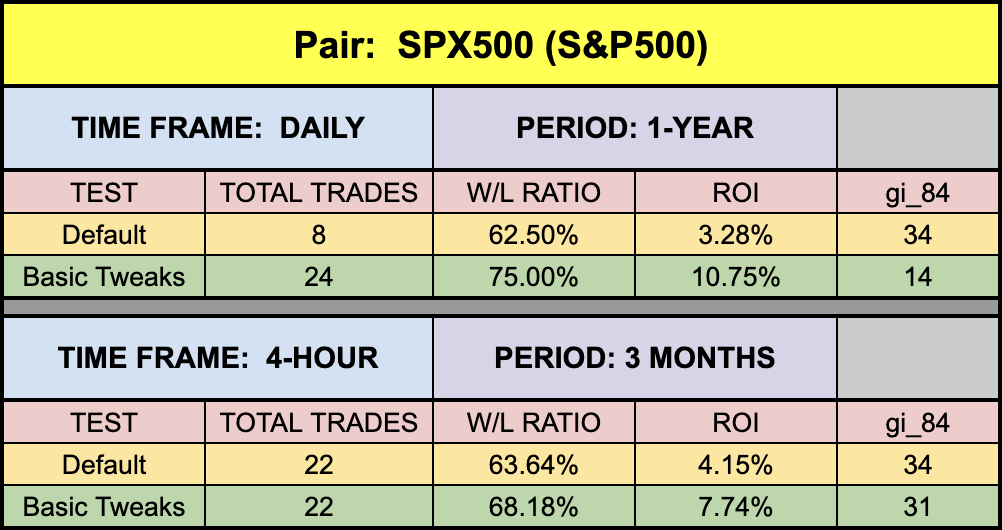
Below are the spreadsheets listing the results from our tests.
Totally Okay
Looking over the numbers, it did pretty good…better than the original numbers we got a couple of years ago. But that’s the market giving back to us. And, this is what makes us happy campers. EUR and SPX500 gave some good results and of course the other two darlings posted some great results with better ones possbile if you make a little time to diddle around with it.
Resources
As we did with past indicator studies, we’ve made the Coral indicator available for download on our site from the indicator library. We will keep adding better indicators with each study for your use, at no charge. When you’re ready to get it, click HERE. Sign up for the Advanced NNFX Course HERE.
Our only goal is to help you become a better trader.
*Our published testing results are based on money management strategies employed by the NNFX system and depend on varying external factors, which may be different between individuals and their specific broker conditions. No guarantee, trading recommendations, or other market suggestions are implied. Your results and subsequent trading activities are solely your own responsibility.
BTW – Any information communicated by Stonehill Forex Limited is solely for educational purposes. The information contained within the courses and on the website neither constitutes investment advice nor a general recommendation on investments. It is not intended to be and should not be interpreted as investment advice or a general recommendation on investment. Any person who places trades, orders or makes other types of trades and investments etc. is responsible for their own investment decisions and does so at their own risk. It is recommended that any person taking investment decisions consults with an independent financial advisor. Stonehill Forex Limited training courses and blogs are for educational purposes only, not a financial advisory service, and does not give financial advice or make general recommendations on investment.