Our Next Indicator Choice is…
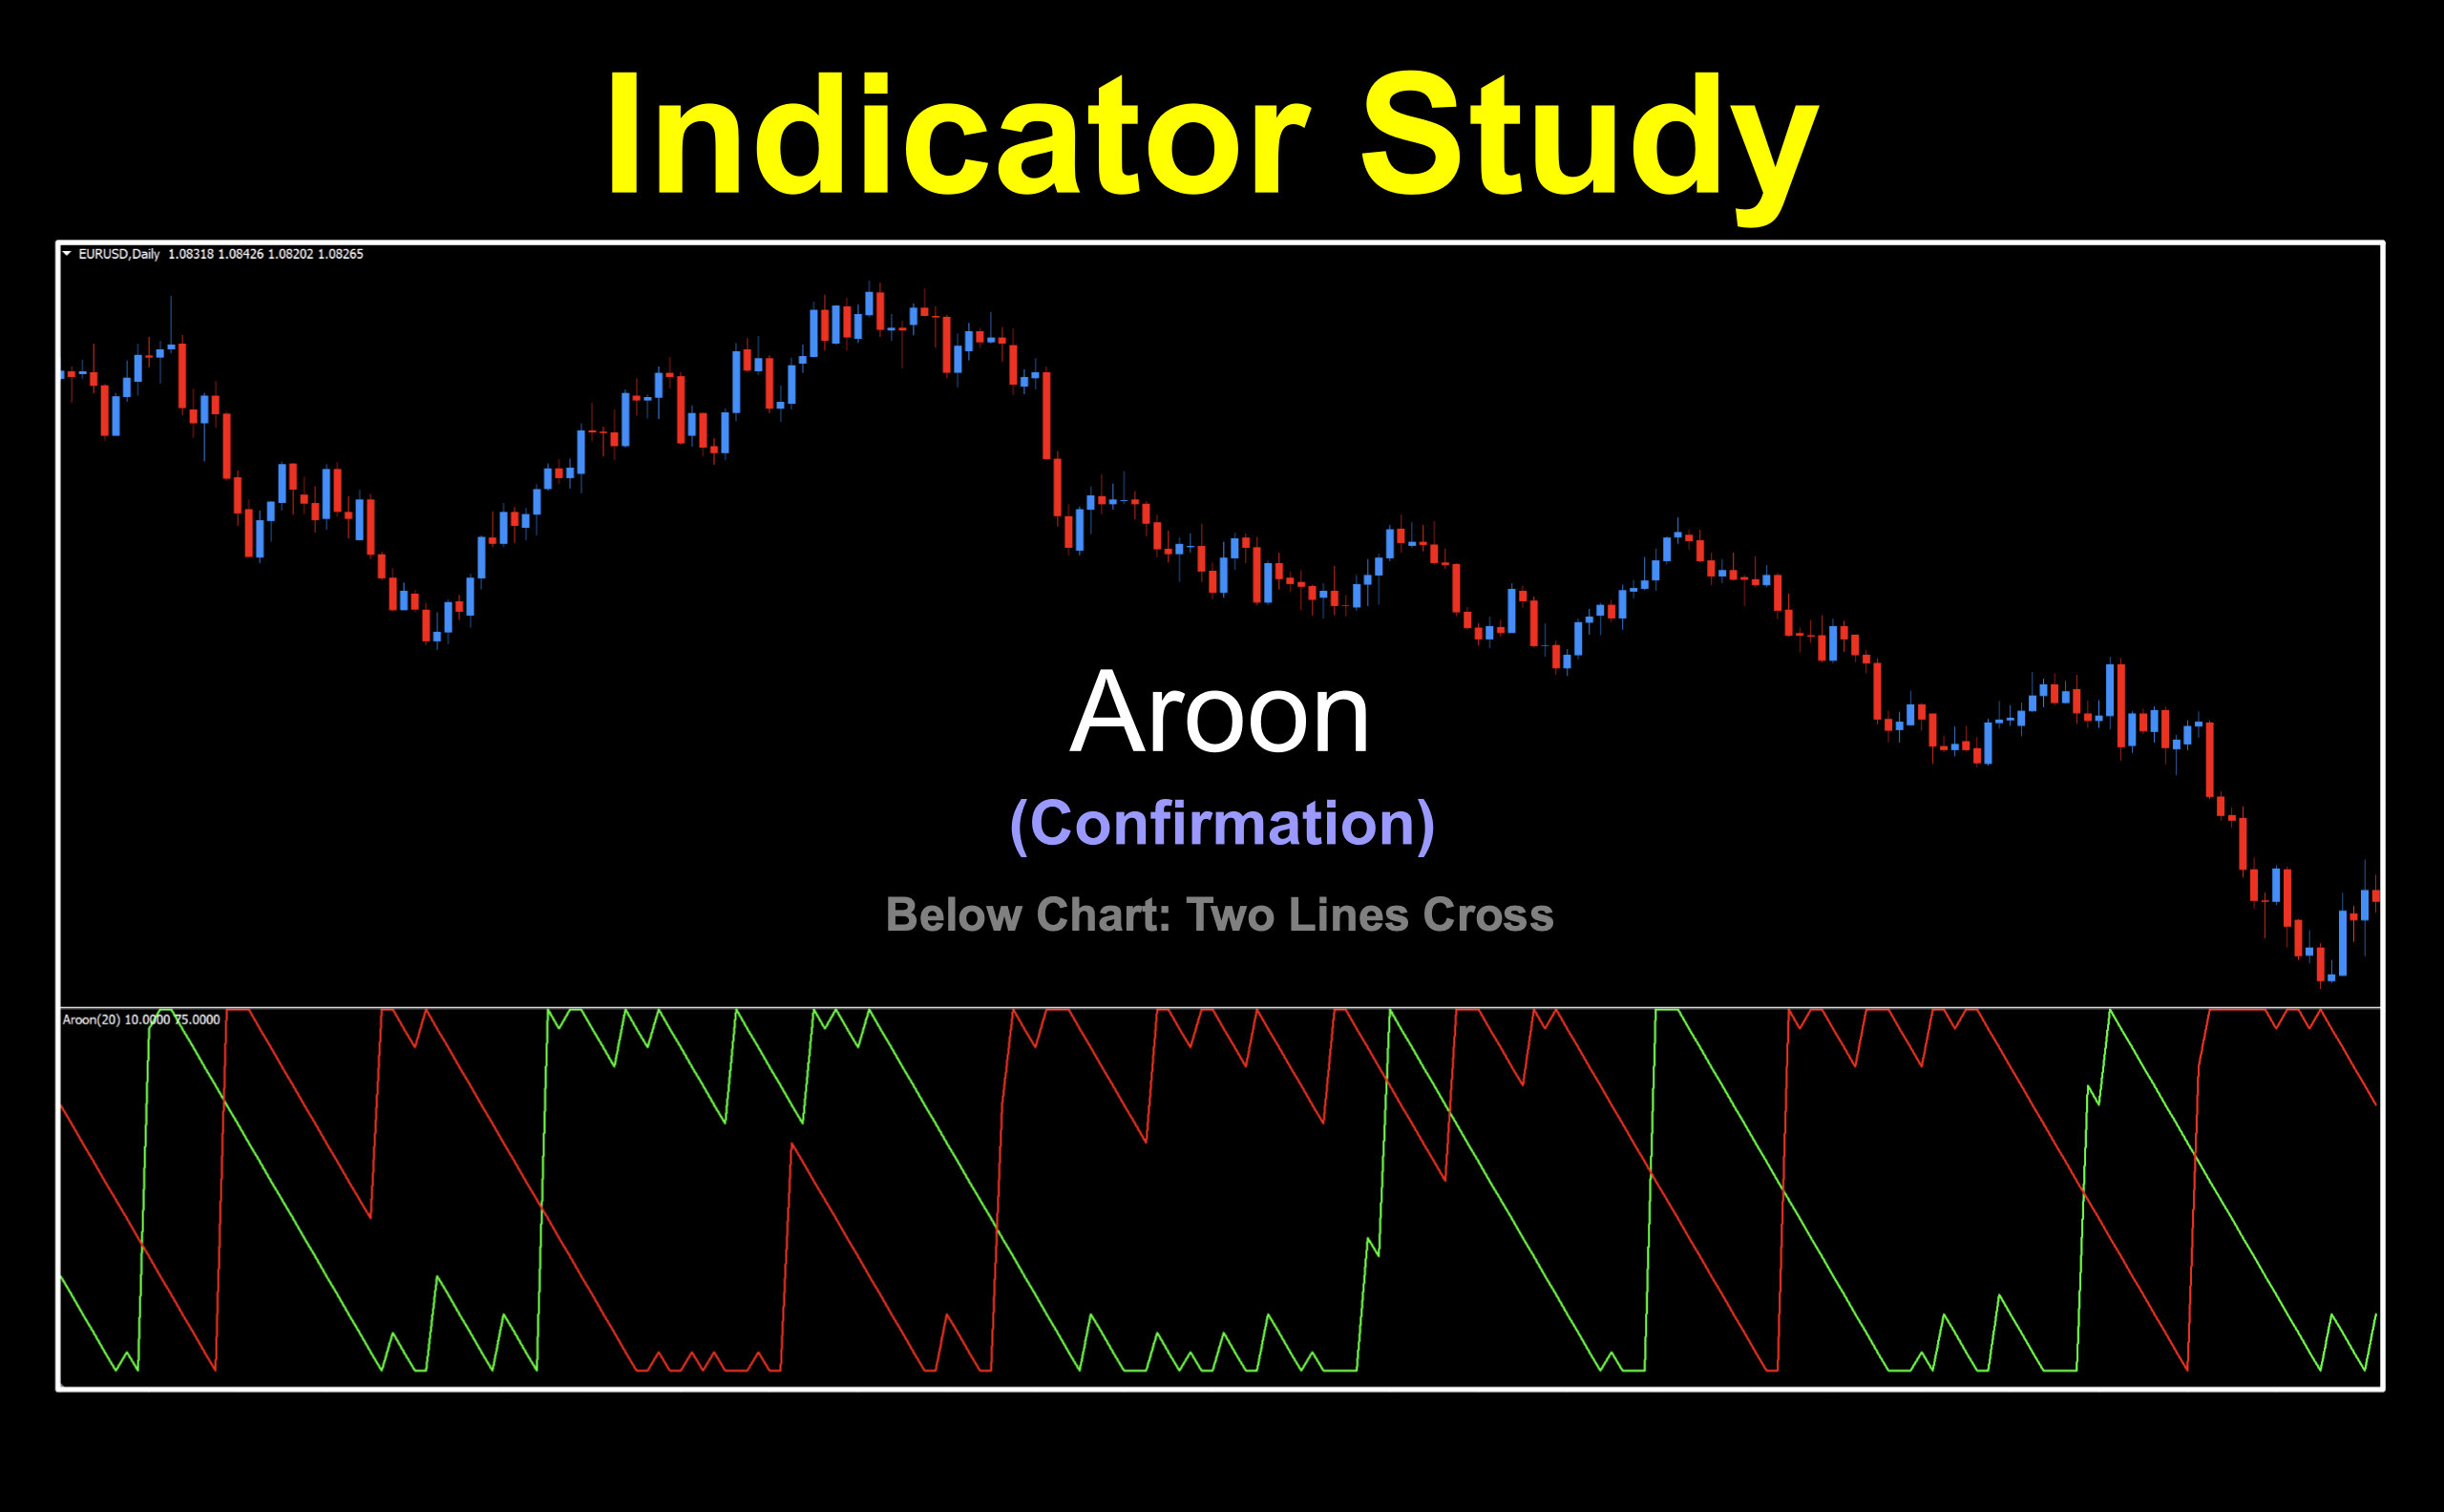
The Aroon Up and Down; also known as the Aroon indicator, is our next confirmation indicator choice. The indicator is derived by calculating how many periods since the last 25-period high (or low), subtracting from 25, dividing by 25, then multiplying by 100 and creates a signal when one line crosses over the other.
The Man…The Myth
Developed by Tushar Chande in 1995, and it was originally designed to determine whether a stock is trending (or not) and how strong the trend is, but it also works well for FOREX currency pairs. Fun fact: “Aroon” means “Dawn’s Early Light” in Sanskrit, and the reference is meant to highlight the indicator’s ability to reveal the beginning of a new trend.
Advantages
* Clear signals without confusion
* Designed to determine when a new trend is starting
* Can indicate when price is in a consolidation period
* Reflects the strength of the trend in its appearance
Visually Striking
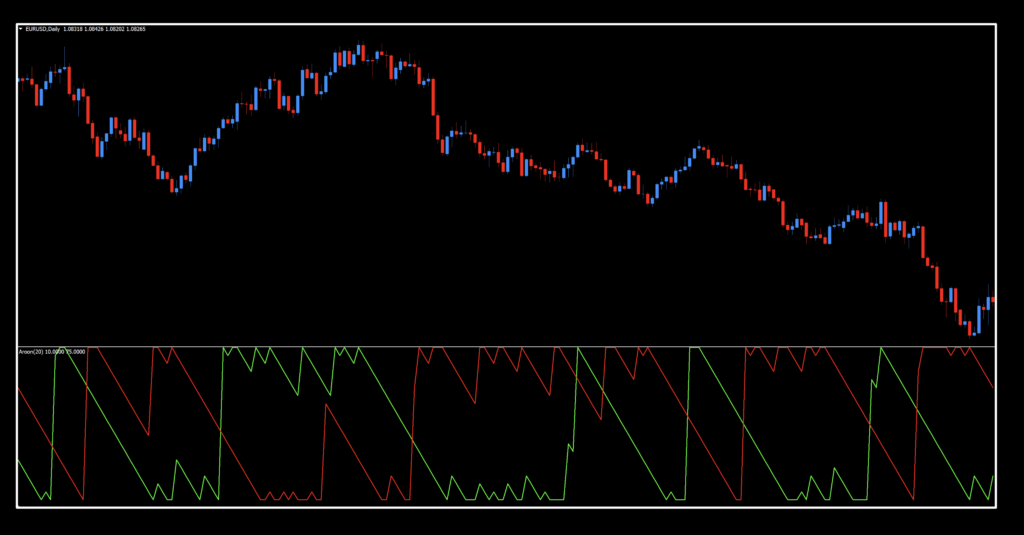
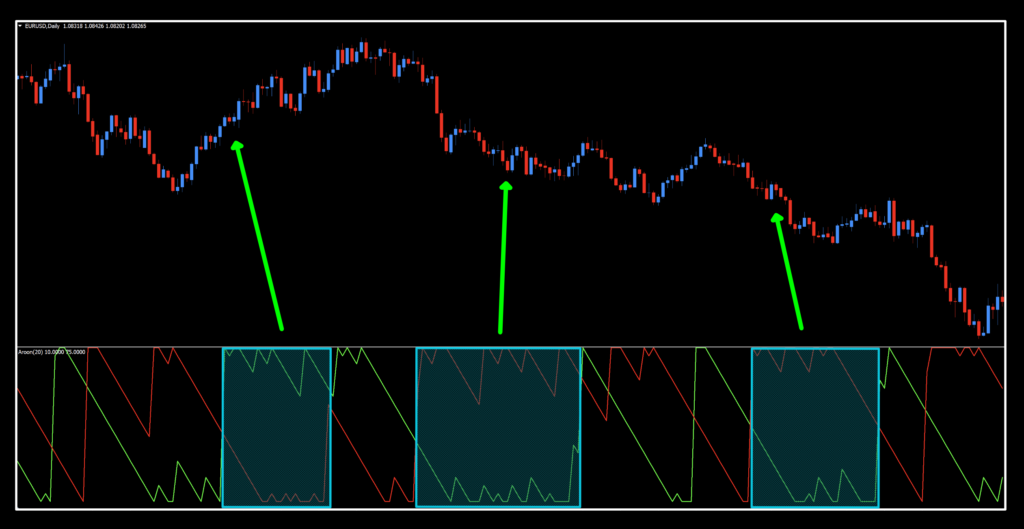
Below is a screenshot of what the indicator looks like; however, we made a few minor changes to the signal lines. The default image has them colored blue and yellow, so we felt it was easier to identify the signals by changing them to red and green.
How We Use It
One of three actions need to happen in the last 30 minutes prior to the close of the trading day. They are; opening, maintaining, or closing, a position. This is when you make your trading decisions, and not actually wait for the close at 1700 EST, because we trade on the daily time frame.
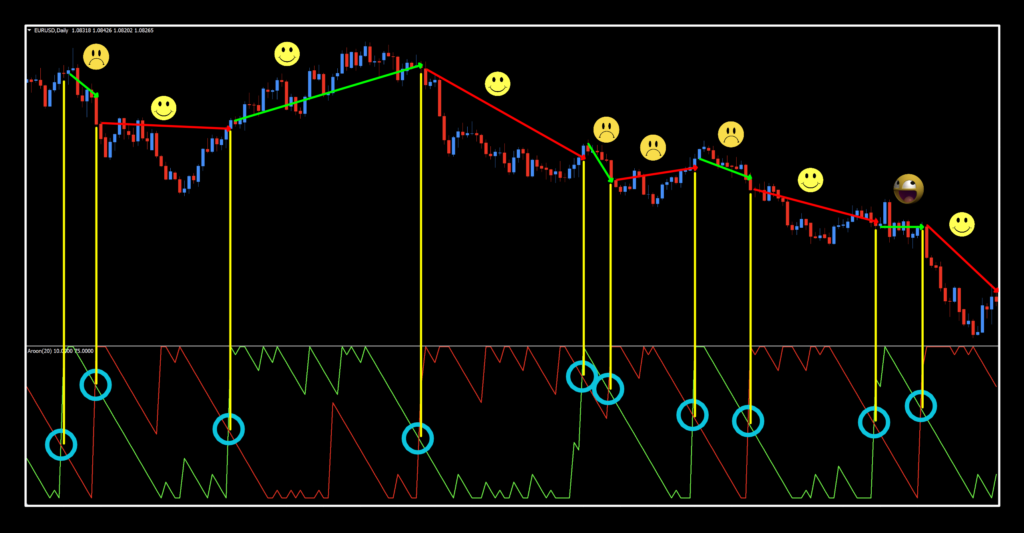
Long: When the blue line crosses up over the red line. Entry is in the last 30 minutes of the trading day.
Short: When the red line crosses up over the blue line. Entry is in the last 30 minutes of the trading day.
Using this Indicator
We’ve taken a snippet of the chart and identified the signals. We’re concentrating on the two lines cross as the signal, although there have been instances of some using the mid-line as a secondary signal as well. How you decide to use it is your decision…which makes what we do one of the best things on the planet.
Trend Identifiers
One other feature worth noting is the relativity between the signals lines.
Flat/Narrow = When the trend is possibly exhausted, the two lines come together or run parallel or have little separation between them.
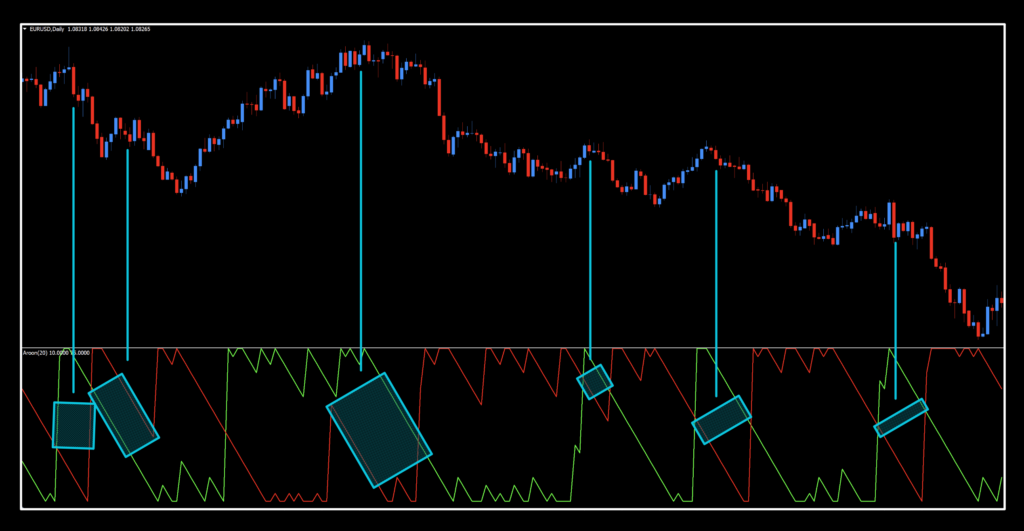
Widespread = a strong trend is evident as the distance between the Aroon up and Aroon down lines are spaced apart, with the strongest part of the trend placing the lines at their extremes.
CAUTION: the spacing of the signals lines should not be the reason to take action. You would be quite the frantic trader if you initiated/maintained/closed a trade every time the lines converged or diverged. Stick to the signal lines crossing when it comes to trading.
Settings
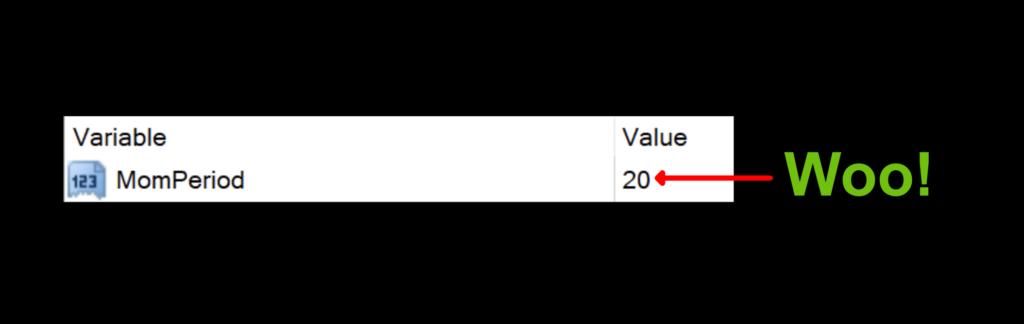
The one setting includes; MomPeriod. The default setting is 20, which controls the number of periods used to calculate the value of the signal. We’ve seen others with different default settings (usually 14), but in the grand scheme of things, it’s really not a big deal. Some versions have an alert function which can be toggled on and off.
Testing and Results
Below are the testing results.
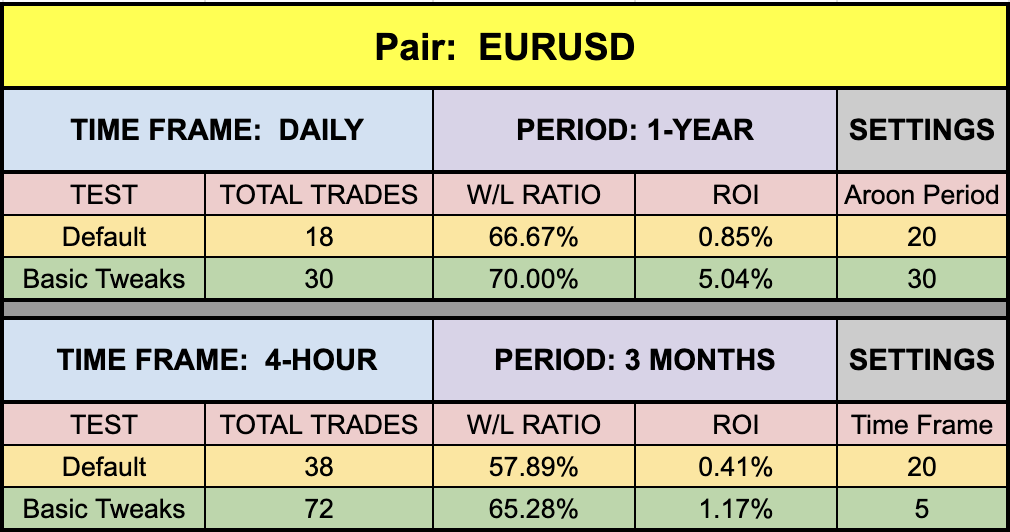
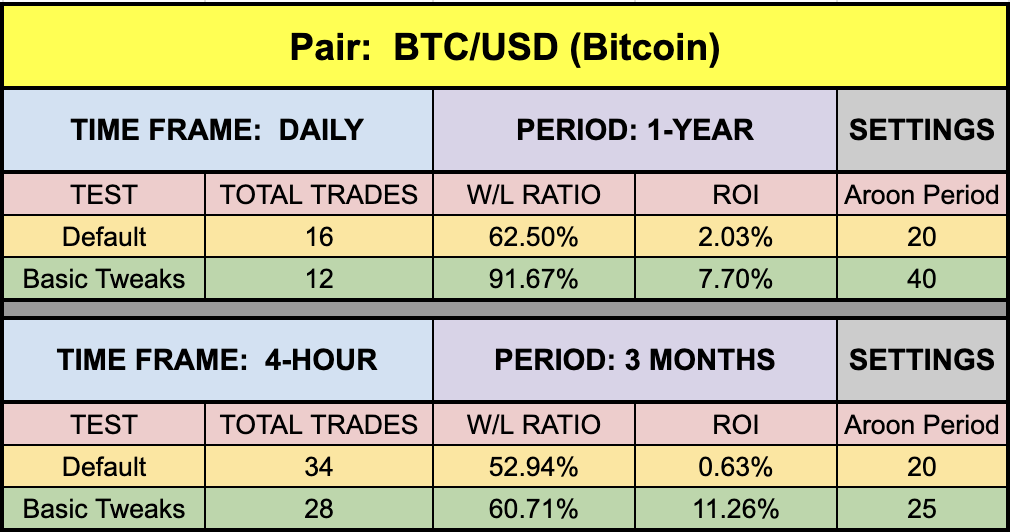
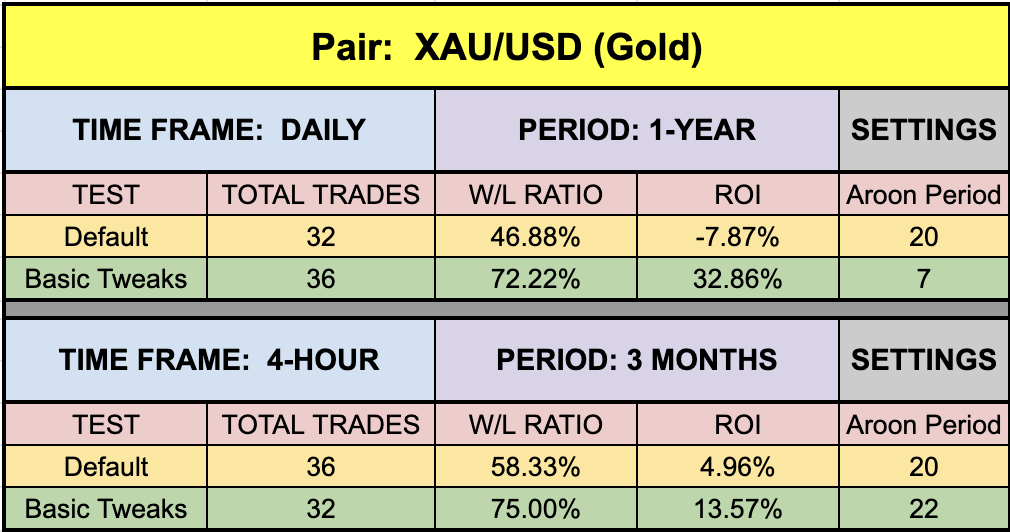
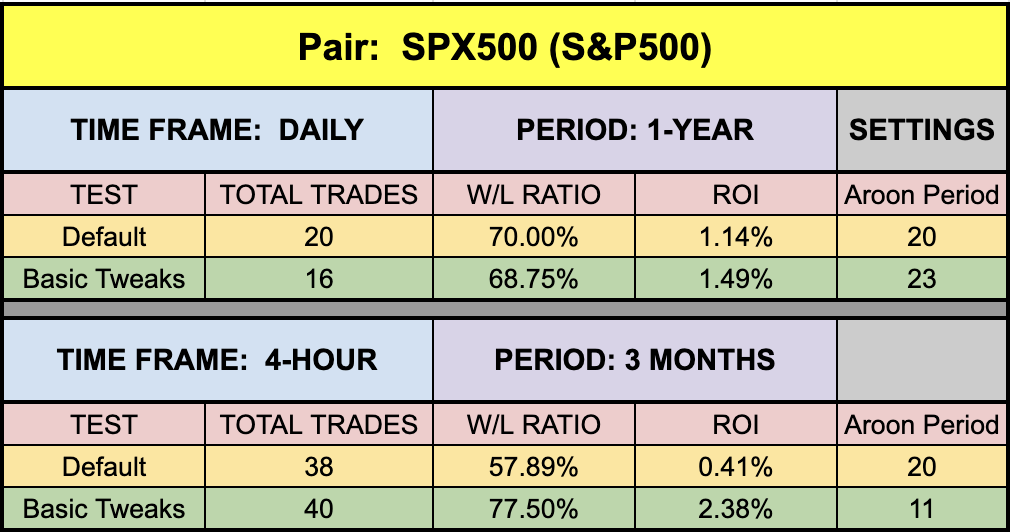
Soft Serve
The first thing that jumped out at us was just how soft the numbers were on the SPX500. EUR was a bit low, and surprisingly, so was BTC, or lower than it typically is. XAU is still holding its own. The number of trades also as something to do with it, as this indicator tends to provide signals over a longer period of time. So, once you’ve exited a trade, waiting for a new signal lowers the frequency of actual open trades. Does this mean it doesn’t perform well in an algorithm. That would be a big fat “no”. Remember, these studies are looking at an indicator in a vacuum of sorts, where we’re ignoring other factors of a trading system.
Resources
The indicator is available for download on our site from the indicator library for no charge. When you’re ready to get it, click HERE. For more detail about this indicator, check out the article at the Investopedia site; Aroon Oscillator Definition — Technical Analysis. Be sure to subscribe to the Stonehill Forex YouTube channel for the technical analysis videos. Sign up for the Advanced NNFX Course HERE.
Our only goal is to make you a better trader.
BTW – Any information communicated by Stonehill Forex Limited is solely for educational purposes. The information contained within the courses and on the website neither constitutes investment advice nor a general recommendation on investments. It is not intended to be and should not be interpreted as investment advice or a general recommendation on investment. Any person who places trades, orders or makes other types of trades and investments etc. is responsible for their own investment decisions and does so at their own risk. It is recommended that any person taking investment decisions consults with an independent financial advisor. Stonehill Forex Limited training courses and blogs are for educational purposes only, not a financial advisory service, and does not give financial advice or make general recommendations on investment.