Our Next Indicator Choice is…
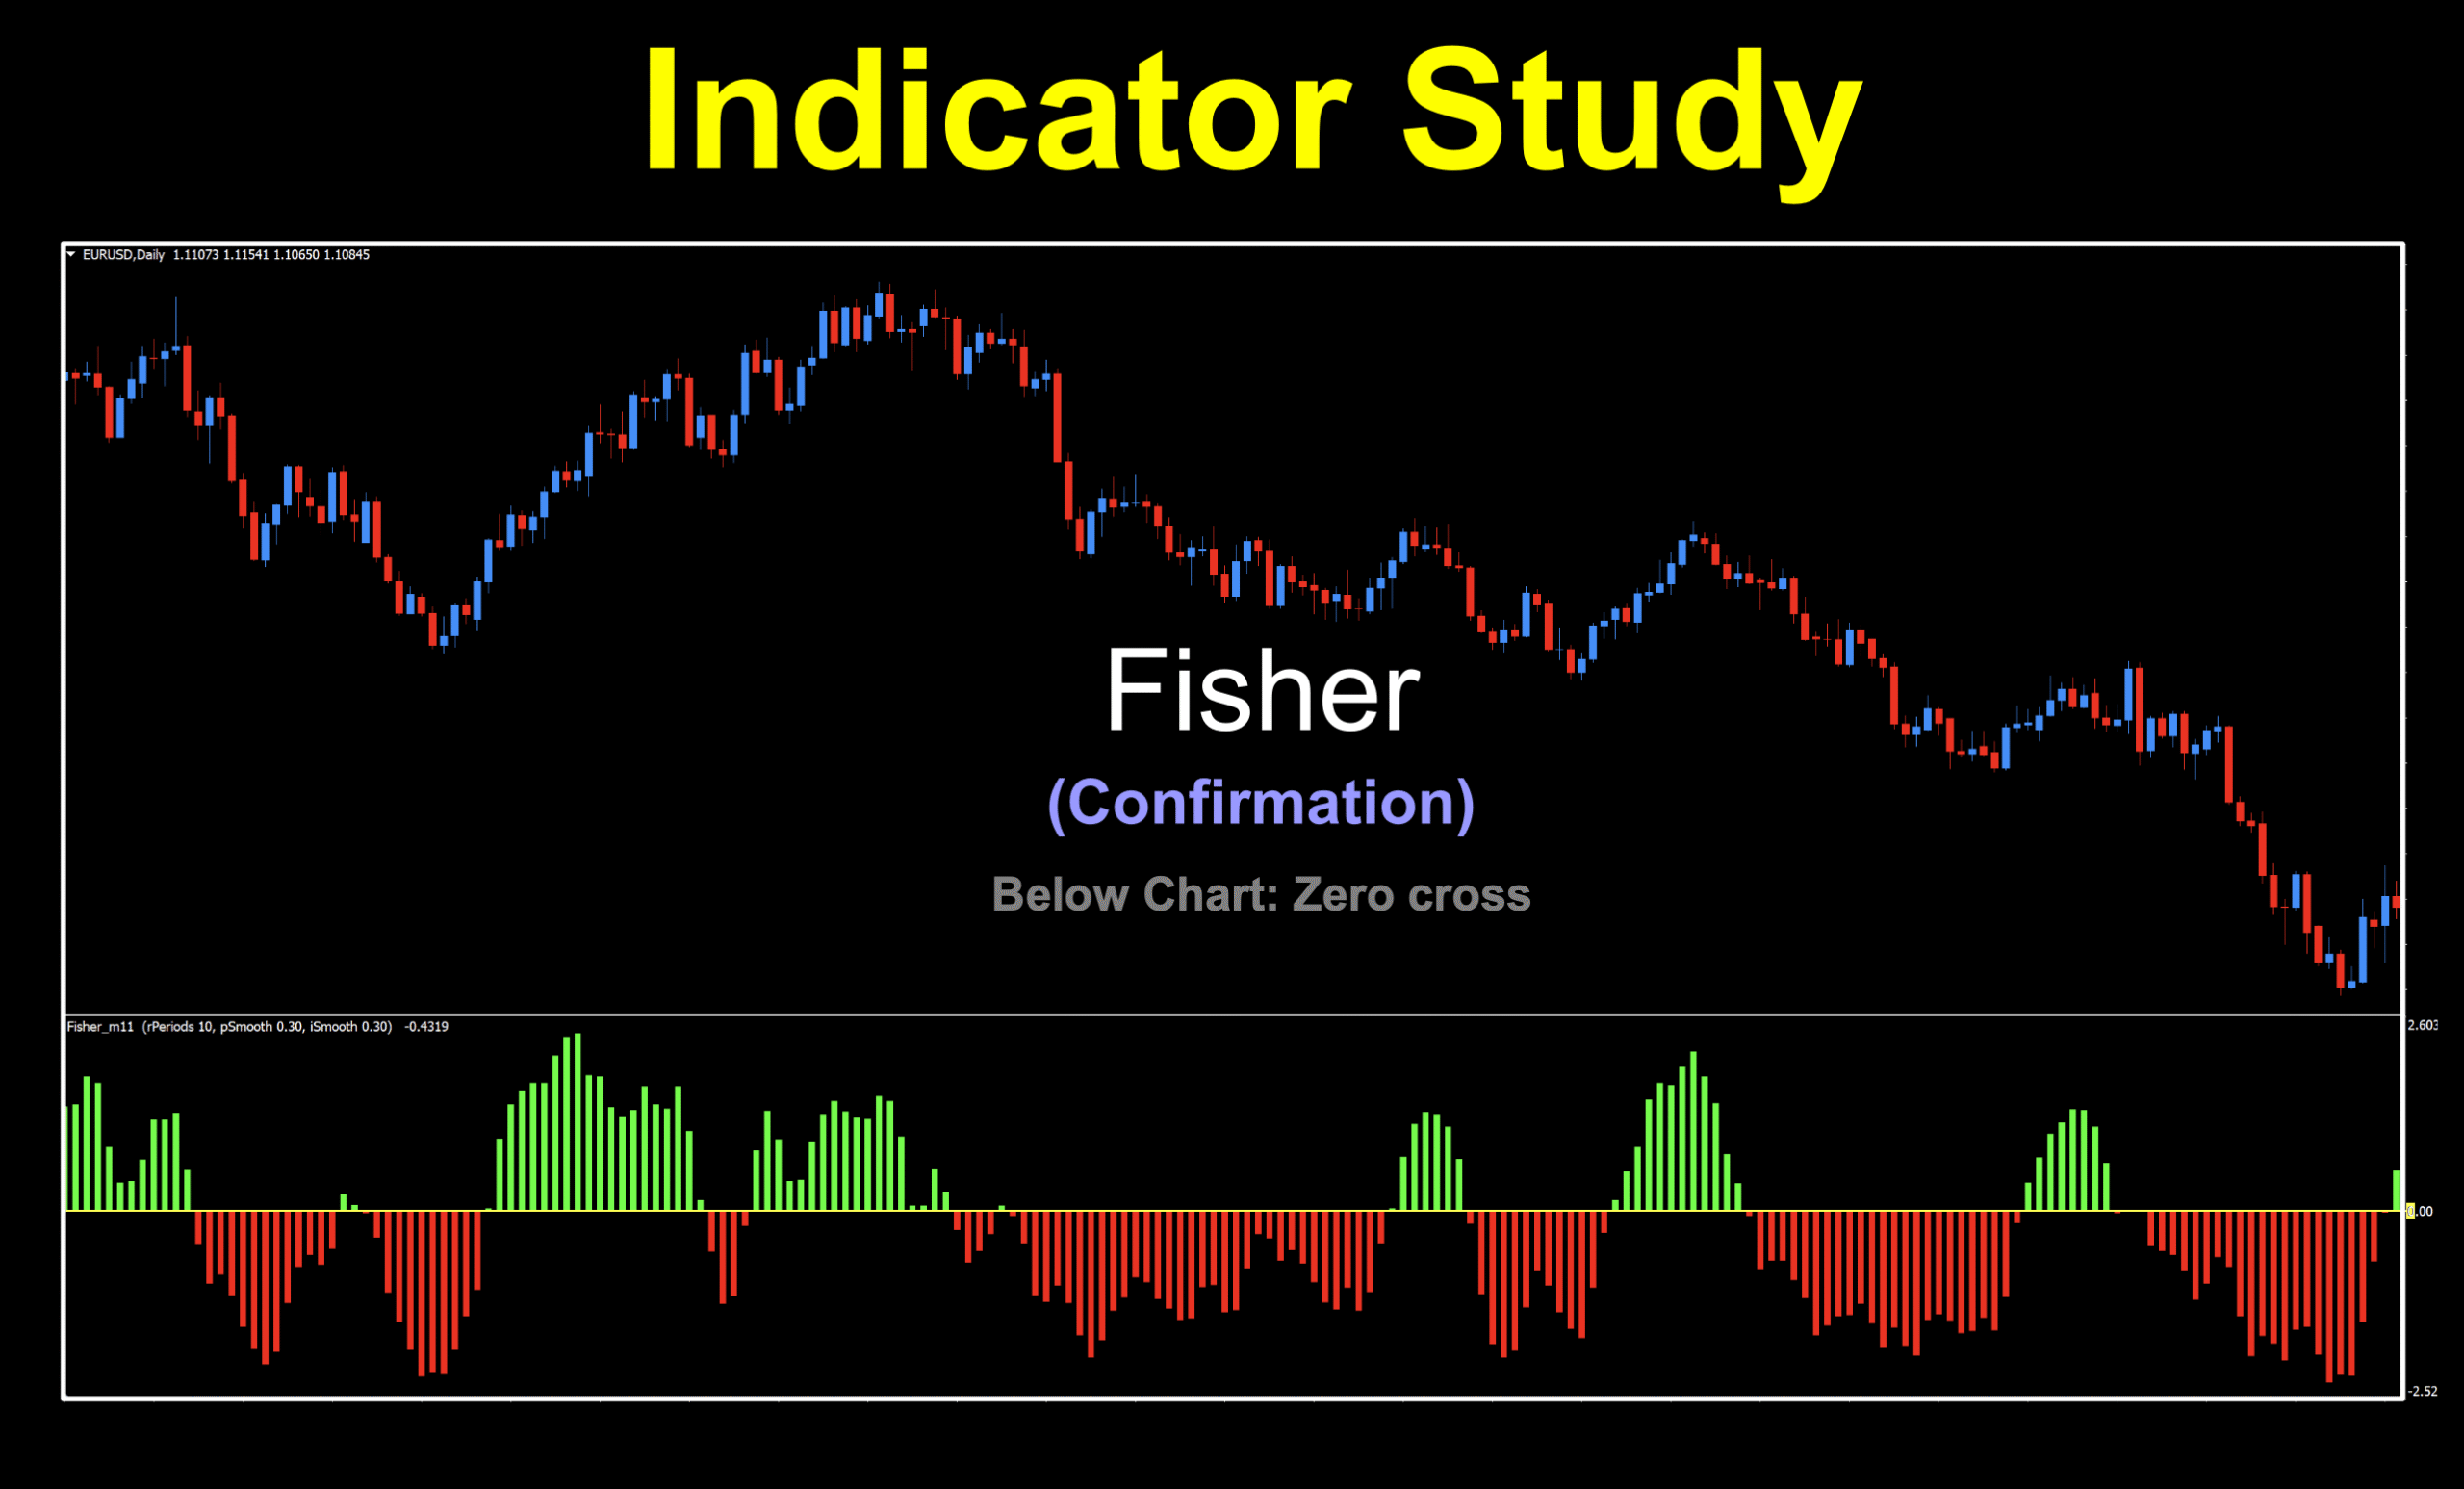
We’ve chosen the Fisher Indicator as our next confirmation indicator choice. Earlier versions were repainting — something we covered in another blog (click HERE if you want to read up on that). This version of the Fisher Indicator is displayed as a green and red colored histogram, using a zero line as an origin point.
Updated Version
This version of the indicator is an updated version of the “Fisher Transform” indicator, developed by the incredible John Ehlers and first discussed in his book, “Cybernetics Analysis for Stocks and Futures” in 2004. The original version was used to help identify turning points in the market; however, it actually works better as a trend identifying indicator, especially for our style of trading.
Updated Blog
We also went through and slimmed down the blog, added additional graphics, tweaked a few things and most importantly, updated the resting results.
Histo…what?
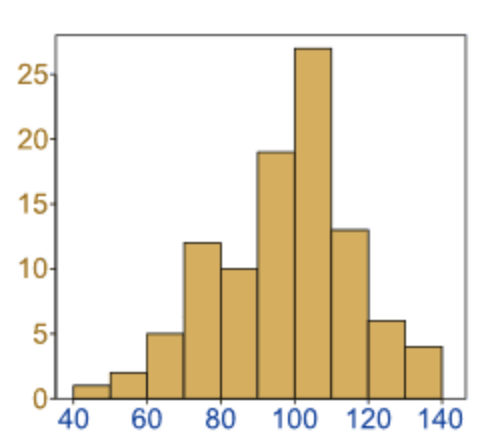
For those who are not sure what histogram bars looks like, think of a bar chart. Each bar represents a group of numbers clustered into ranges, as depicted in the image below.
The degree of amplitude (height) each bar departs from the zero line (both above and below) represents the direction and strength of the trend. While we’re not concerned with the height of the bar, the color (and its relationship to the zero line) are what we’re interested in.
The math behind the indicator is based on minimum and maximum price levels from prior periods, with some advanced calculations which examine the relationship between the current price and past data. But, don’t worry about the math, just the colors.
Advantages
* Visually discernible
* Aids in identifying prevailing market trends
* Possible aid in foretelling momentum exhaustion
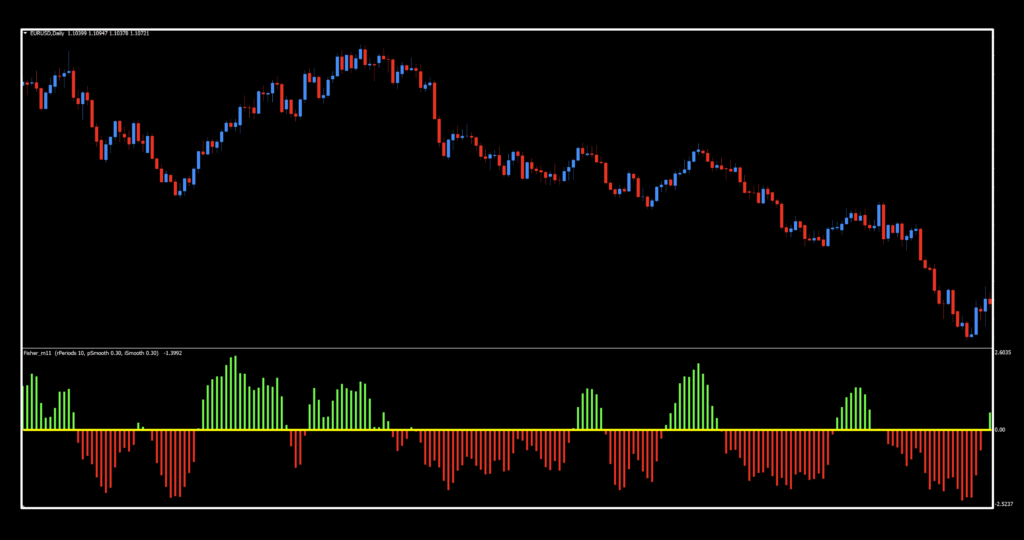
Below is a screenshot of what the indicator looks like on the daily time frame. The colors of the indicator are stock, which is nice, as nothing really needs to be changed. We just added a yellow zero line for visibility.
How we Use it
One of three actions need to happen in the last 30 minutes prior to the close of the trading day. They are; opening, maintaining, or closing, a position. This is when you make your trading decisions, and not actually wait for the close at 1700 EST, because we trade on the daily time frame.
Long: When the histogram bar rises above zero and turns green. Entry is in the last 30 minutes of the trading day.
Short: When the histogram bar falls below zero and turns red. Entry is in the last 30 minutes of the trading day.
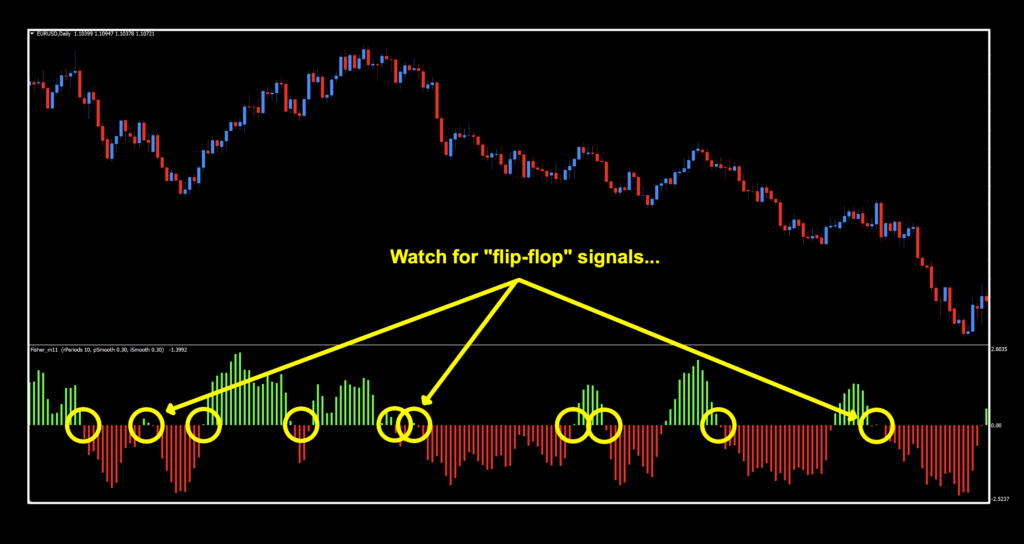
Flip-Flop
The “Flip-flop” moments happen when price action loses its volatility and treks sideways enough to trigger signals in both directions within a short time period. It’s normal and tells you that the indicator is doing its job (reacting to price). So this C1 indicator would pick up changes in direction fairly quickly.
Settings
There are three settings, of which all of them are used.
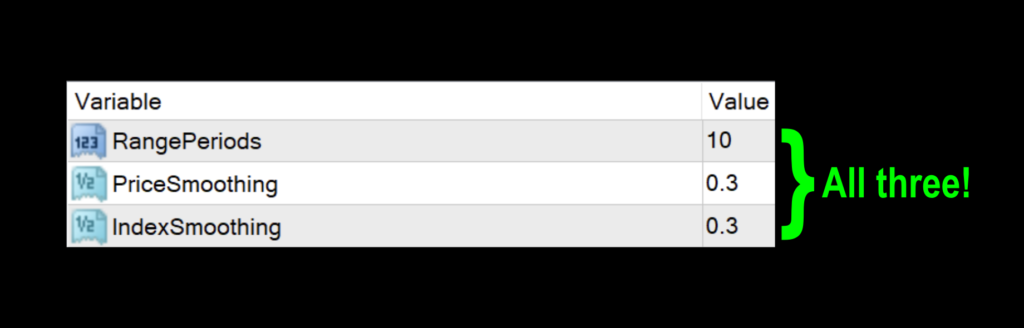
Range Periods: This setting controls the number of bars used to calculate the value of the histogram. The default setting is 10.
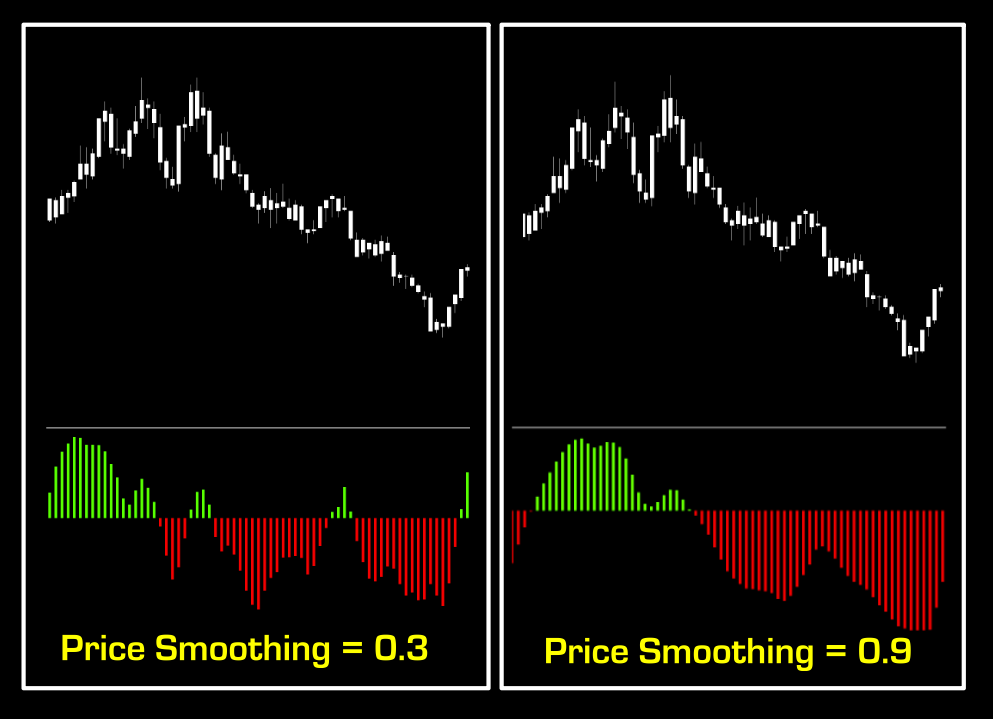
Price Smoothing: Similar to increasing the number of periods in a moving average, this setting smooths out the overall curves of the histogram. See the image below as an example. The default setting is 0.3. *Note – this value must be smaller than 1.0. Below is an illustration of what happens when price smoothing is changed.
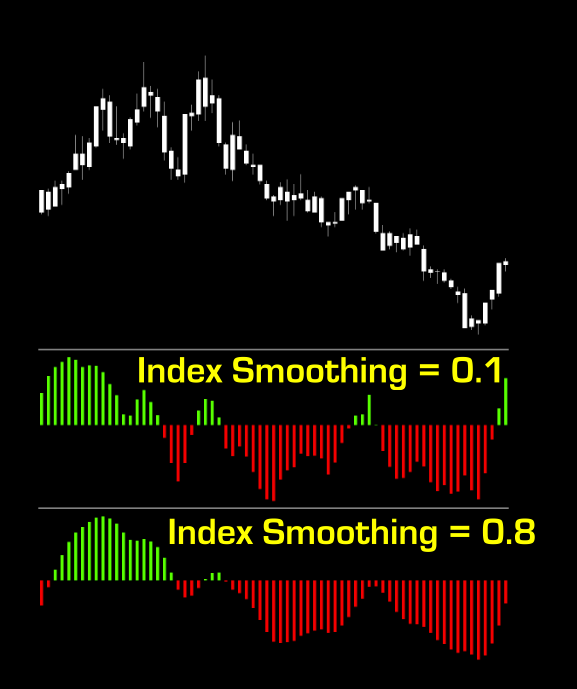
Index Smoothing: This setting is similar to price smoothing with respect to appearances; however, you’ll notice that each individual curve is smoother with higher index values. The default value is 0.3. *Note – this value must be smaller than 1.0. Below is an additional illustration of how this setting affects the indicator.
We’re Gonna Test for Fish
Way back, we suggested testing on the following five Forex pairs. If it doesn’t work on these, then there’s a good chance it won’t work on others. We still stand by this suggestion. It’s a lot quicker than testing through the 36 pairs.
EUR/USD
AUD/NZD
EUR/GBP
AUD/CAD
CHF/JPY
And the Outcome…
Below are the spreadsheets exhibiting the results from our tests.
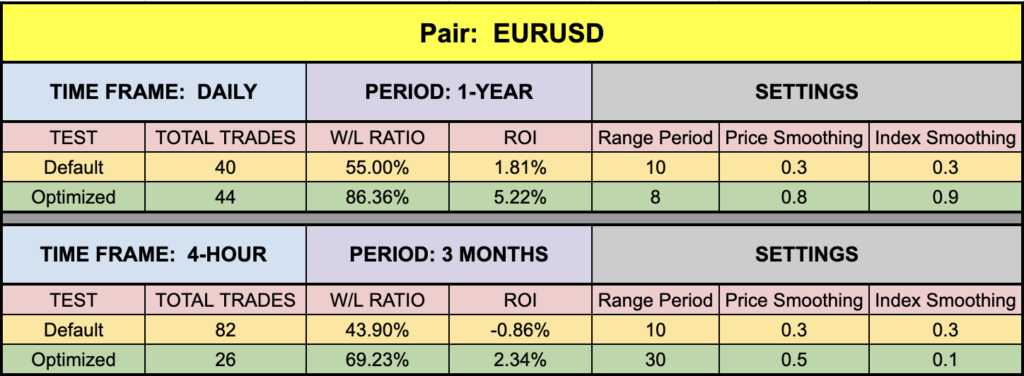
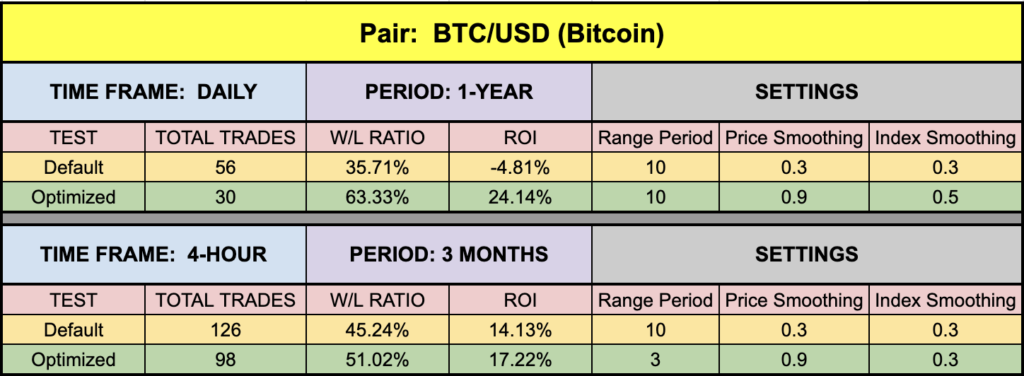
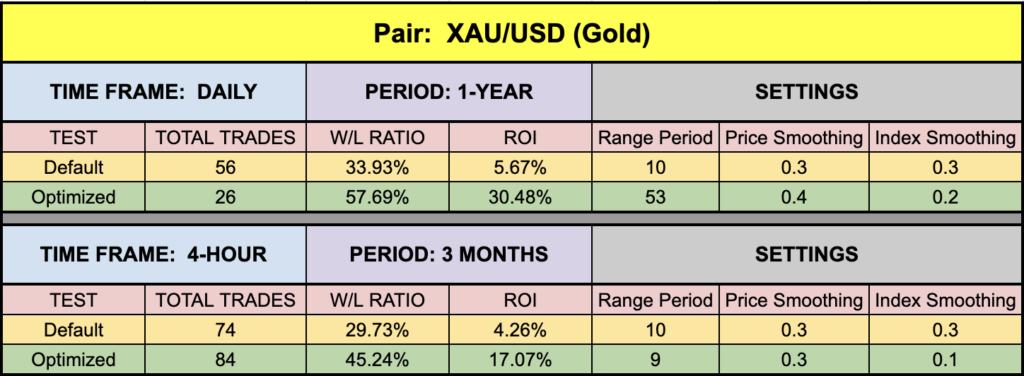
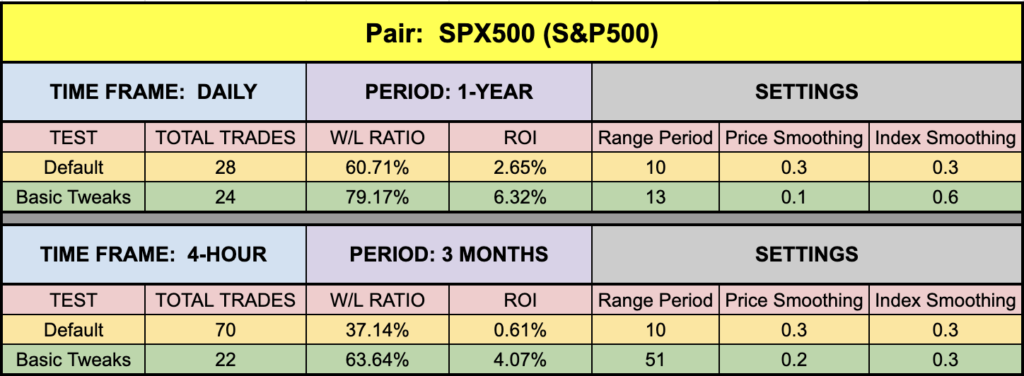
We’ve Got Opinions
Overall, not bad. They were better than the original posting’s numbers, so that’s a good sign. XAU and BTC did well (naturally), but even on the EUR and the SPX, the daily numbers were a bit better than what we’ve been posting. That tells us that this indicator has some legs and should be considered as a possible C1 for your algorithm.
Resources
The Fisher indicator available for download on our site from the indicator library, at no cost to you! When you’re ready to get it, click HERE. Also, be sure to subscribe to the Stonehill Forex YouTube channel for the technical analysis videos. And for the course that can actually get you up to speed a lot quicker than other courses, the NNFX Advanced Course HERE.
Our only goal is to make you a better trader.
*Our published testing results are based on money management strategies employed by the NNFX system and depend on varying external factors, which may be different between individuals and their specific broker conditions. No guarantee, trading recommendations, or other market suggestions are implied. Your results and subsequent trading activities are solely your own responsibility.
BTW – Any information communicated by Stonehill Forex Limited is solely for educational purposes. The information contained within the courses and on the website neither constitutes investment advice nor a general recommendation on investments. It is not intended to be and should not be interpreted as investment advice or a general recommendation on investment. Any person who places trades, orders or makes other types of trades and investments etc. is responsible for their own investment decisions and does so at their own risk. It is recommended that any person taking investment decisions consults with an independent financial advisor. Stonehill Forex Limited training courses and blogs are for educational purposes only, not a financial advisory service, and does not give financial advice or make general recommendations on investment.