TTMS as a Volatility Indicator

TTM Squeeze from John Carter used a color change below chart volatility indicator, not directional.

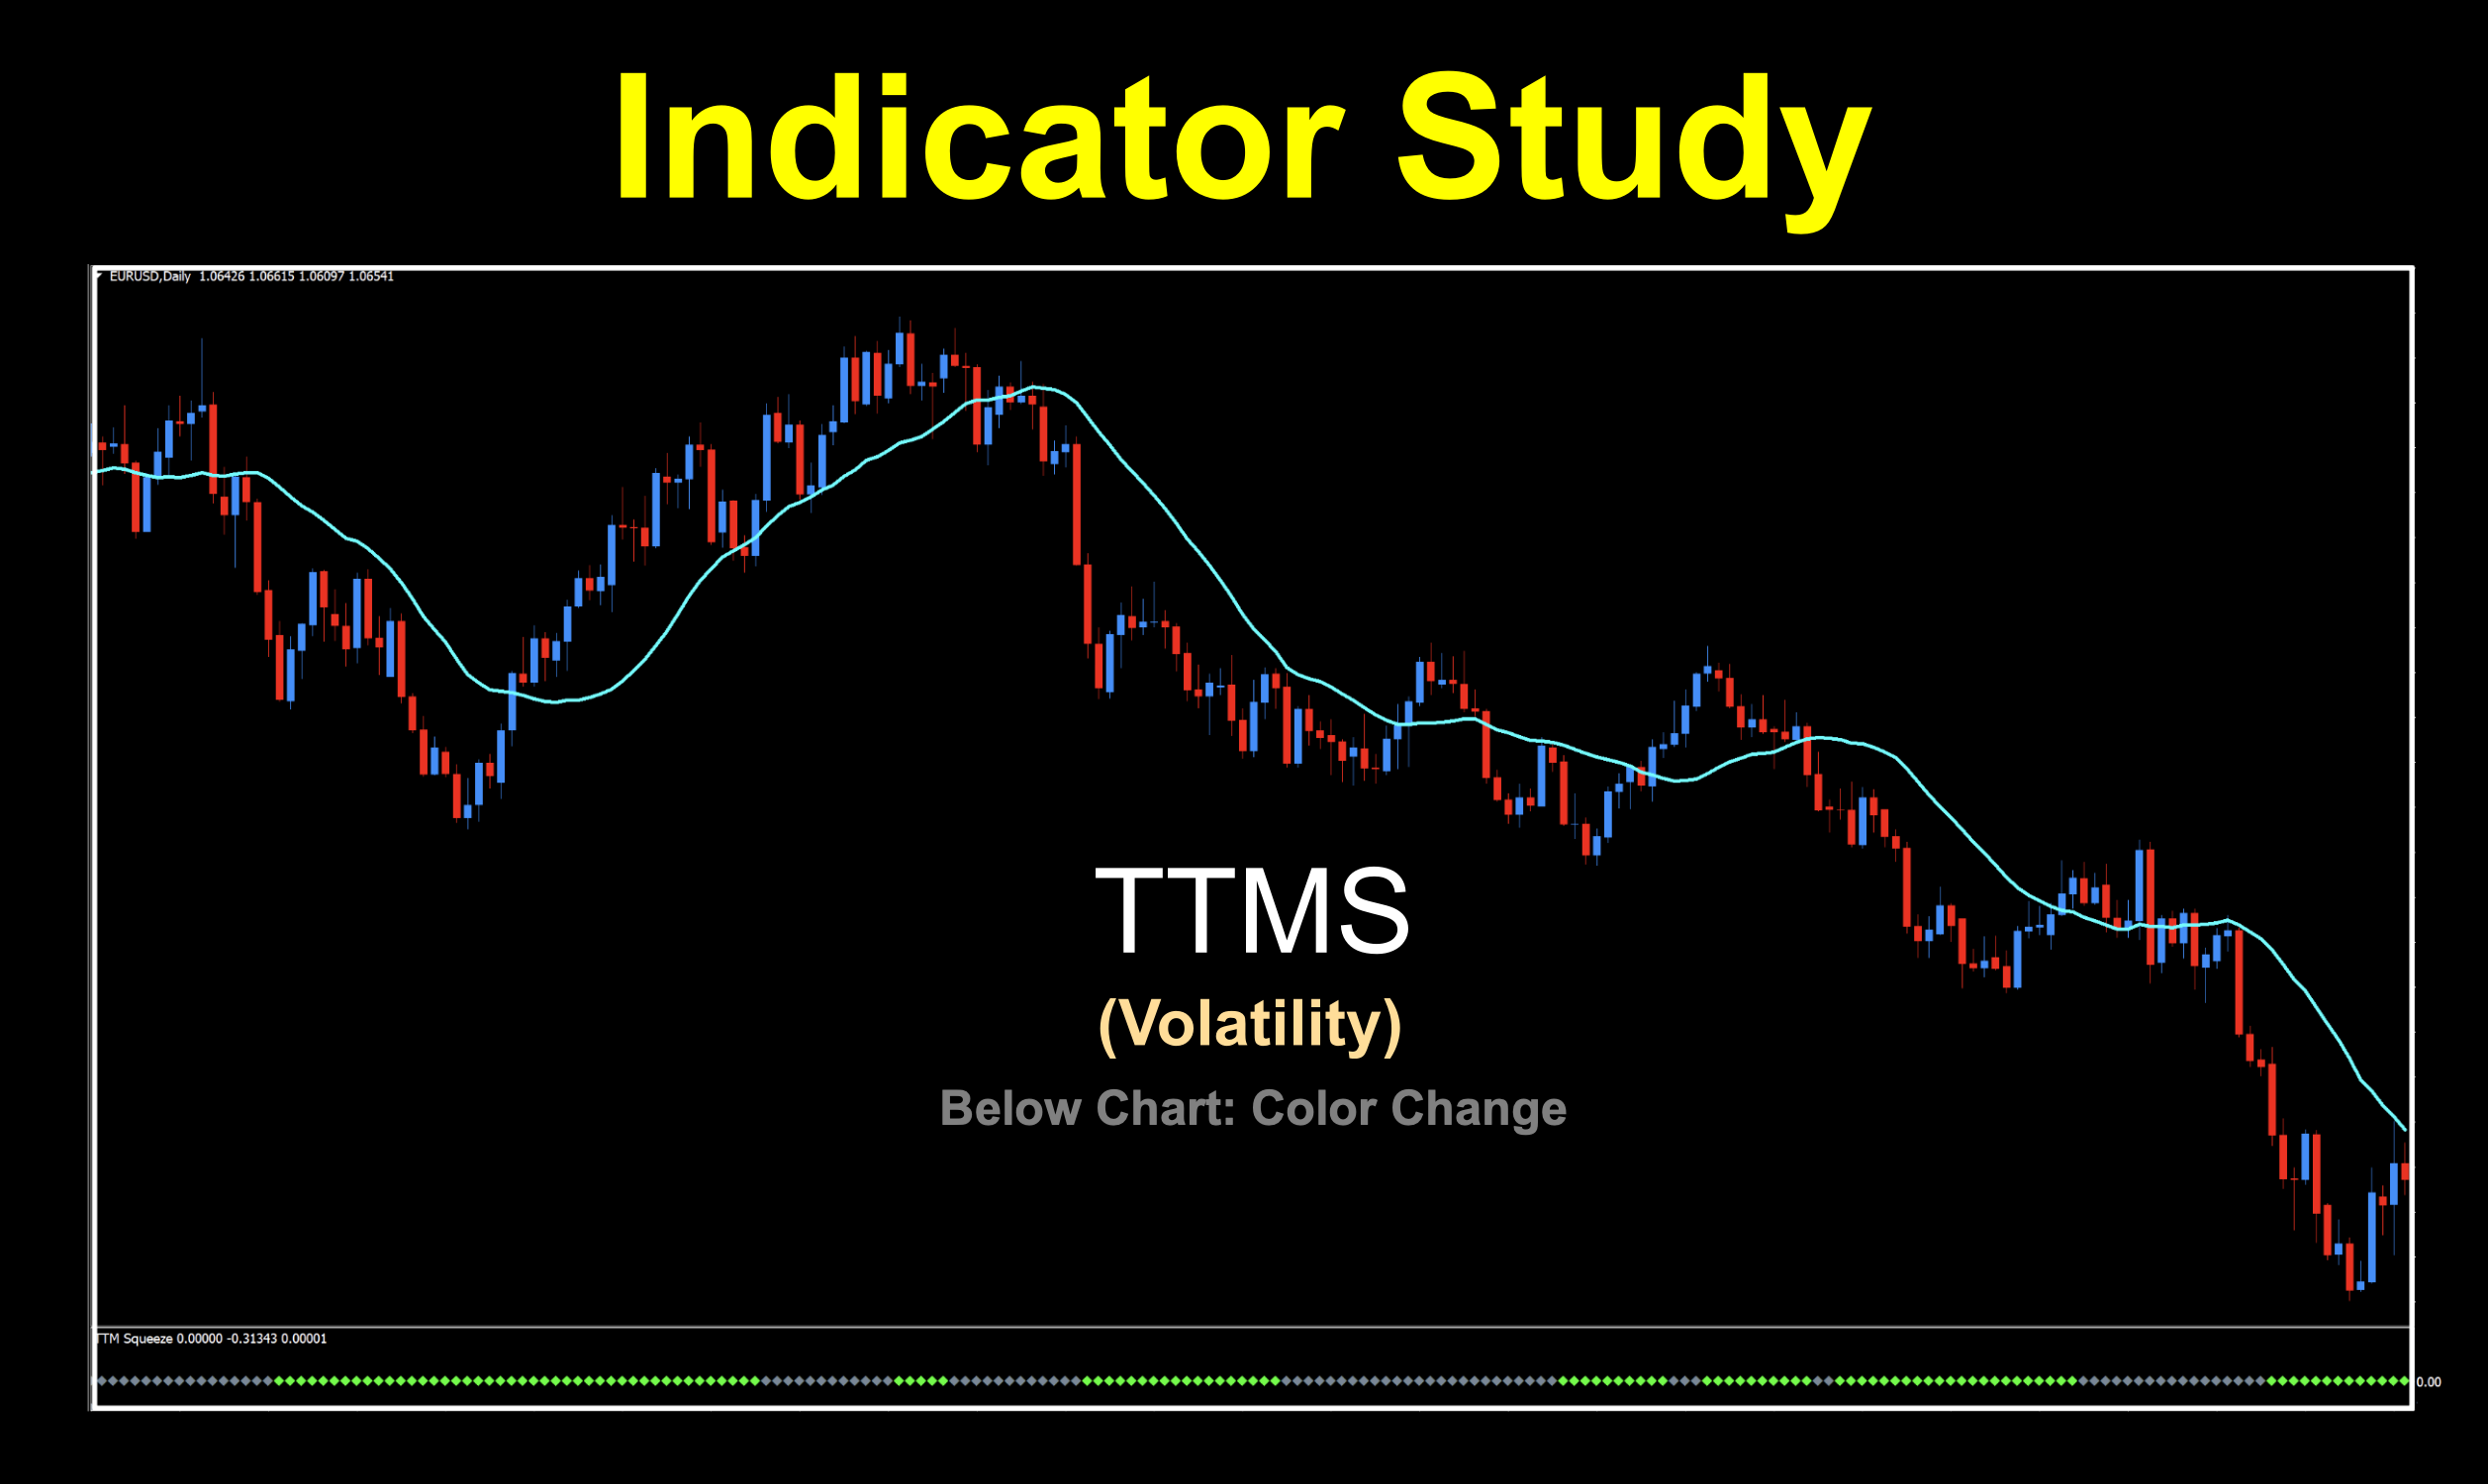
Where’s The Squeeze So, back to the TTMS.  The “squeeze” comes from compression of both top and bottom BBands when they reside inside the Keltner Channel.  This indicates low volatility in the market when price tends to become range bound and moves sideways.  An image of this phenomenon can be found below. It’s during these … Read more

Indicator Testing Settings

Below are the settings used when testing indicators with the NNFX Algo Tester which call on indicator settings and buffers.  We have listed each profiled indicator with; Indicator name (as listed in the library) Class of indicator (Baseline, Confirmation, Volume) Type of indicator (classification) How it was tested (within the EA) Default settings (as tested ... Read more

Indicator Library

Included on this page are downloadable indicators and expert advisors for your own library to help you become a more profitable trader.  Indicators will be added on a continual basis as we examine them through the blog investigative studies and indicator profiles series. Confirmation Kalman Filter – kalman-filter-indicator Zero-Lag MACD – ZeroLagMACD Fisher – Fisher_no_repainting Bears ... Read more
Join Waitlist We will inform you when the product arrives in stock. Please leave your valid email address below.