Variations Abound
We’ve talked about “kissing cousins” before. Those are indicators which are somewhat related but do different things. We’ve got something along those veins with an indicator that gets its beginnings from the TSI (True Strength Index), an item we looked at this past August. That being the case, let’s dive into the gene pool once again and see what this cousin has to offer.
Another Cousin
We also explored another indicator called Ergodic TVI (Tick Volume Indicator) back in May of this year. While they share the same name, they are definitely not the same indicator…so let’s continue.
He, Who?
The “BH” in BH Ergodic are actually the initials of its creator, Bruce Hellstrom. He came up with this tool back in 2007 and has a couple of other indicators to his credit. But according to sources, seems to have
*disappeared*

from the scene, so there’s not much about him that we could find. Who knows, maybe he made his fortune trading and now lives on a tropical island, enjoying umbrella drinks and midnight walks along the beach and chooses to ignore the rest of us.
What it Does
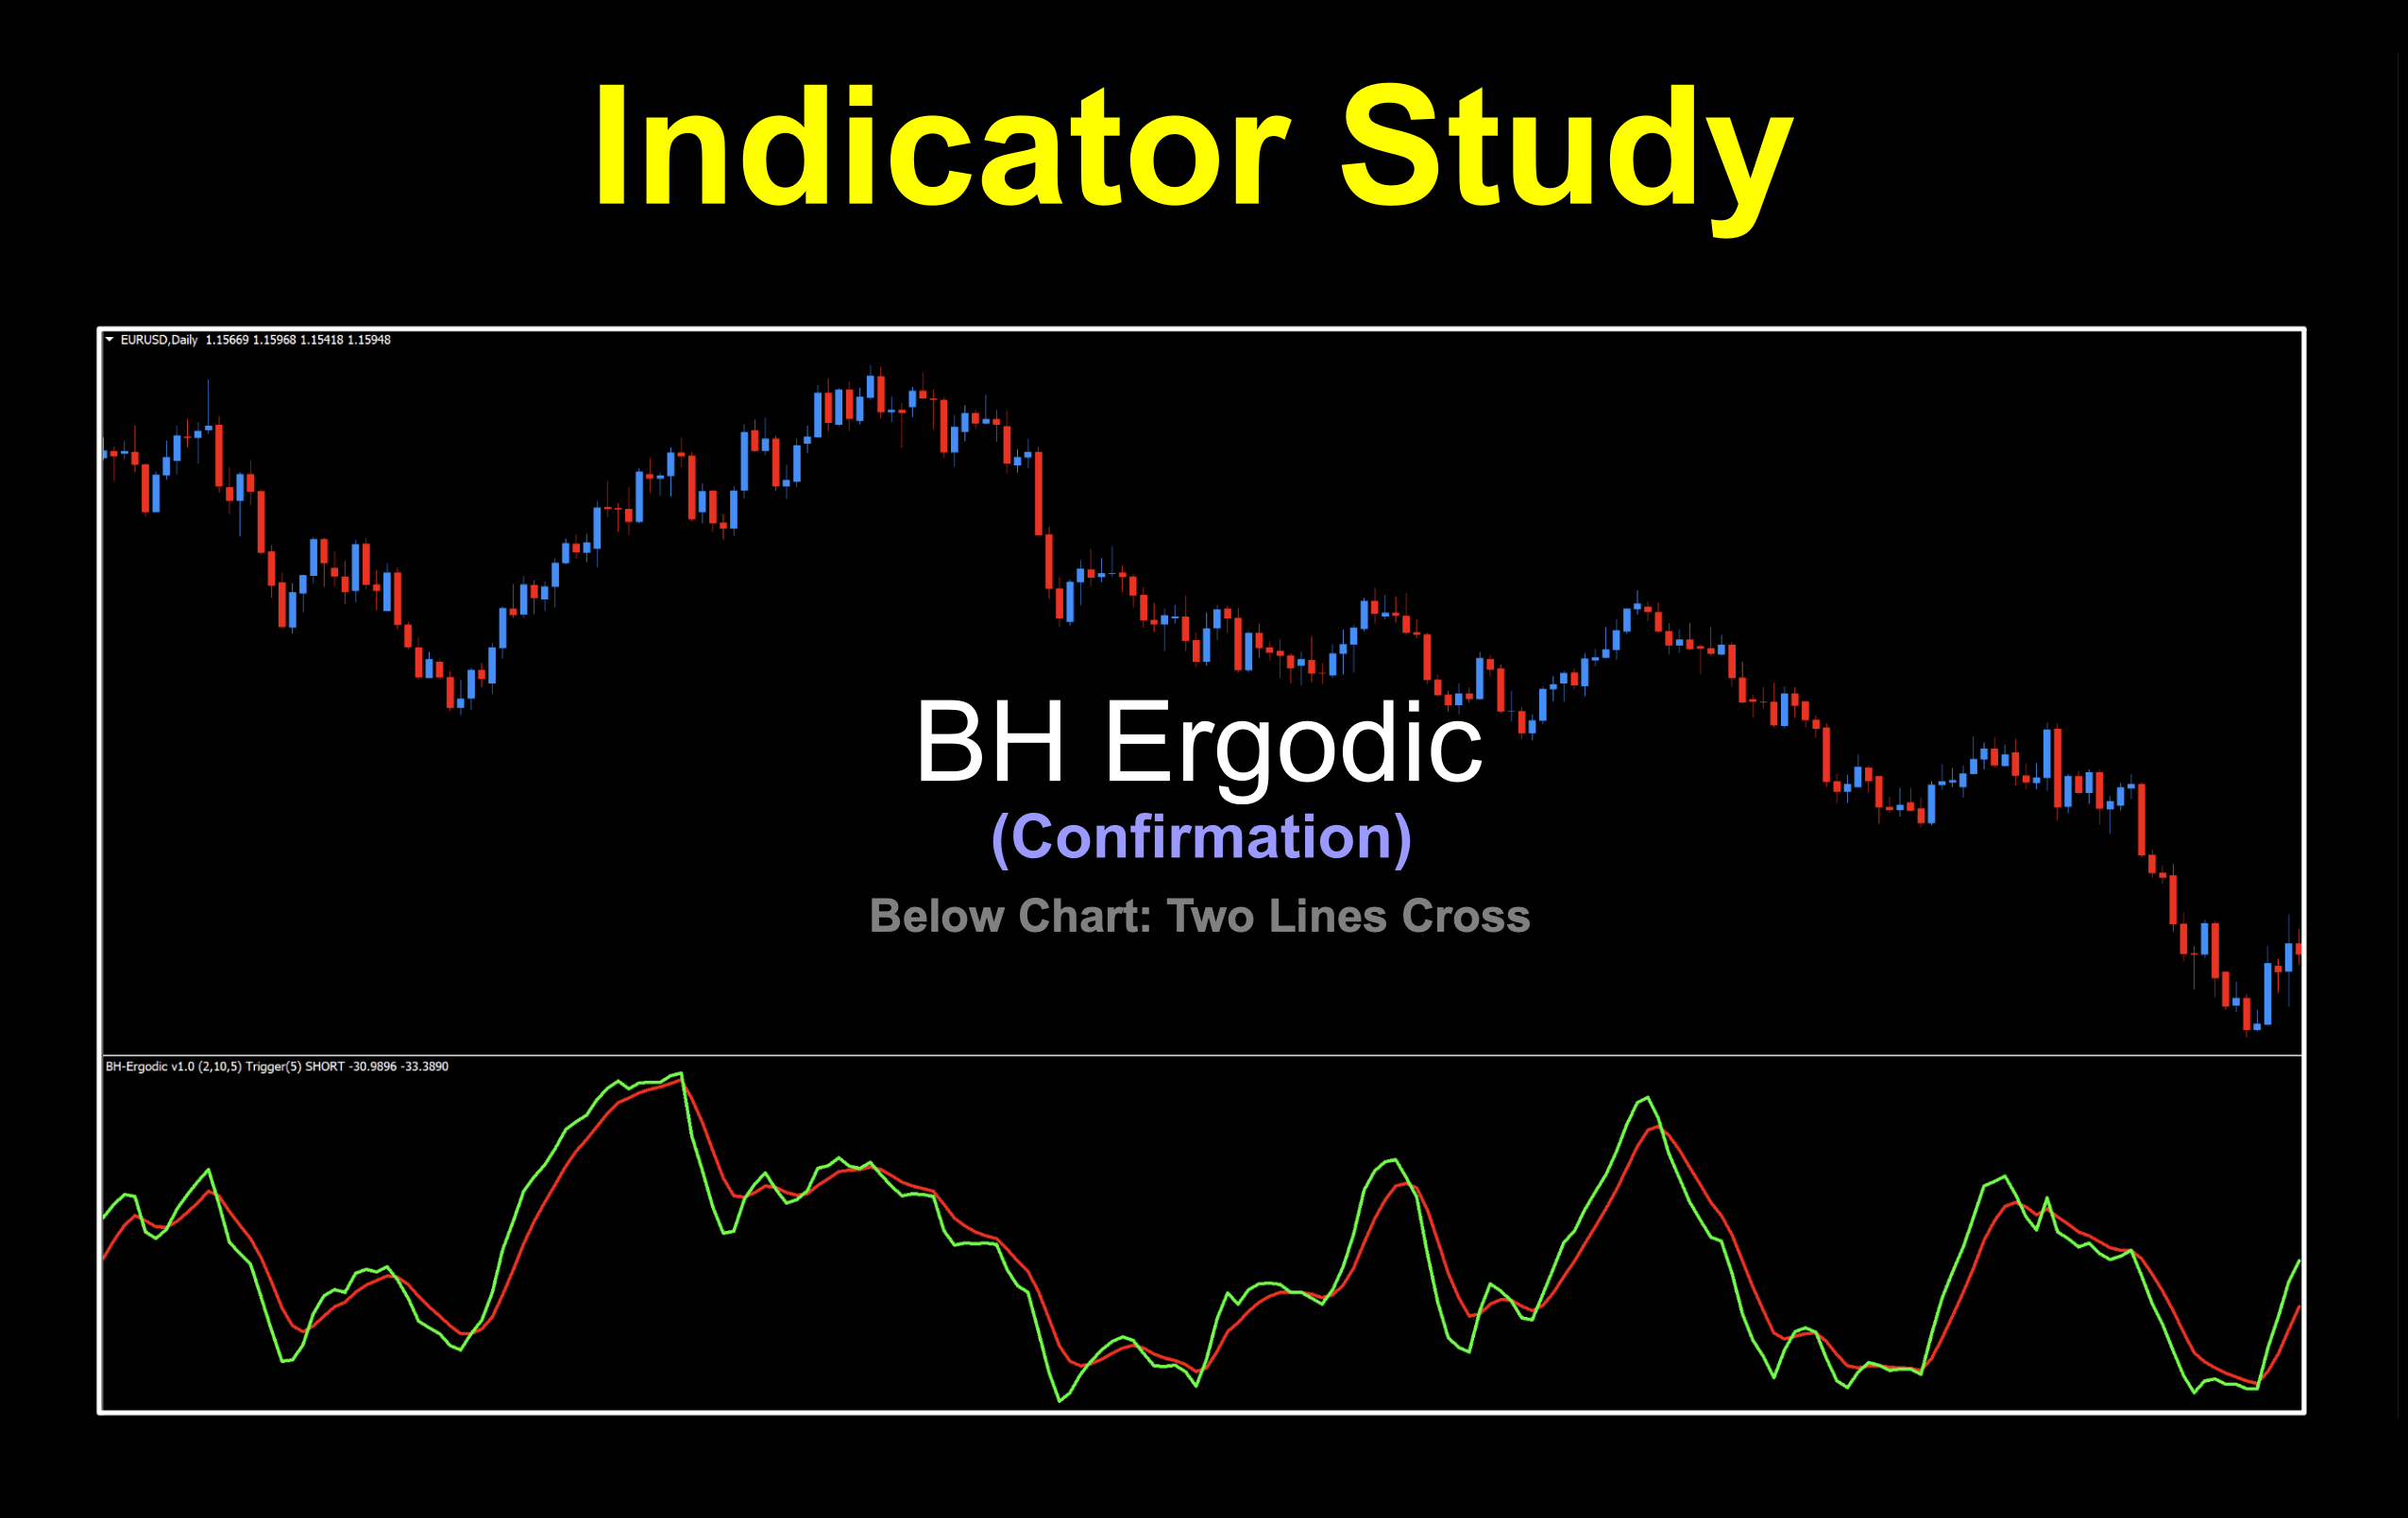
The BH Ergodic has two lines, making it a below chart, two lines cross indicator. The Ergodic line (green) is calculated in the same fashion as the TSI, except it’s double smooth. The signal line (red) is an exponential moving average of the Ergodic line. Together, they create our long and short signals, depending on which is on top of which. We’ll take a closer look shortly.
Crosstown Traffic
Let’s check this two lines cross ditty out and see what we can see. The default colors are not great so we had to make some changes. Originally, they’re dark turquoise and yellow lines so we changed them into something more relatable; green (Ergodic) and red (Signal).
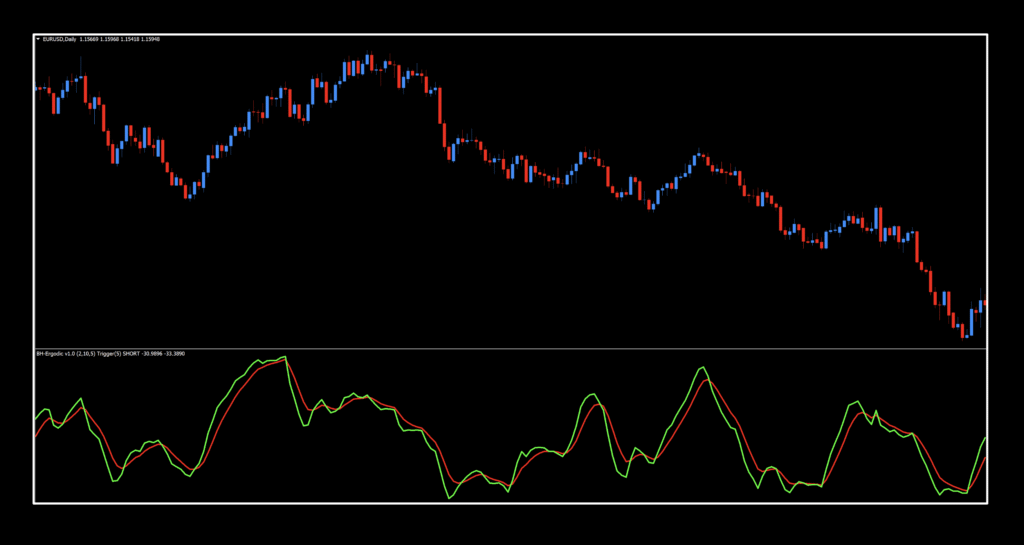
The first thing we noticed was that the lines are pretty close together on the default values. That’s totally fine because we rarely use the default values anyway. In some instances, you’d have to use the data tool to see which line is on top of the other, but let’s just carry on for a moment.
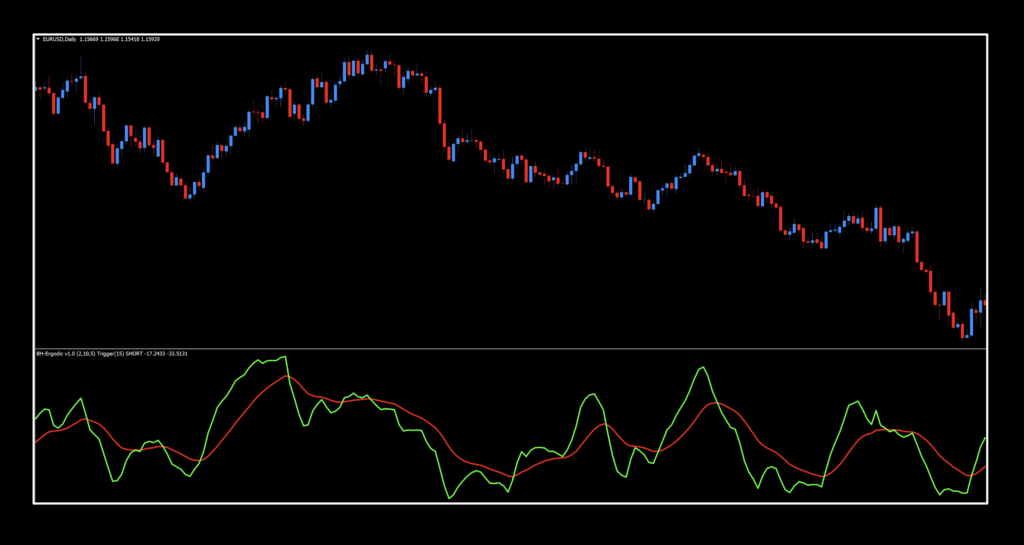
Random Change
Below, we made some random changes to the indicator based on literally nothing. We just wanted to show a clearer view of the two lines cross.
Settings
This indicator only has a variety of settings, and you have the latitude to use them all, or not. That choice is up to you; however, when we tested it, we used all of them – which took a little while.
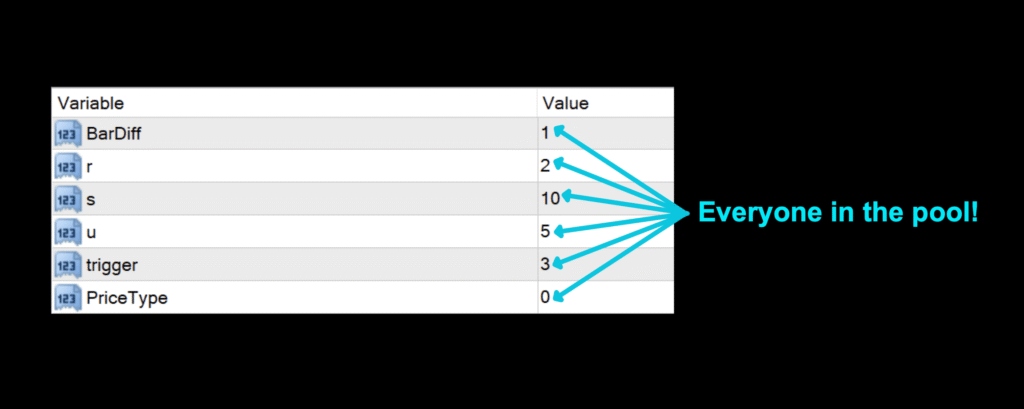
BarDiff: Adjusts the scale of the indicator. The default value is 1.
r: Determines the lookback period for the shorter moving average in the TSI calculation. The default value is 1.
s: Determines the lookback period for the longer moving average in the TSI calculation. The default value is 10.
u: Sets the period for the moving average that smooths the main Ergodic line to create the signal line. The default value is 5.
Trigger: Sets the period for the moving average that smooths the main Ergodic line to create the signal line. The default value is 3.
Price: The indicator uses specific price data sets where 0-close, 1-open, 2-high, 3-low, 4-median, 5-typical, 6-weighted. The default value is “0”, or Close.
Daily Maintenance
Remember, once you’re ready to perform daily maintenance on your trades during the last 20–30 minutes of the trading day (1700 New York time), you’ll be presented with one of four options.
- Opening a trade.
- Closing a trade
- Maintaining a trade; i.e.
- Moving a stop loss level.
- Exiting a trade.
- Taking a pass (nothing to do).
Long: When the Ergodic Line (green) crosses above the Signal Line (red).
Short: When the Signal Line (red) crosses above the Ergodic Line (green).
Whatchoo Got?
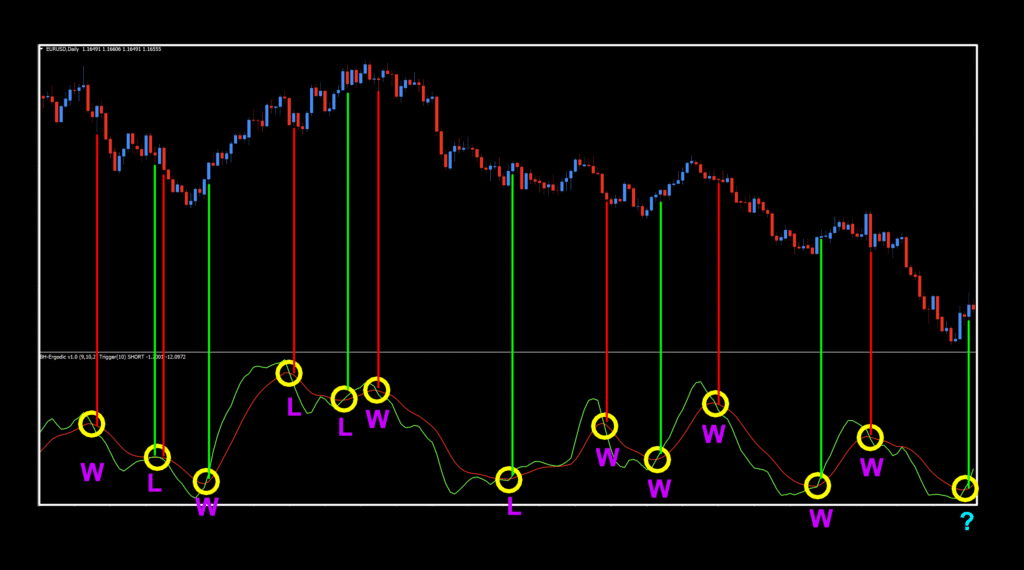
Not too bad. There were a few losers, but that’s normal, especially in a sideways market. That’s when the rest of your algorithm contributes to keep you out of harms way.
Testing Follies
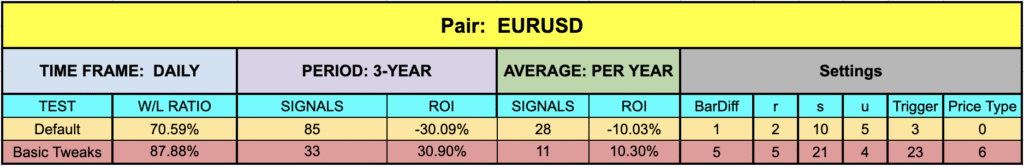
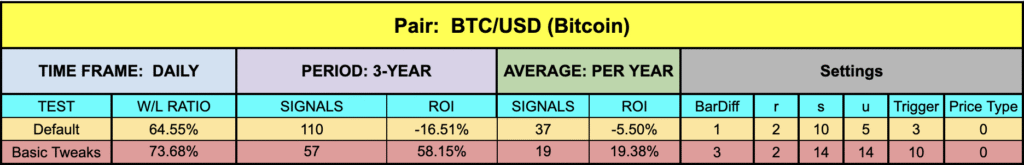

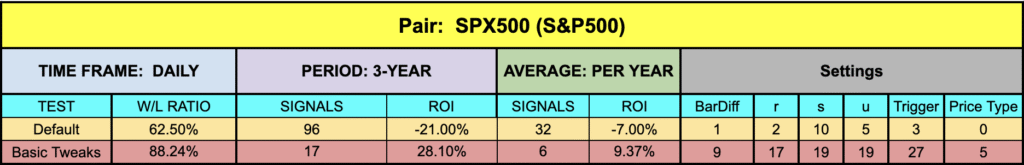
There were some really nice results across the board. Better in some instances than we’ve seen in a while. Maybe this is the missing piece to your algorithm? Who knows…but, spend a little time with it and see what it can do for you.
Resources
This is available in the Stonehill Forex library for free and will have “NEW” in red to alert you to its location. Get it HERE. Be sure you’re subscribed to the Stonehill Forex YouTube channel to watch the technical analysis portion of this week’s installment. Get your trading to the next level by signing up for the Advanced NNFX Course HERE.
Our only goal is to make you a better trader.
*Our published testing results are based on money management strategies employed by the NNFX system and depend on varying external factors, which may be different between individuals and their specific broker conditions. No guarantee, trading recommendations, or other market suggestions are implied. Your results and subsequent trading activities are solely your own responsibility.
BTW — Any information communicated by Stonehill Forex Limited is solely for educational purposes. The information contained within the courses and on the website neither constitutes investment advice nor a general recommendation on investments. It is not intended to be and should not be interpreted as investment advice or a general recommendation on investment. Any person who places trades, orders or makes other types of trades and investments etc. is responsible for their own investment decisions and does so at their own risk. It is recommended that any person taking investment decisions consults with an independent financial advisor. Stonehill Forex Limited training courses and blogs are for educational purposes only, not a financial advisory service, and does not give financial advice or make general recommendations on investment.