Somewhere in History
We’re going to drop back into history just a bit, but it’s totally fine. Not everything has to be the latest cutting edge coding. In fact, we find that some new indicators have inherent issues such as sloppy coding, repainting, inaccurate signals, and so forth…and we should all exercise some caution. What we found this week is something that has been used as a foundation for a few things, so if copying is the sincerest form of flattery, this bears looking into. Shall we?
Ergodic
Weird word. Definitely not something that comes up in casual conversation. According to Merriam-Webster;
Adjective: (er·god·ic) /ərˈɡädik/
Of or relating to a process in which every sequence or sizable sample is equally representative of the whole (as in regard to a statistical parameter). Cool.
Who’s That Guy
Back in 1995, there was a guy named William Blau who discussed momentum, direction, and divergence in his book aptly named, “Momentum, Direction and Divergence”. That’s where the idea for “Ergodic Indicators” came to be. Mr. Blau was an electrical engineer prior to becoming a successful trader, and spends his time taking long walks on the beach and collecting vintage garden gnomes. Actually, we don’t know how he spends his time, but with regard to trading, he’s pretty hot stuff.
What’s in a Name
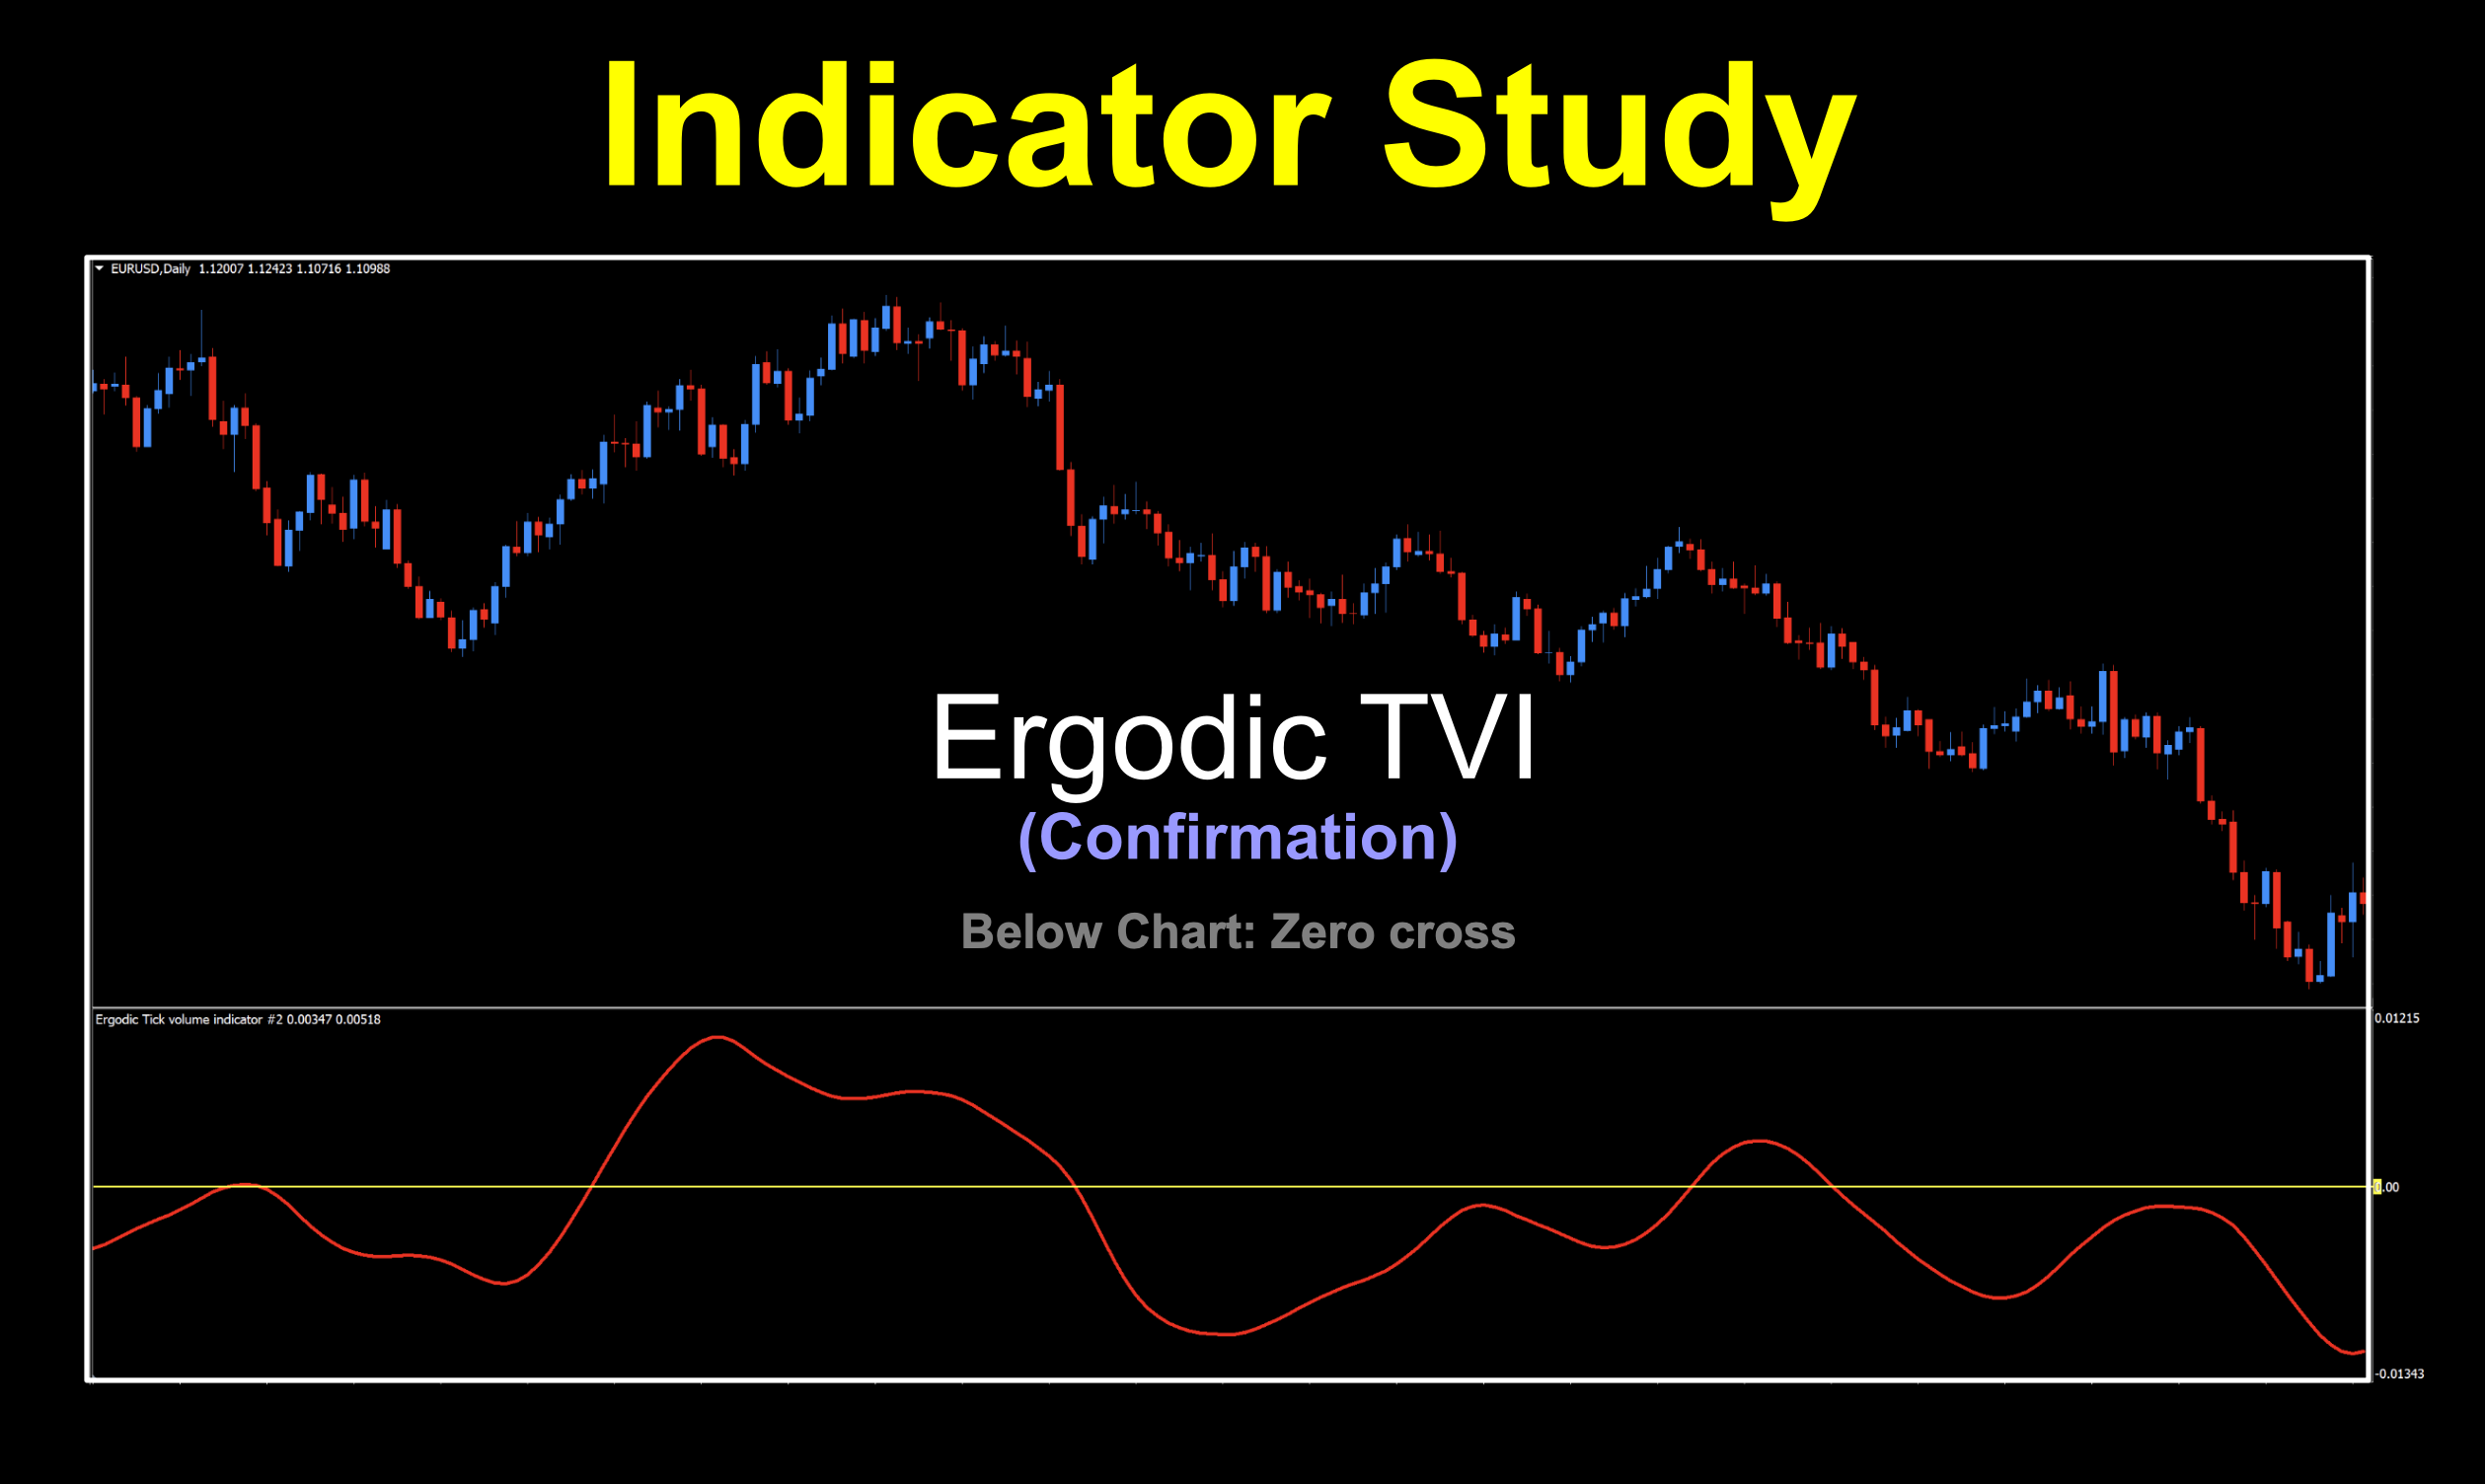
He came up with the notion of the Ergodic TVI (Tick Volume Indicator); however, it’s NOT a volume indicator in the classic sense. We’re using it as a confirmation indicator. The “Tick Volume” part helps identify who is in charge; the bulls or the bears (buyers/sellers).
Two Ways to the Finish
Looking at the indicator placed on the chart, it could be either a two lines cross or a zero cross. Or both…if you want to use one style for an entry and the other as an exit. One of the cool benefits we get to enjoy in our craft, for sure.
Count Thine Ways
This next part is for you mathematically inclined folks. If you don’t fall into that group, then move along. There are some minor variations in both appearance and calculations in different versions; however, we’re posting the math for this particular version, because we can.
ETVI = EMA(EMA(TVI)),
Signal = EMA(ETVI), where
TVI = EMA(TV), where
TV = 100*(EMA_Up2-EMA_Dn2)/sum,
EMA_Up2 = EMA(EMA(UpTicks)),
EMA_Dn2 = EMA(EMA(DnTicks)),
UpTicks = (Volume+(Close-Open)/pipSize)/2,
DnTicks = Volume-UpTicks,
pipSize – size of 1 pip.
Thrice

I don’t know why I put this in here…maybe it’s the whole thrice thing. After all, who actually uses this word?
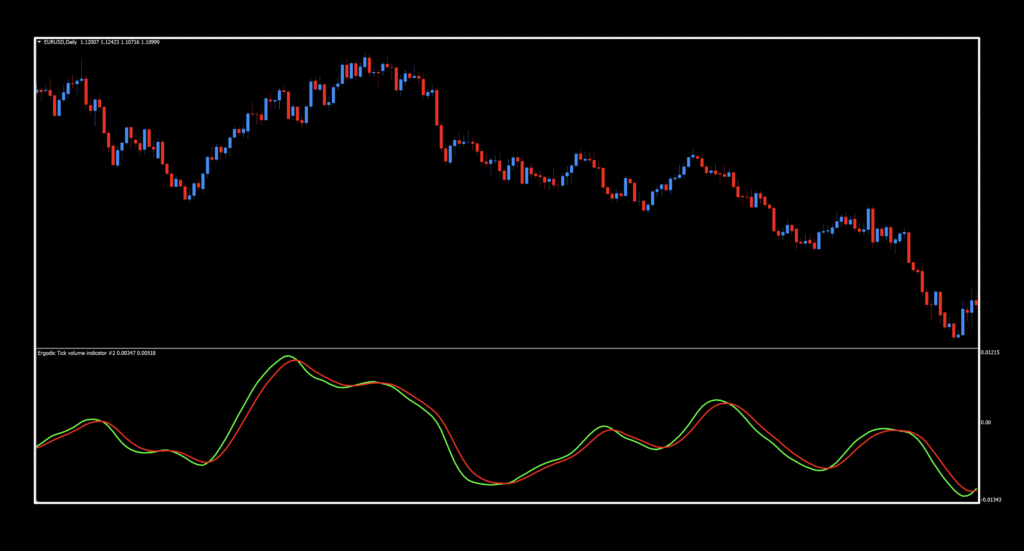
This indicator gives us the opportunity to test it three ways. Thrice! (LOL) While the original intent is a two lines cross, we also wanted to test each of the signal lines independently. We changed the default colors to more conventional ones (green/red from yellow/red), which may ease the burden on your brain. The intended version looks like this.
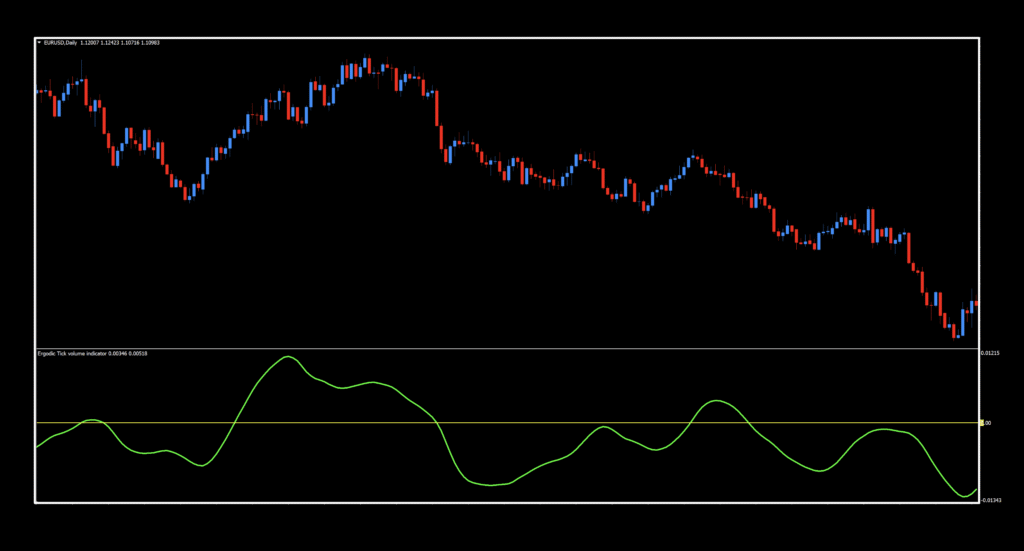
The second version is to just look at the ETVI signal line (green line) by itself as a zero cross.
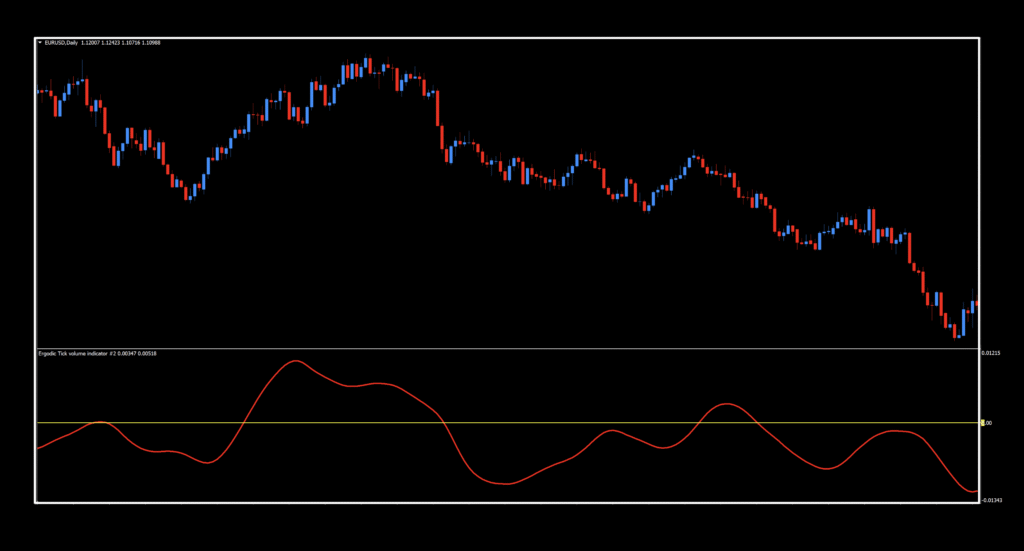
The last version is to look at the EMA (exponential moving average) of the ETVI signal line alone. It looks pretty close to the green line with respect to how it presents on the chart, but we’ll see if it provides us with different signals.
Settings
There are six (6) settings, so depending on how you’re using it, there will be times when you won’t need all of them.
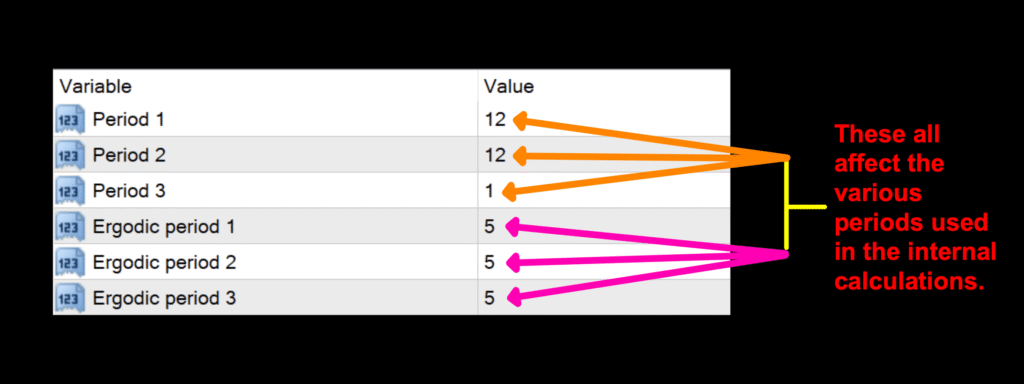
Period 1/2/3 & Ergotic period 1/2/3: Multiple period settings controlling the internal calculations. Default settings are posted in the screenshot.
Daily Maintenance
Remember, once you’re ready to perform daily maintenance on your trades during the last 20–30 minutes of the trading day (1700 New York time), you’ll be presented with one of four options.
- Opening a trade.
- Closing a trade
- Maintaining a trade; i.e.
- Moving a stop loss level.
- Exiting a trade.
- Taking a pass (nothing to do).
Whatcha Doing?
So the $64,000 question remains…which one is the best? Great question. We tend to think outside the box and test an indicator in different ways, if that’s possible. In this instance, we discovered after many, many hours of testing that using the EMA of the ETVI (red line) as a zero cross garnered the best results, so we’ll look at that chart and its results going forward.
Long: When the signal line crosses above the zero line.
Short: When the signal line crosses below the zero line.
Blue Ribbon Winner
Now that we have our prize heifer, let’s see what the where the signals popped up.
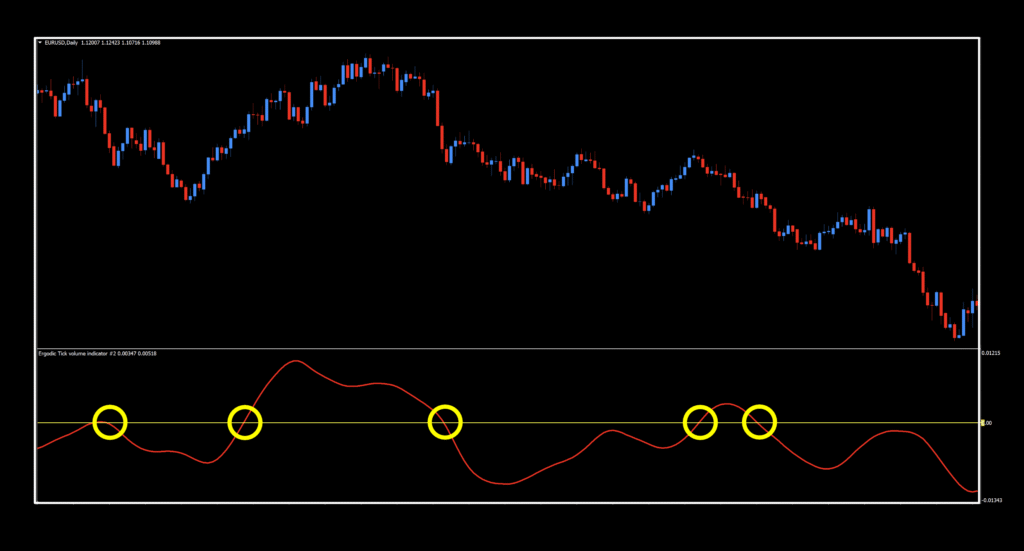
Alright, alright, alright…it does seem to make for a very smooth C1. A lot of the noise is filtered out and some nice trade signals. Granted, it’s a tad slow, but that’s just the default settings doing their thing. Naturally, we messed with it and came up with some better ones you’ll find below. Let’s go look at the results…
We’ve Got What You Need
We’ve stated that we were not going to print all the revised rules; however…if you want to familiarize yourself or refresh your memory, click HERE which takes you to the Cross Roads indicator study. We get into the nuts and bolts of how we came up with our testing protocol, which properly aligns with the NNFX methodology.
Below are the results from our exhaustive testing efforts.
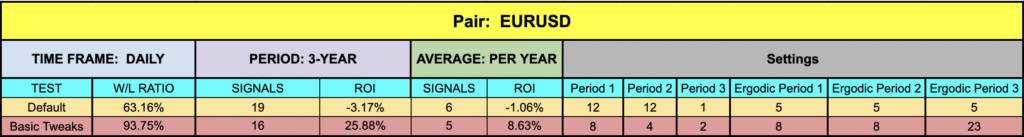
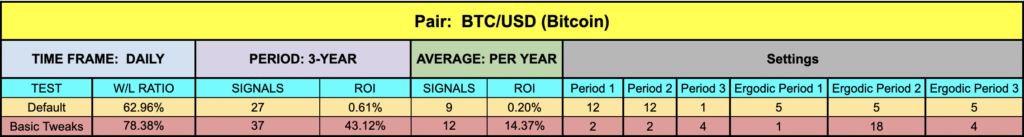

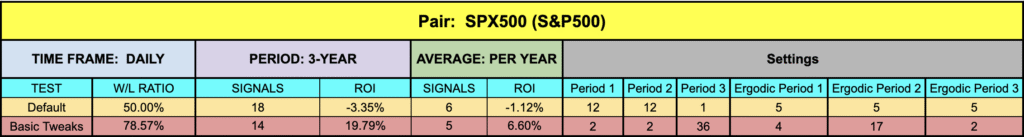
For Sure
After looking at this indicator through three different lenses, we settled on the last batch of testing. Figures, right? But, nice numbers all around. Gotta especially love that EUR/USD tweakiness with that stellar win/loss ratio and a decent ROI. Just as a little secret between us and y’all, the other two versions performed pretty well in their own right and should not be discounted, especially if you’re in the mood for playing with the settings. It’s enough to keep you up for a month of Sundays. Crack on!
Resources
Go get this from the library. It’ll have the word, “NEW” in red next to the name to help you find it. Get it, HERE. Also, be sure to subscribe to the Stonehill Forex YouTube channel for the technical analysis videos. Sign up for the Advanced NNFX Course HERE.
Our only goal is to make you a better trader.
*Our published testing results are based on money management strategies employed by the NNFX system and depend on varying external factors, which may be different between individuals and their specific broker conditions. No guarantee, trading recommendations, or other market suggestions are implied. Your results and subsequent trading activities are solely your own responsibility.
BTW — Any information communicated by Stonehill Forex Limited is solely for educational purposes. The information contained within the courses and on the website neither constitutes investment advice nor a general recommendation on investments. It is not intended to be and should not be interpreted as investment advice or a general recommendation on investment. Any person who places trades, orders or makes other types of trades and investments etc. is responsible for their own investment decisions and does so at their own risk. It is recommended that any person taking investment decisions consults with an independent financial advisor. Stonehill Forex Limited training courses and blogs are for educational purposes only, not a financial advisory service, and does not give financial advice or make general recommendations on investment.