Don’t Despair
Finding indicators can be a challenge. However, it’s one we all should be rising up to. After all, without indicators, determining trends would be quite difficult indeed. With each subsequent year, we’re “gifted” with more indicators; some great, some good, some mediocre, and some which should never have been published.
Not Without Discrepancy
Disparity among indicators sets them apart as useful and not so much. Part of our job is to filter through them to find those hidden gems. Sometimes we have to filter…a lot!
An Industry Giant
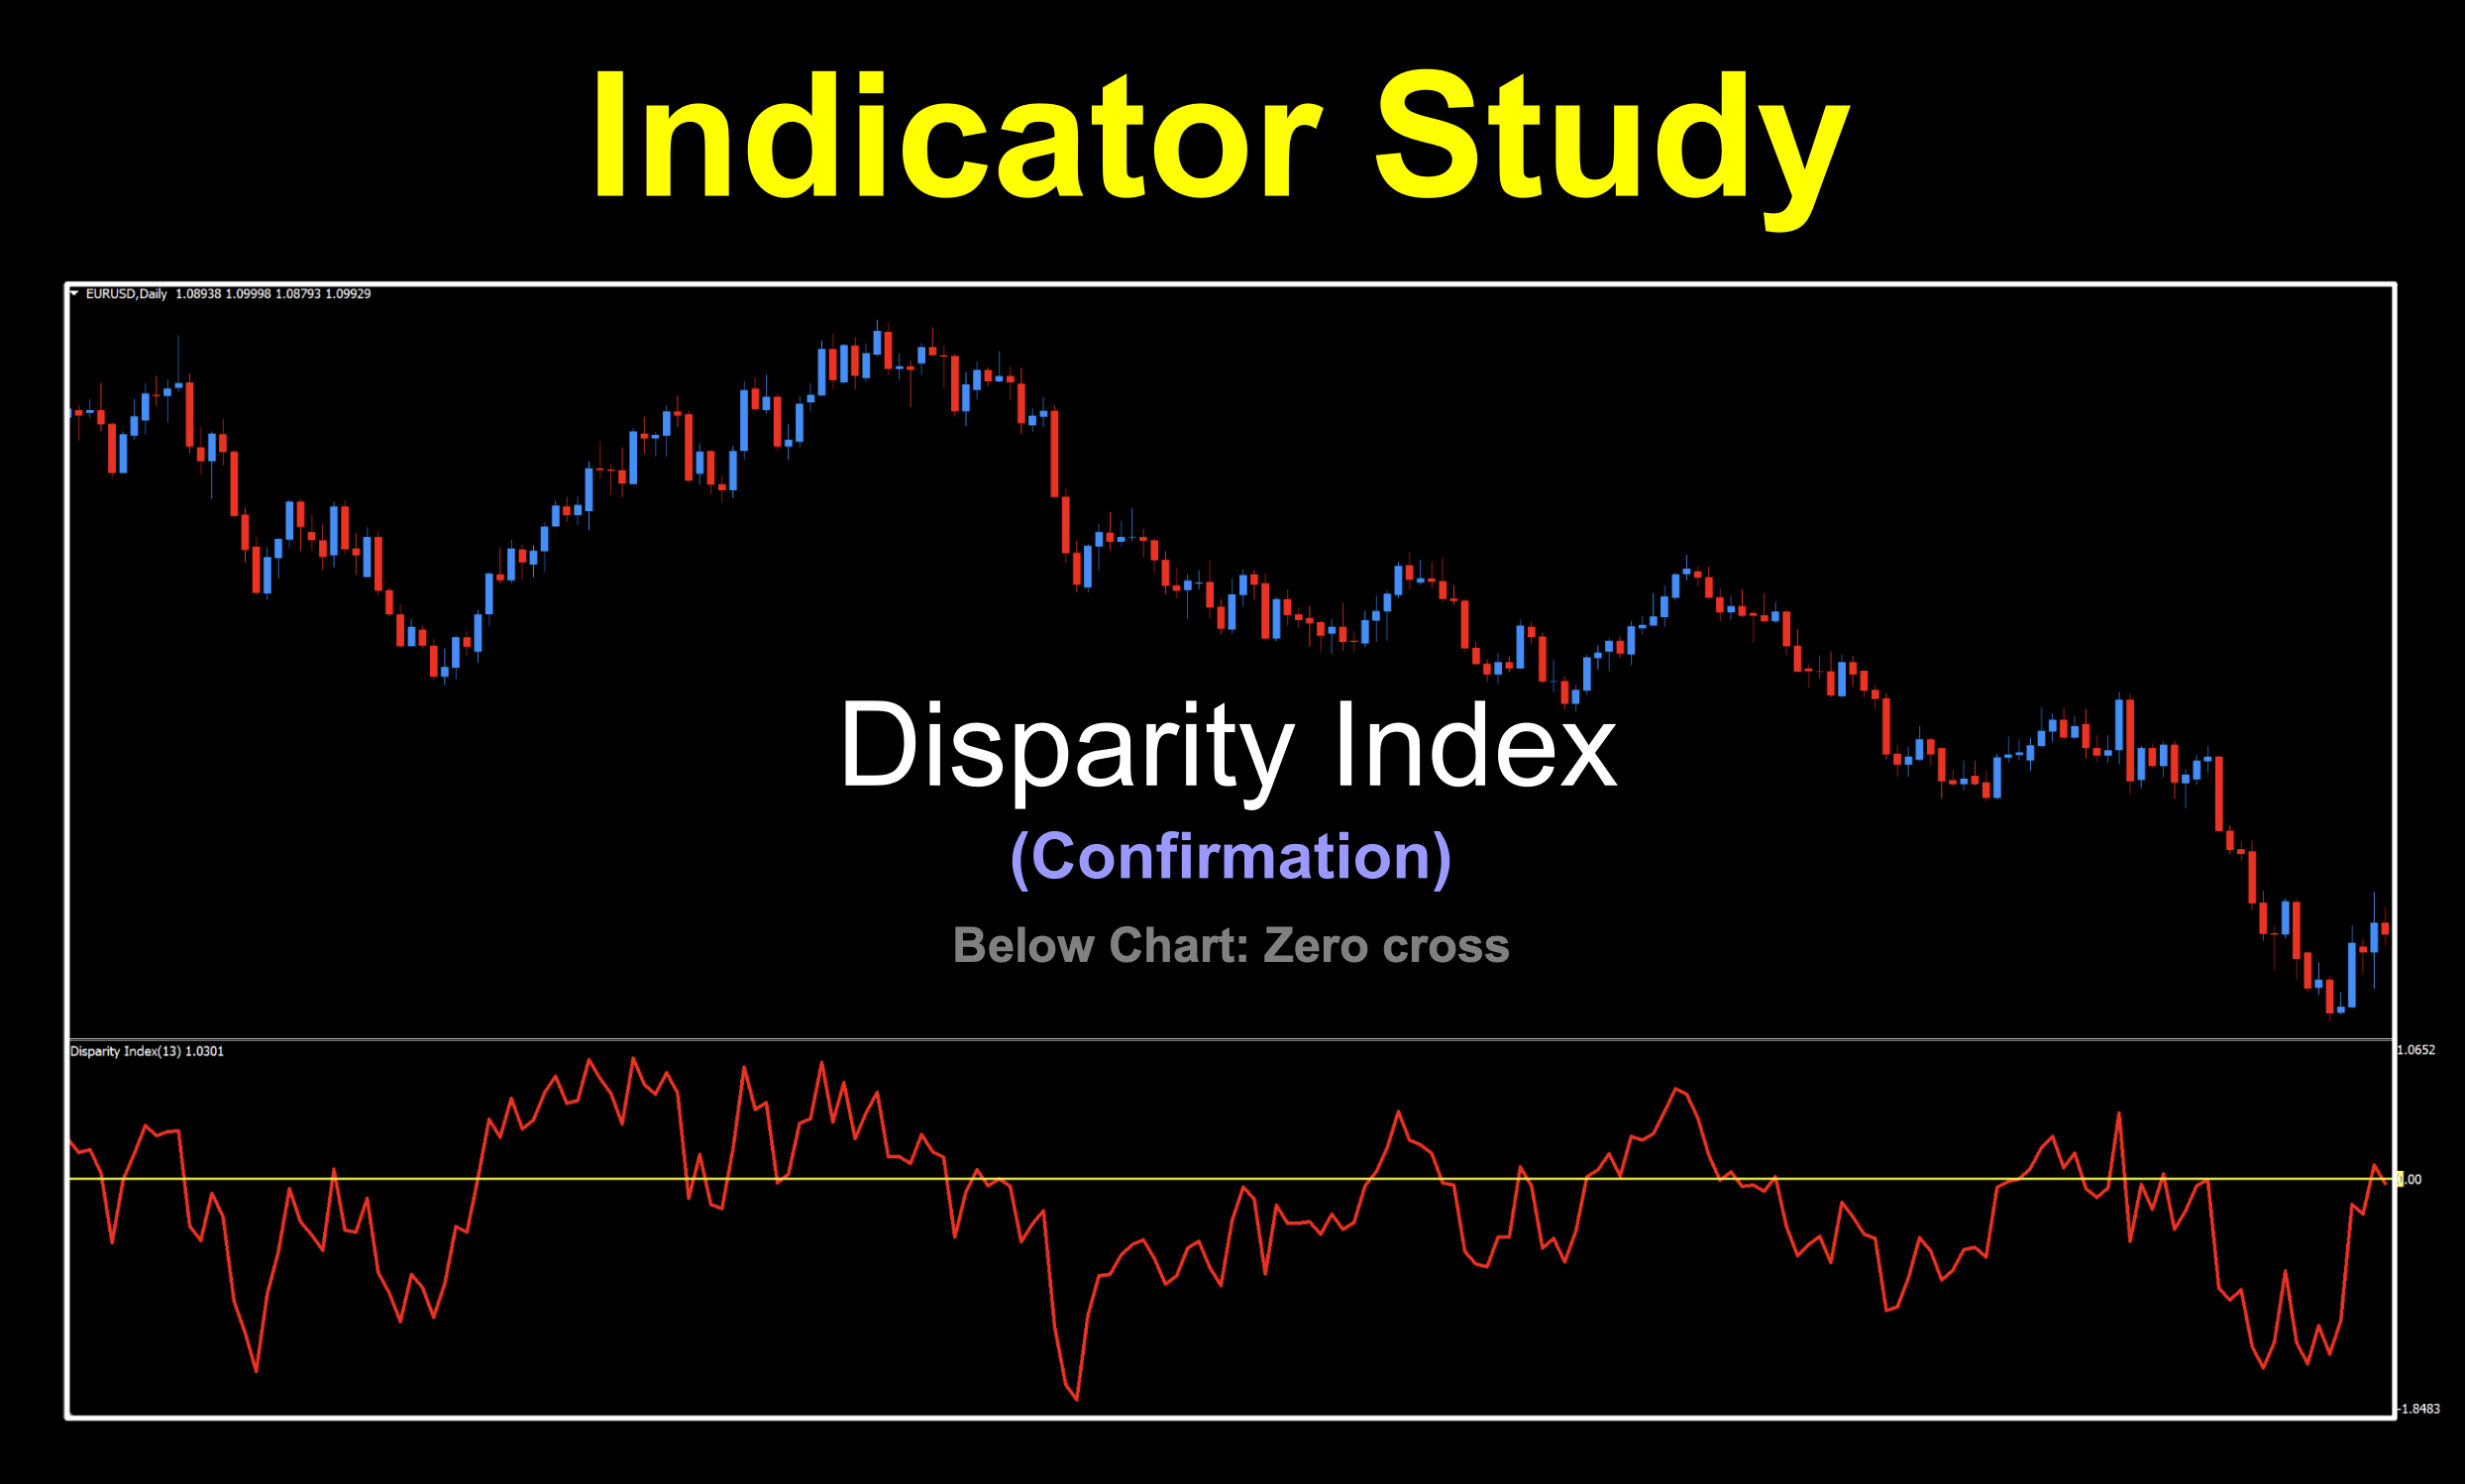
This installment we’ll be looking at something called the Disparity Index and is calculated as a relative difference between the recent close and its exponential moving average. Its origin comes from an industry giant named Steve Nison and is discussed in his book; “Beyond Candlesticks: New Japanese Charting Techniques Revealed” published in 1994. So while the concept comes a little behind our indicator time window, the indicator we’re using was coded in 2022. This not to say there are older versions, it’s just the version we’re using.
Candlesticks
We would be remiss if we didn’t mention a little something about Mr. Nison. If you weren’t aware, he’s the official word on candlesticks and their patterns, as he is responsible for bringing them to the Western world in 1991.
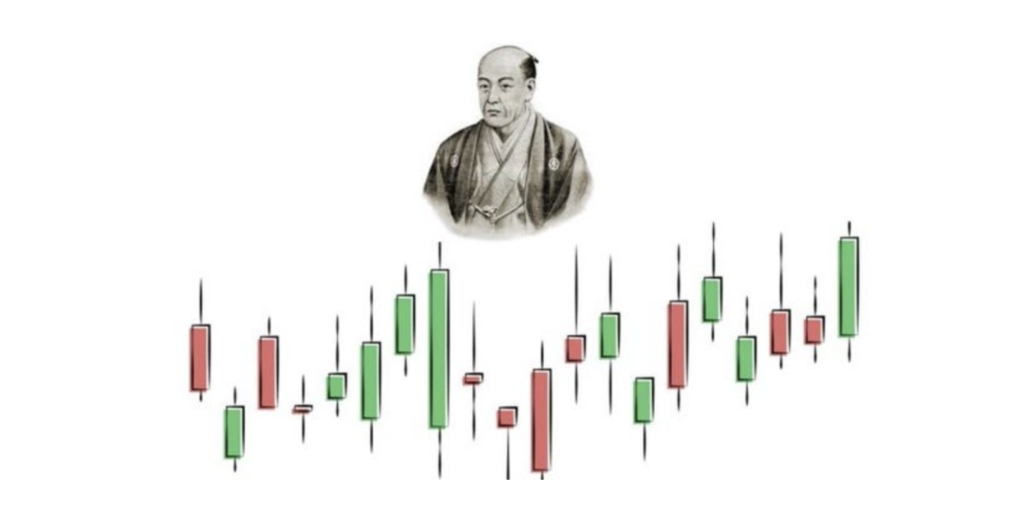
Candlesticks were originally developed by a Japanese rice trader during the 18th century named Munehisa Homma.
Follow That Line
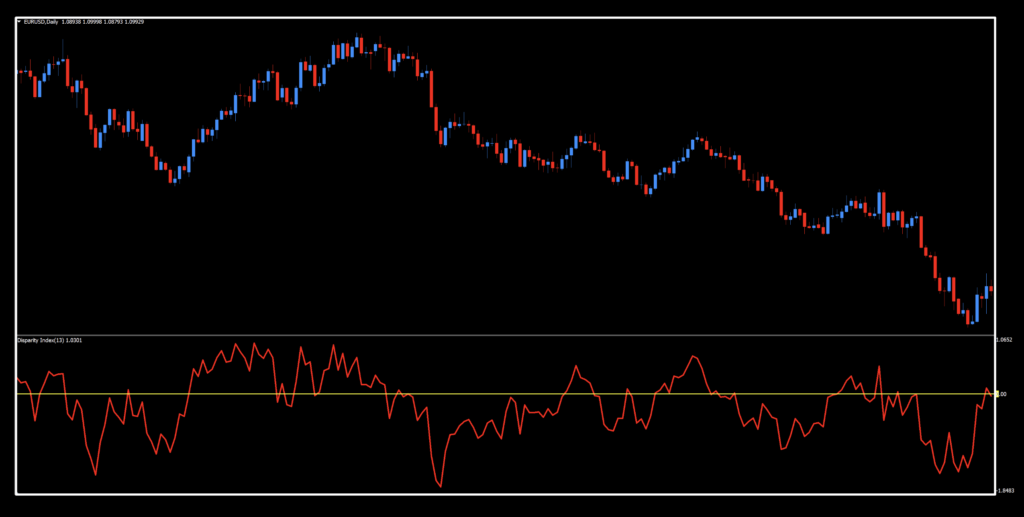
As a below chart, zero line cross, we’re showing you the default chart but changed the zero line to a bright yellow and thickened up the signal line to help you identify what’s what.
Settings
This tool only has one variable in the settings menu, so testing it should be a fairly painless task.
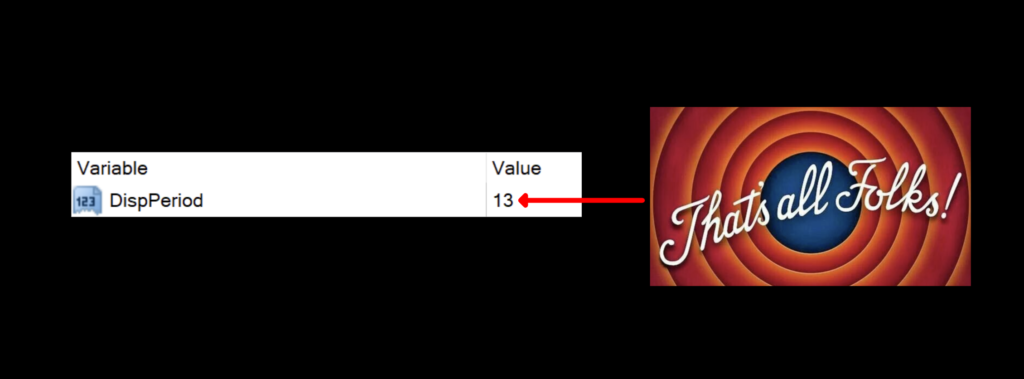
DispPeriod: The “Disparity Period” is the look back value that the formula uses to generate a signal line. The default value is lucky number 13.
Daily Maintenance
Remember, once you’re ready to perform daily maintenance on your trades during the last 20–30 minutes of the trading day (1700 New York time), you’ll be presented with one of four options.
- Opening a trade.
- Closing a trade
- Maintaining a trade; i.e.
- Moving a stop loss level.
- Exiting a trade.
- Taking a pass (nothing to do).
Long: When the signal line crosses above zero.
Short: When the signal line crosses below zero.
Let’s Get Cracking
The next thing we’re going to do is take a look at the signals.
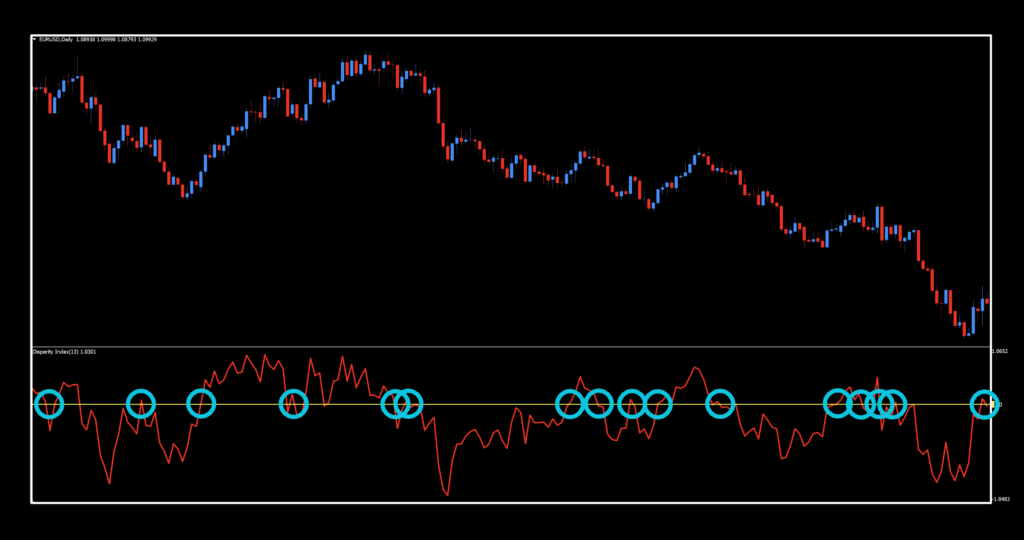
The first thing we noticed is that this is a quick acting confirmation (type 2) that can change direction based on price action fairly quickly. This can serve our needs by getting us in quickly but needs to be used with caution (and definitely not by itself) or you’ll find yourself entertaining a lot of losing trades. Hint…be sure you have a system surrounding this baby. Let’s get to testing!
Sharpen Your Pencil
As mentioned in the last indicator we posted, we stated that we were not going to print all the revised rules of testing published over the last couple of months. If you want to familiarize yourself or refresh your memory, click HERE, which takes you to the Cross Roads indicator study.
Below are the results from our testing efforts.
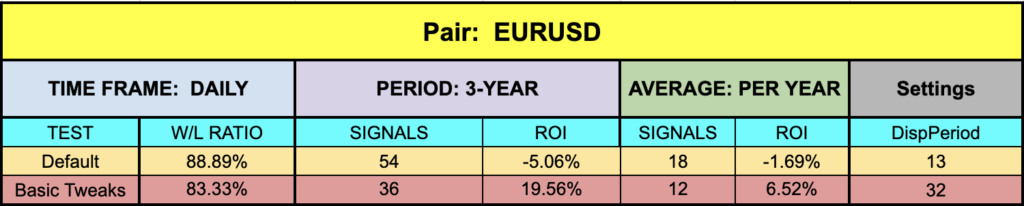
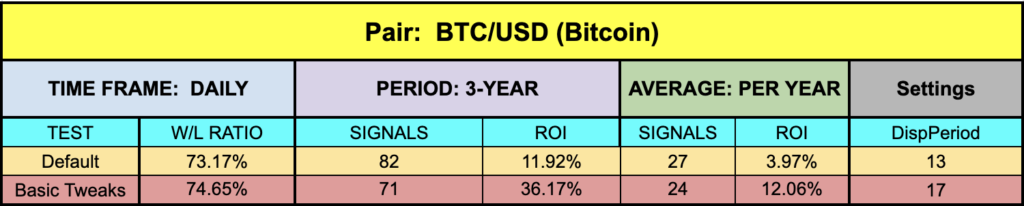
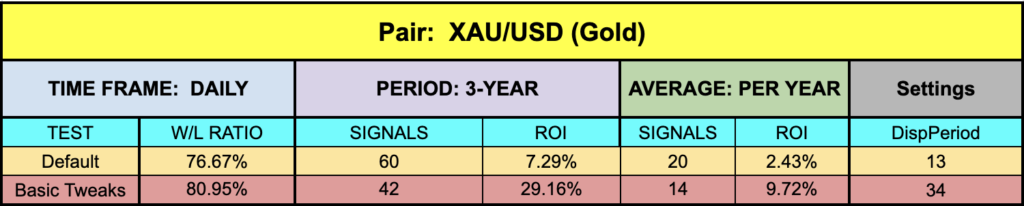
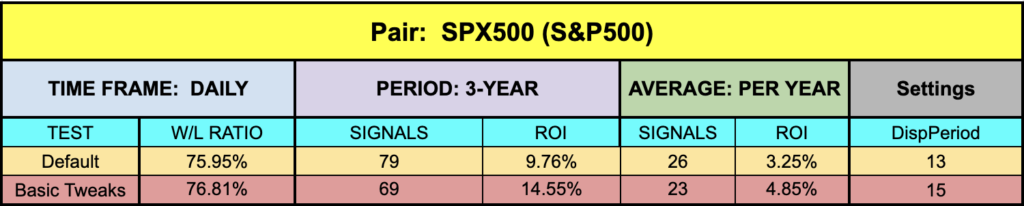
Doable
Not as awesome as last week’s indicator because it’s not one of ours, but still worth the investigation, as three of four started in positive ROI territory. Remember, this reacts quickly, so you may have opportunities to get into a trade earlier, especially if used in your system. Don’t discount it based on what we got here because you have at thirty-five other pairs to investigate and other markets, if you’re adventurous. Go forth and profit!
Resources
Get this Steve Nison special from the Stonehill Forex library at no charge. A “NEW” notation will be next to the name to help you find it. Get it, HERE. Also, be sure to subscribe to the Stonehill Forex YouTube channel for the technical analysis videos. Sign up for the Advanced NNFX Course HERE.
Our only goal is to make you a better trader.
*Our published testing results are based on money management strategies employed by the NNFX system and depend on varying external factors, which may be different between individuals and their specific broker conditions. No guarantee, trading recommendations, or other market suggestions are implied. Your results and subsequent trading activities are solely your own responsibility.
BTW — Any information communicated by Stonehill Forex Limited is solely for educational purposes. The information contained within the courses and on the website neither constitutes investment advice nor a general recommendation on investments. It is not intended to be and should not be interpreted as investment advice or a general recommendation on investment. Any person who places trades, orders or makes other types of trades and investments etc. is responsible for their own investment decisions and does so at their own risk. It is recommended that any person taking investment decisions consults with an independent financial advisor. Stonehill Forex Limited training courses and blogs are for educational purposes only, not a financial advisory service, and does not give financial advice or make general recommendations on investment.