
Hello Again
It’s been awhile since we’ve written a technical blog and reading through the remarks on the survey, we noticed there were a few requests. That being the case, we decided on tackling a simple, yet powerful variable used in most indicators that some of you may not fully understand.
Practice Makes Perfect
As you practice and improve the craft of your trading, you will no doubt spend a lot of time with indicators. They are the necessary tools which you undoubtably expend effort as you develop your very own algorithm.
The Price is Right
In many indicators, there is a setting which goes by such names as;
Price
Applied price
Price to use
Applied to
Mode
or some other similar name. What exactly does that mean, and what is it referring to?
Care for a Menu?
Below is an example of an indicator menu where the ability to specify which price data you want to use in the indicator’s calculation.
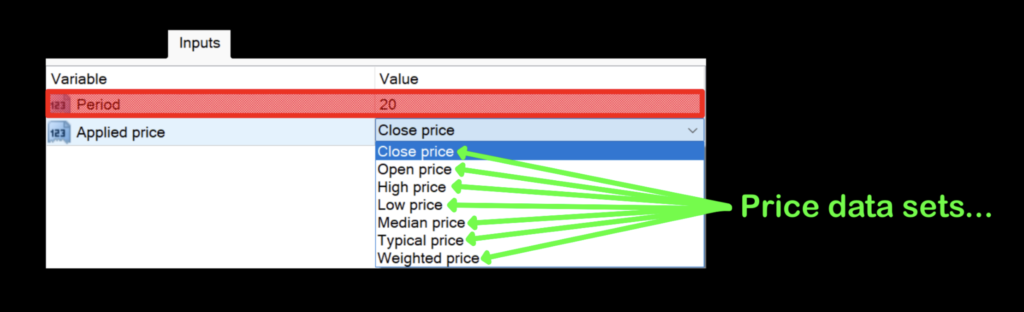
What’s the Dif?
When you want to add a moving average, or any other indicator that calls to the period’s price data, you can describe a very specific data set. More often than not, the default value is 0, or “Closed price”. What does that actually mean?
Construct of a Candle
Let’s harken back to charts 101 and take a quick look at the parts of a candle in the image below, before we dive into what the data sets are about.
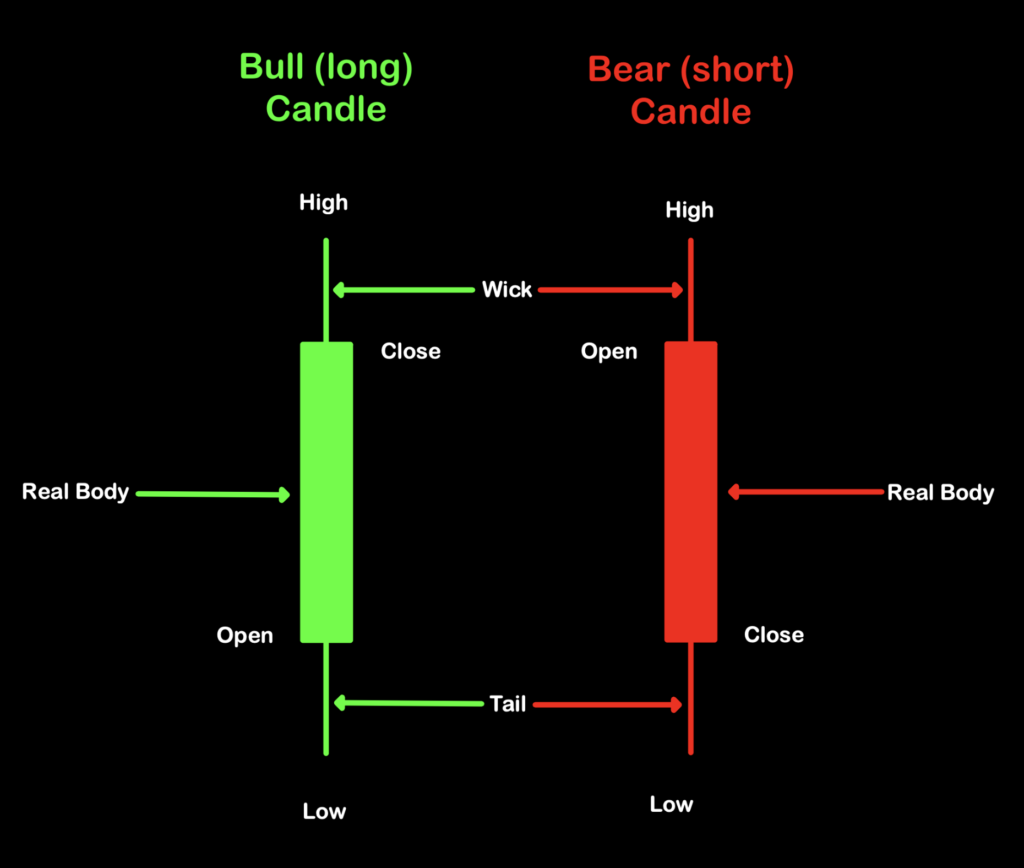
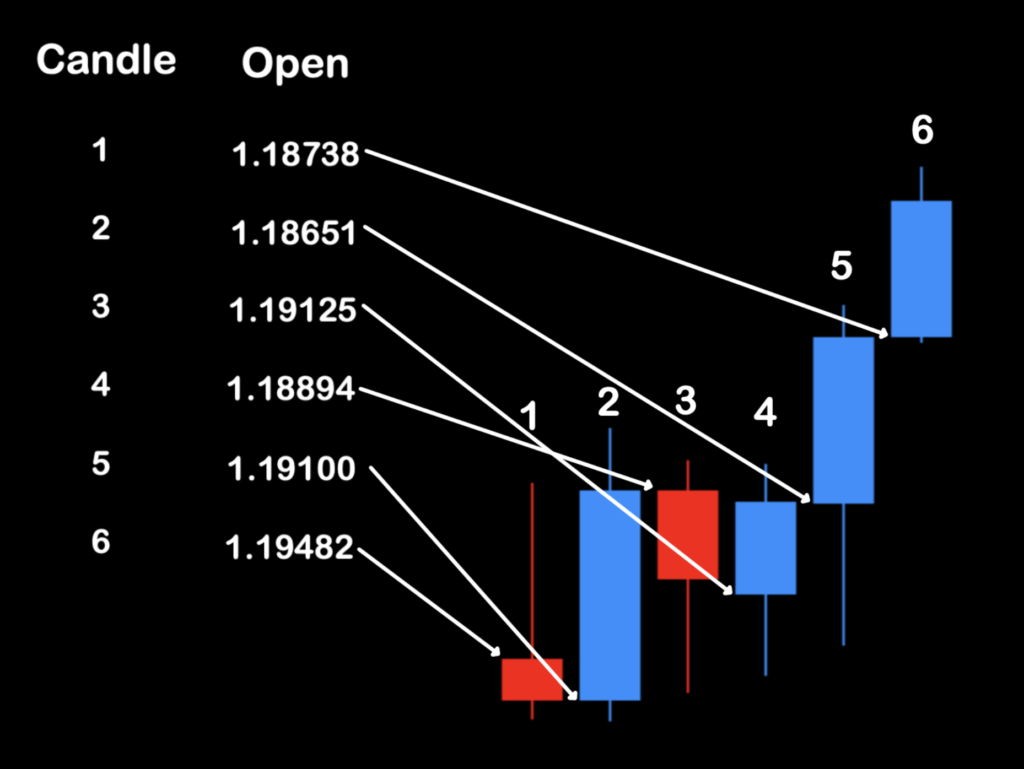
Now that we’ve all got the parts of a candle identified, let’s take a sampling of candles with its corresponding data.
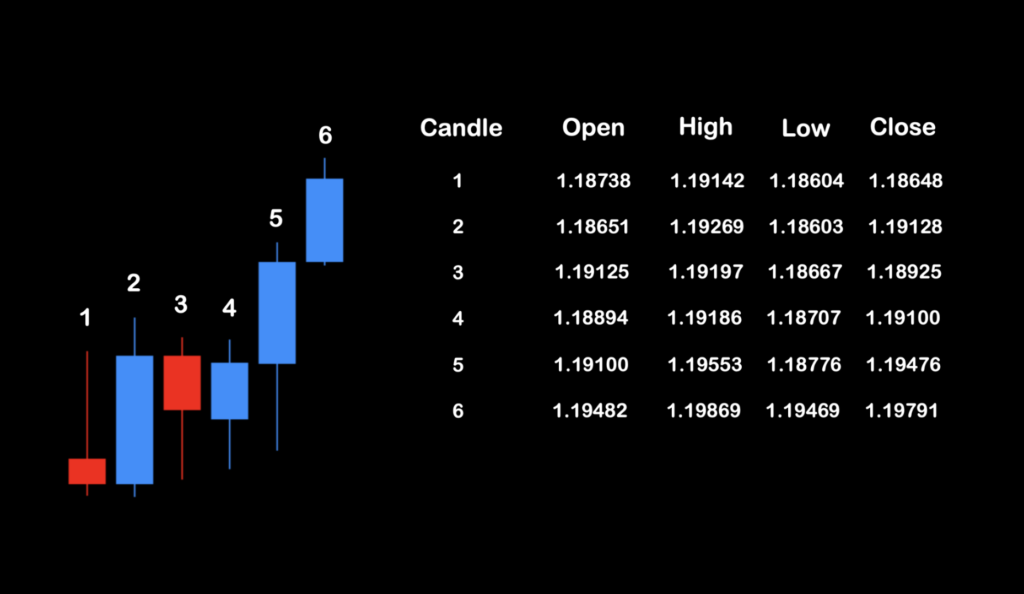
Now, we’ll take a quick at the different data sets.
Closed Price: Data from a period where the value of the last tick at the close is noted.
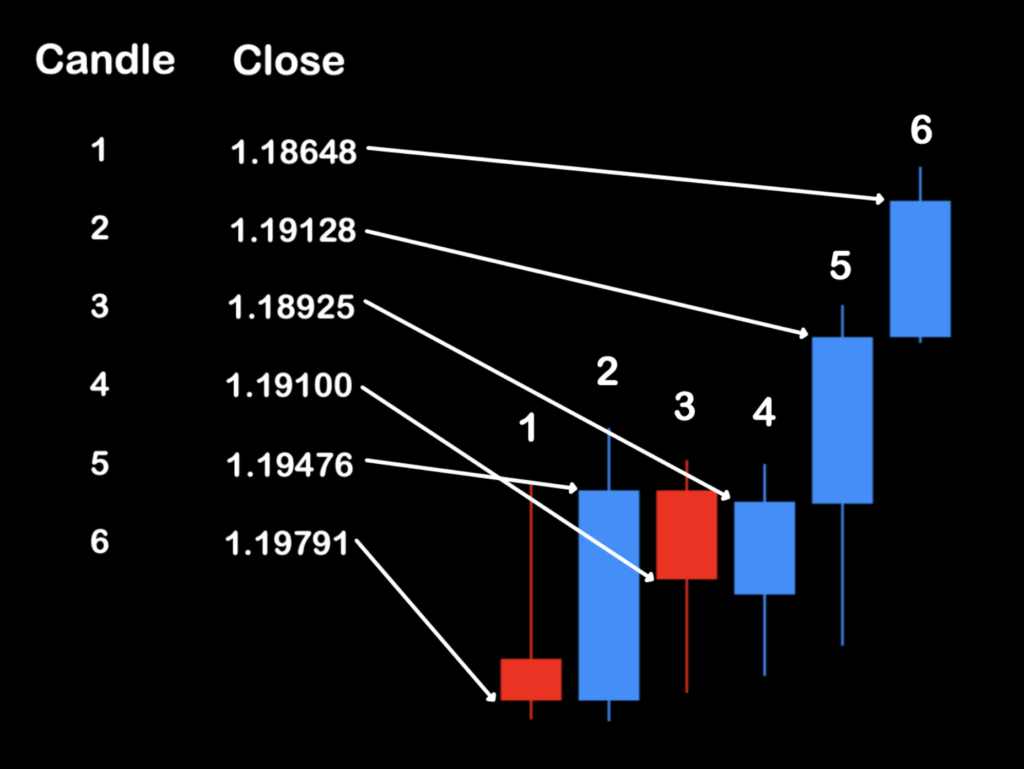
Open Price: Data from a period where the value of the first tick at the open is noted.
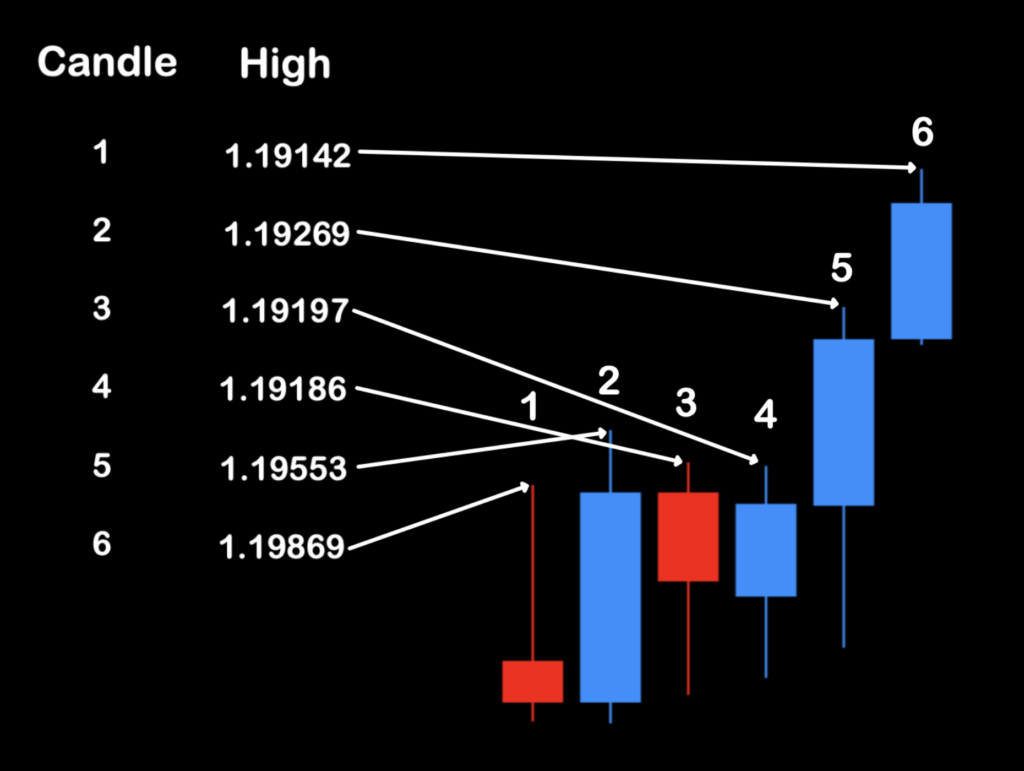
High Price: Data from a period where the highest value is noted.
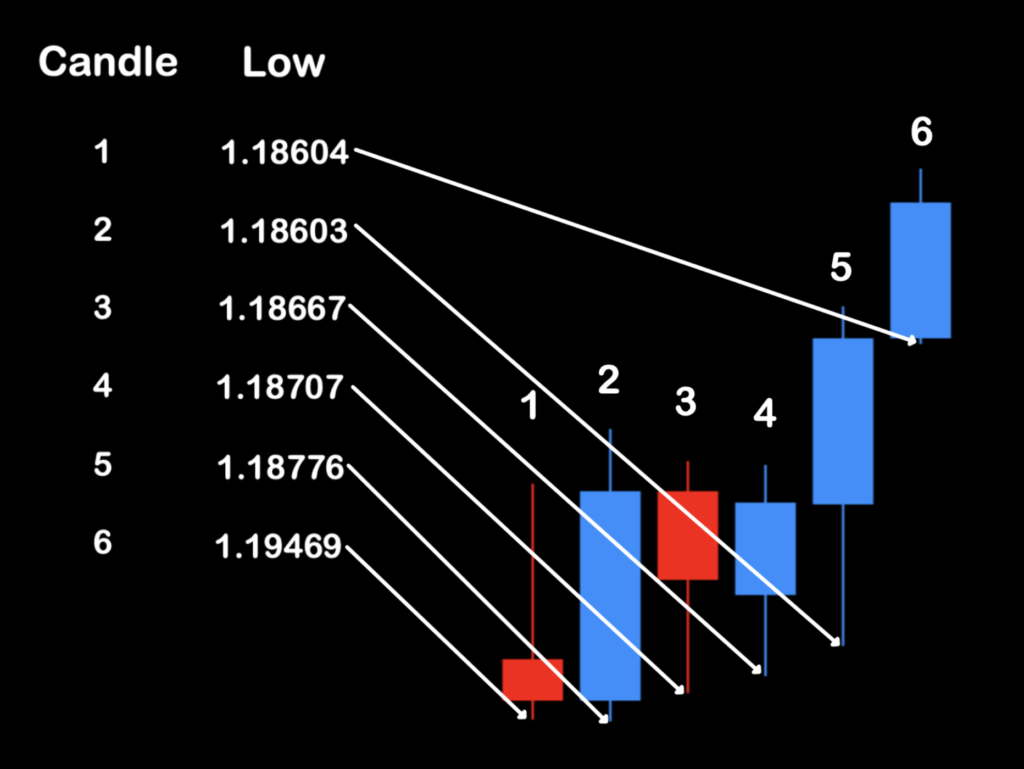
Low Price: Data from a period where the lowest value of is noted.
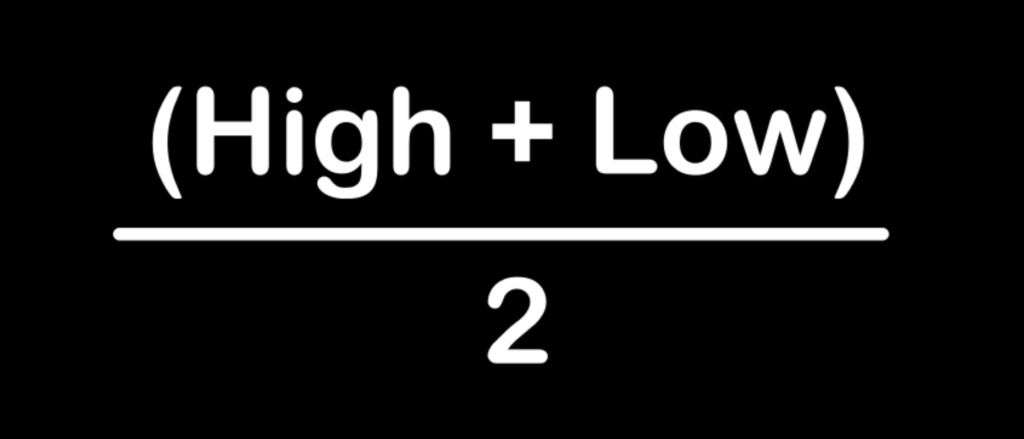
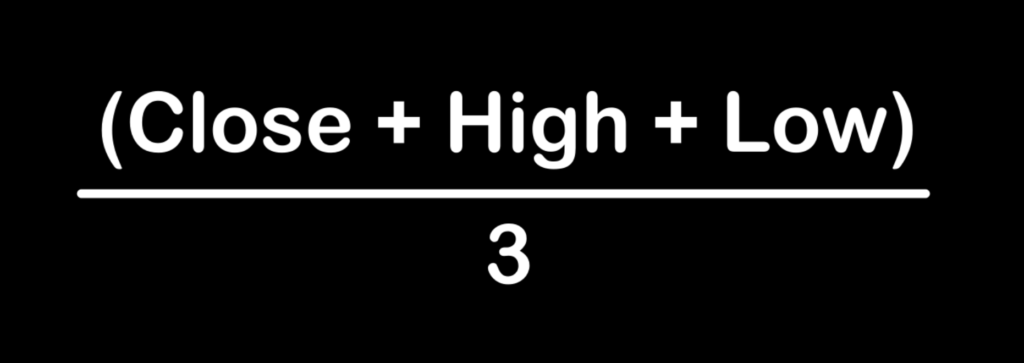
Median Price: This is where things get a little interesting. The median price of a period is calculated by adding the high and low, then dividing by two, and is sort of the “middle ground” between them.
Typical Price: By calculating “typical price”, equal weight is given to the close, high, and low prices of a specific period and the open price is omitted. The reason is that the close of the previous period is usually very close (if not the same) as the open of the following period, and looks like this.
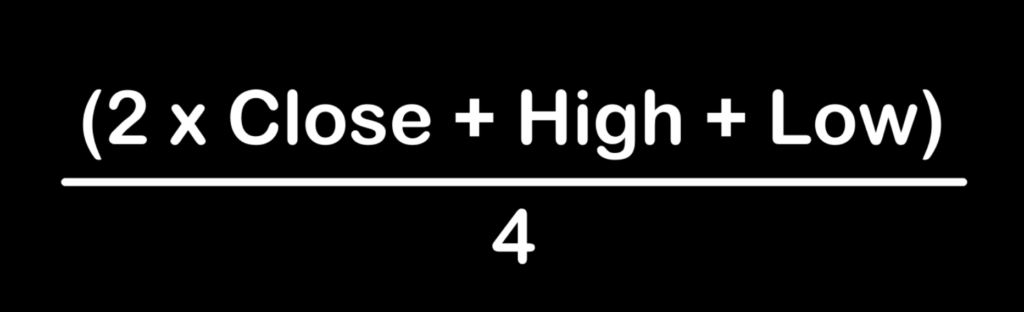
Weighted Price: As the descriptor says, this price set assigns additional weight to the close.
Plotting the Numbers
If you were to compare the different data sets graphically by plotting them on a chart using an indicator which has all seven, it might look something like this.
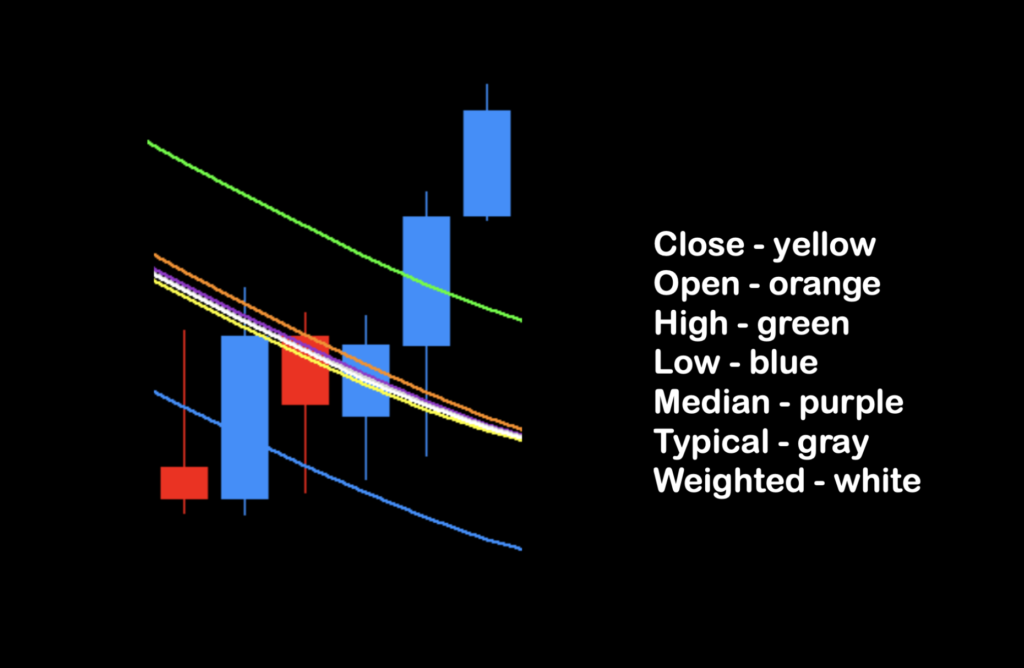
From this we can now see how the high (green) and low (blue) are definitive outliers and the other five data sets are fairly close together.
Is That All?
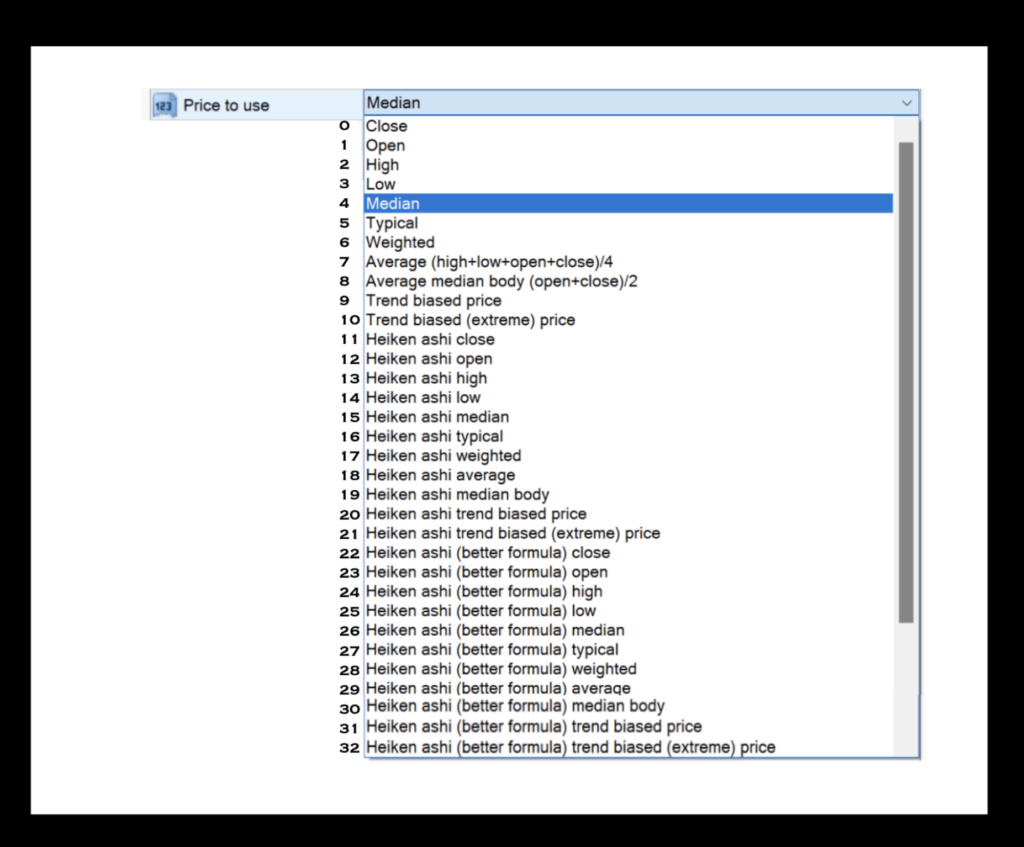
Some of you may wonder if those seven price sets are the only ones which are available. The answer is a resounding no. We just profiled an indicator not too long ago where there were 32 different data sets as noted in the screenshot below.
What’s the Point
Now that we’ve illustrated the what and how, let’s quickly address the why. “Why” do indicators have the ability to use all of these different data sets. Some reversal traders tend to use the “high price” set as an attempt to determine reversal points. Some use the “low price” set to help determine exit points. Others use everything else to find the best curve that fits the market.
Optimization Operations
When testing (and optimizing) indicators, you can change the variables, including the price data, to help you determine a better setting and that’s completely fine. The old school diehards that may still be around insist on the “closed price” data set, but that really is only a thing for trading the weekly charts — something we don’t do…
Conclusion
Now that you know what the price data sets are, where they’re found, how to use them, and why they exist, you have no reason not to go bonkers with your favorite indicators.
Resources
Speaking of indicators, you know, we’ve got a bunch of them for free where you can download and experiment to your heart’s content. They’re in the Stonehill Forex Library, right here on this site.
Helping You
Don’t forget to sign up for the email broadcasts by emailing us at dan@stonehillforex.com and requesting to be added to the list. We’d love to have you on our team. The Stonehill Forex Advanced Course is there for you when you’re ready to extend your knowledge and shorten your learning curve to trade profitably quicker and with a lot less hassle.
Our only goal is to make you a better trader.
BTW — Any information communicated by Stonehill Forex Limited is solely for educational purposes. The information contained within the courses and on the website neither constitutes investment advice nor a general recommendation on investments. It is not intended to be and should not be interpreted as investment advice or a general recommendation on investment. Any person who places trades, orders or makes other types of trades and investments etc. is responsible for their own investment decisions and does so at their own risk. It is recommended that any person taking investment decisions consults with an independent financial advisor. Stonehill Forex Limited training courses and blogs are for educational purposes only, not a financial advisory service, and does not give financial advice or make general recommendations on investment.