Modernization
Modernizing anything is generally accepted as making older…well, better. Most things around us such as communications, transportation, and industry largely share that notion, although there are a few things which haven’t moved well through time. We’re going to see if the old Directional Movement Index (DMI) passes muster as something more contemporary.

Primus

Not to be confused with the Alternative Funk Metal Band from California, primus is Latin for “first”, which is apropos when discussing the original Directional Movement Index (DMI) developed by J. Welles Wilder in 1978. Not that the two could ever be confused.
Insert Video Here
Back to Basics
Where the DMH is similar to the DMI, it detects uptrend price movement when the sum of consecutive differences between adjacent high prices is greater than the same between adjacent lows. The opposite generates short signals. The primary difference between the two indicators is the following:
- The original DMI uses average true range (ATR) as a scaling factor for both sums in the calculation of the resulting ratio.
- DMH uses the Hann windowing function as a scaling mechanism and forgoes both ATR and ratio calculation.
Hann Who?
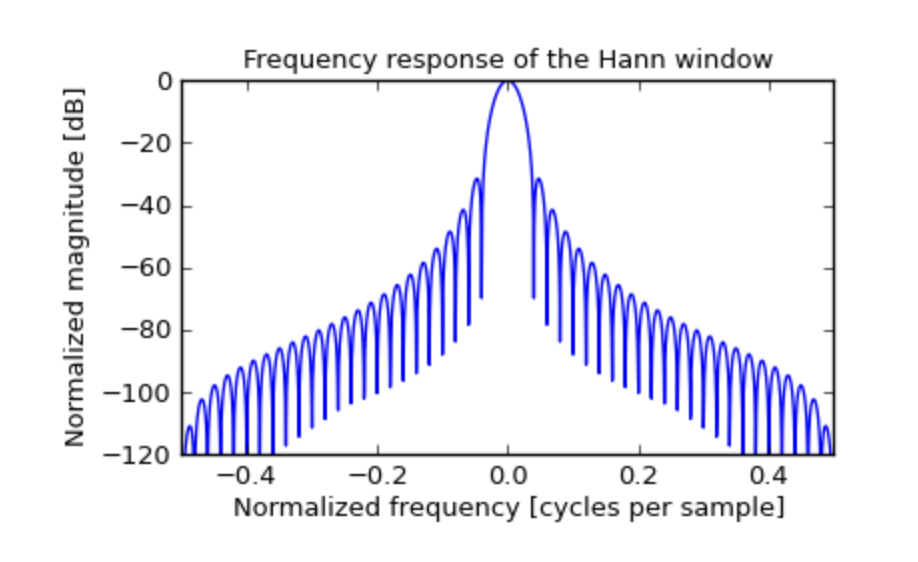
A Hann filter, also known as a Hann window, is a function used in signal processing to smooth data resulting in a bell-shaped, cosine-based curve. It is found in filtering image noise and smoothing time-series data and in other technical applications.
Hann Why?
Using Hann windowing instead of ATR scaling reduces the lag introduced by the moving average. Hann windowing gives most of the weight to the values around the middle of the function’s period, and least of the weight to the values at the beginning and the end of it.
Mags & Rags
By the way, The entire concept of the modernization was the brain child of none other than John Ehlers, who had his article “The DMH: An Improved Directional Movement Indicator” published in the December 2021 issue of the Technical Analysis of Stocks and Commodities. Coincidently, the indicator we’re using was coded in the same year as well. Double cool.
Brass Tacks
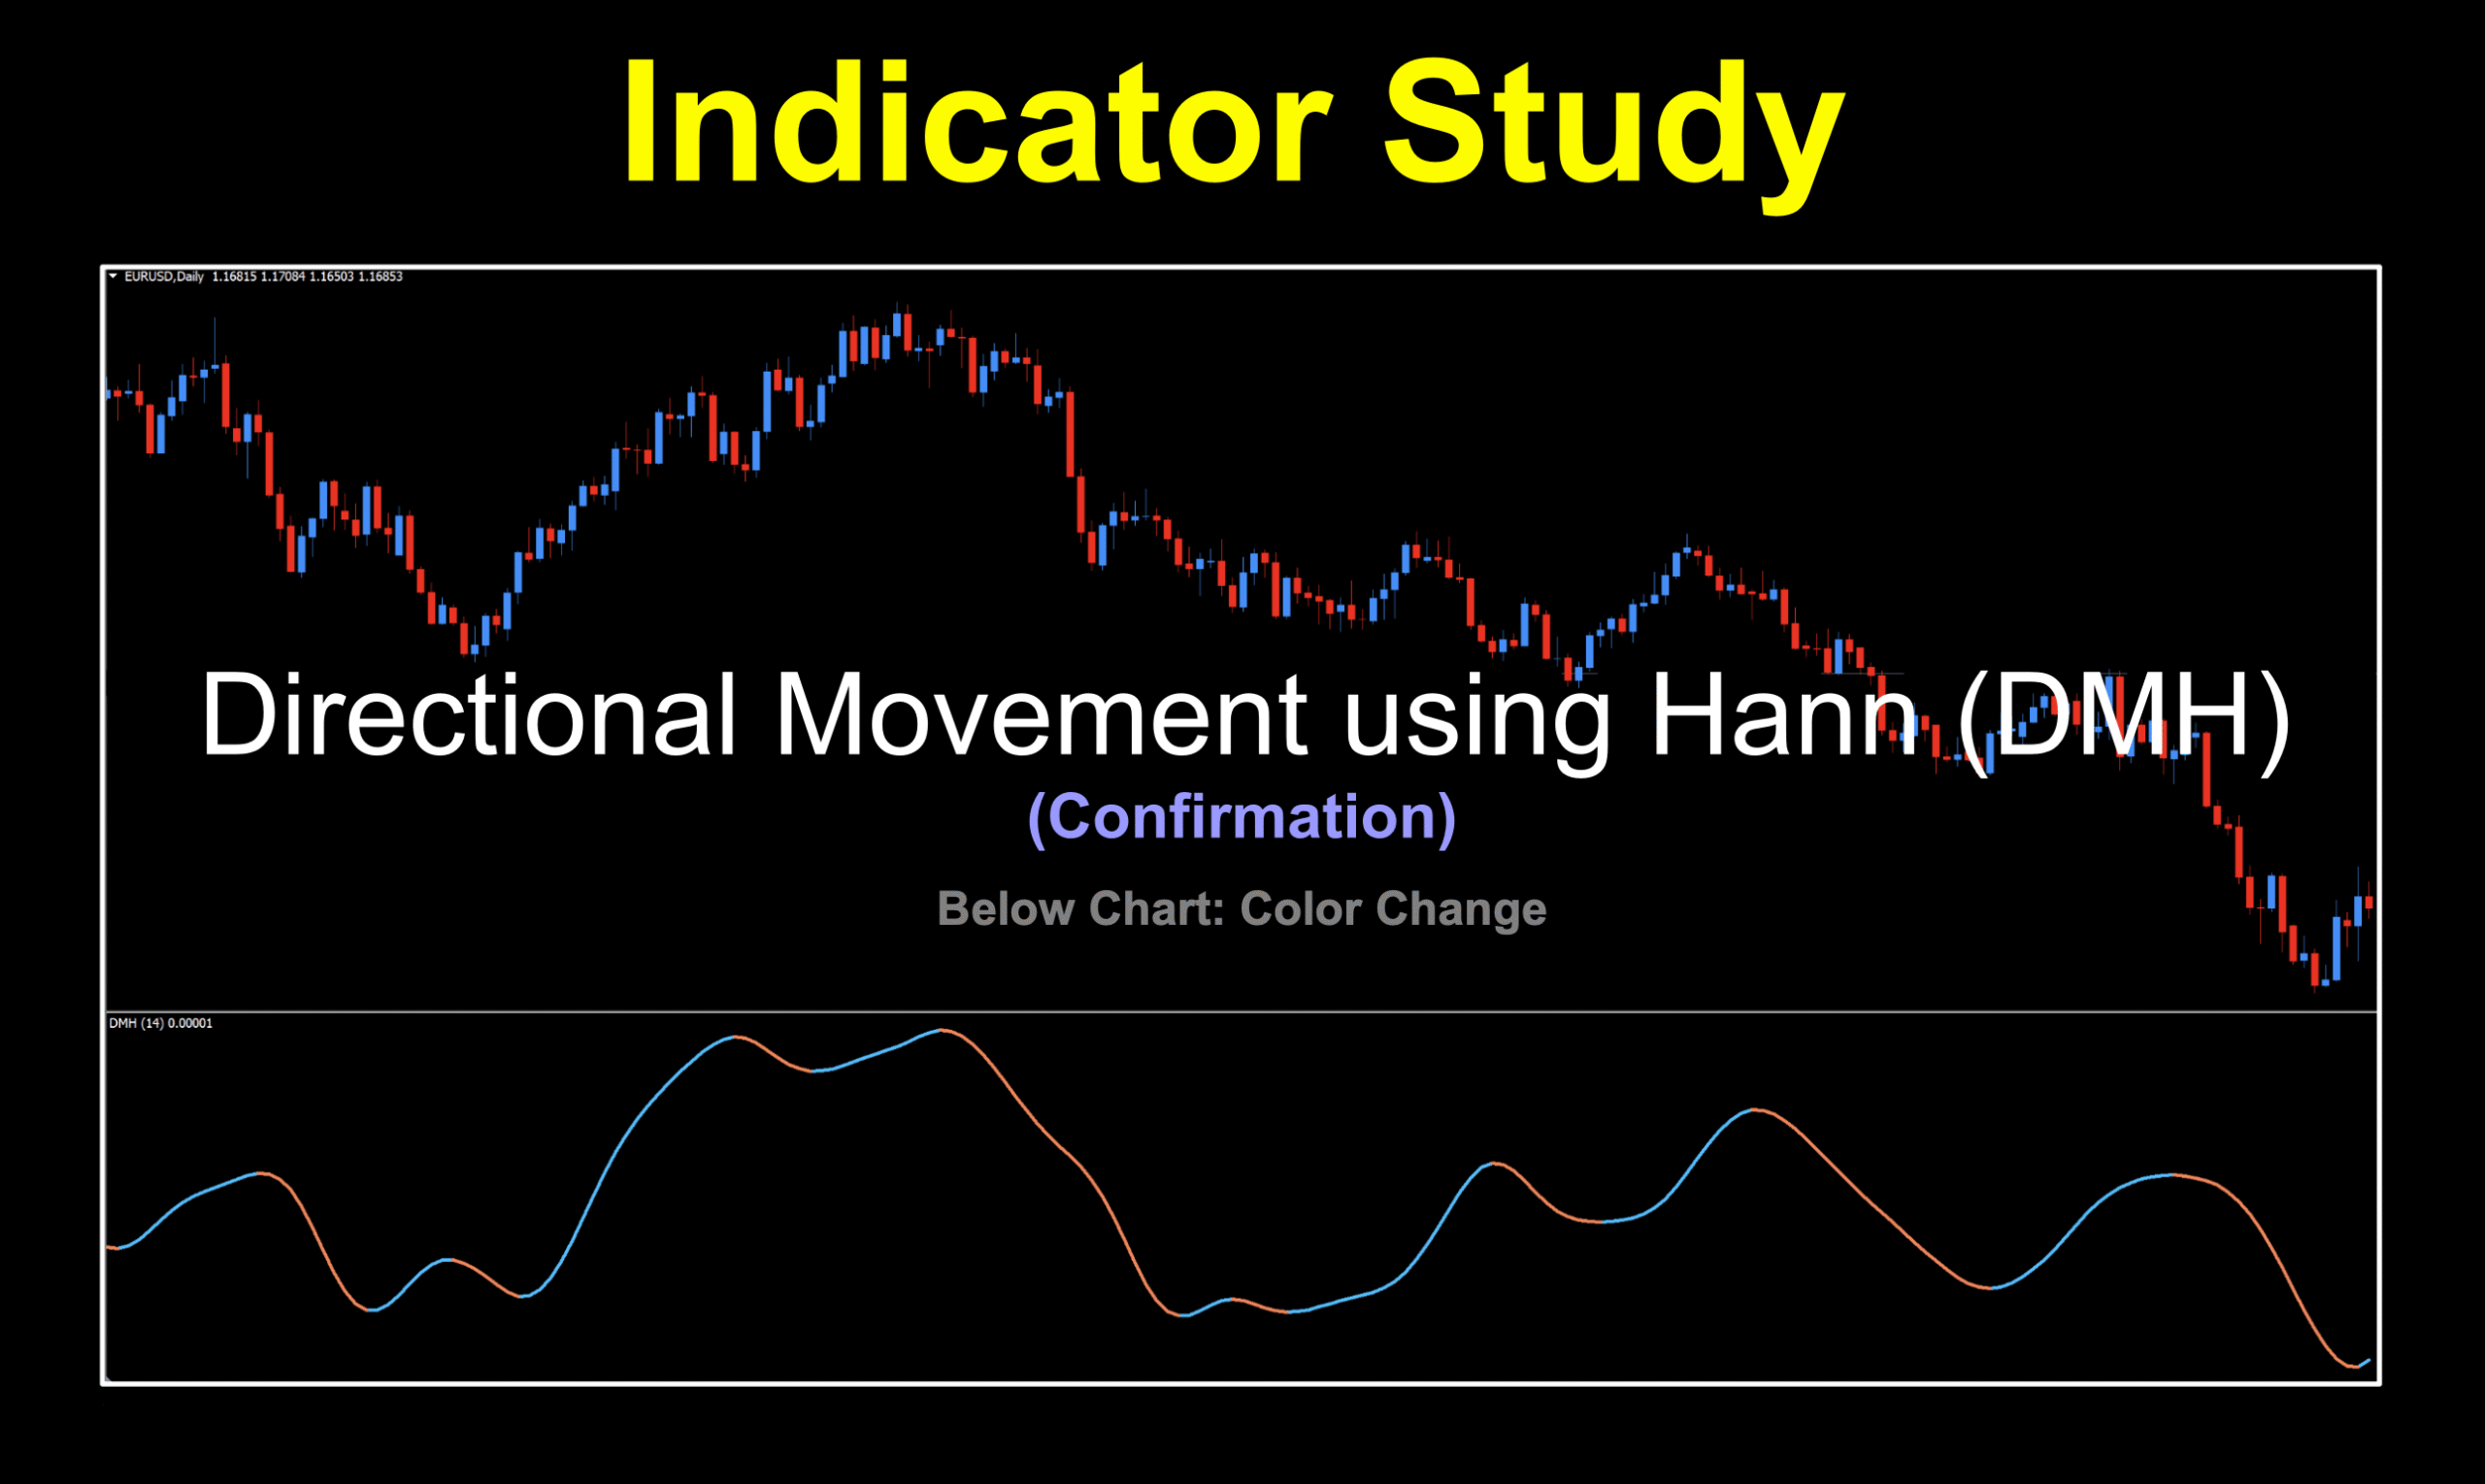
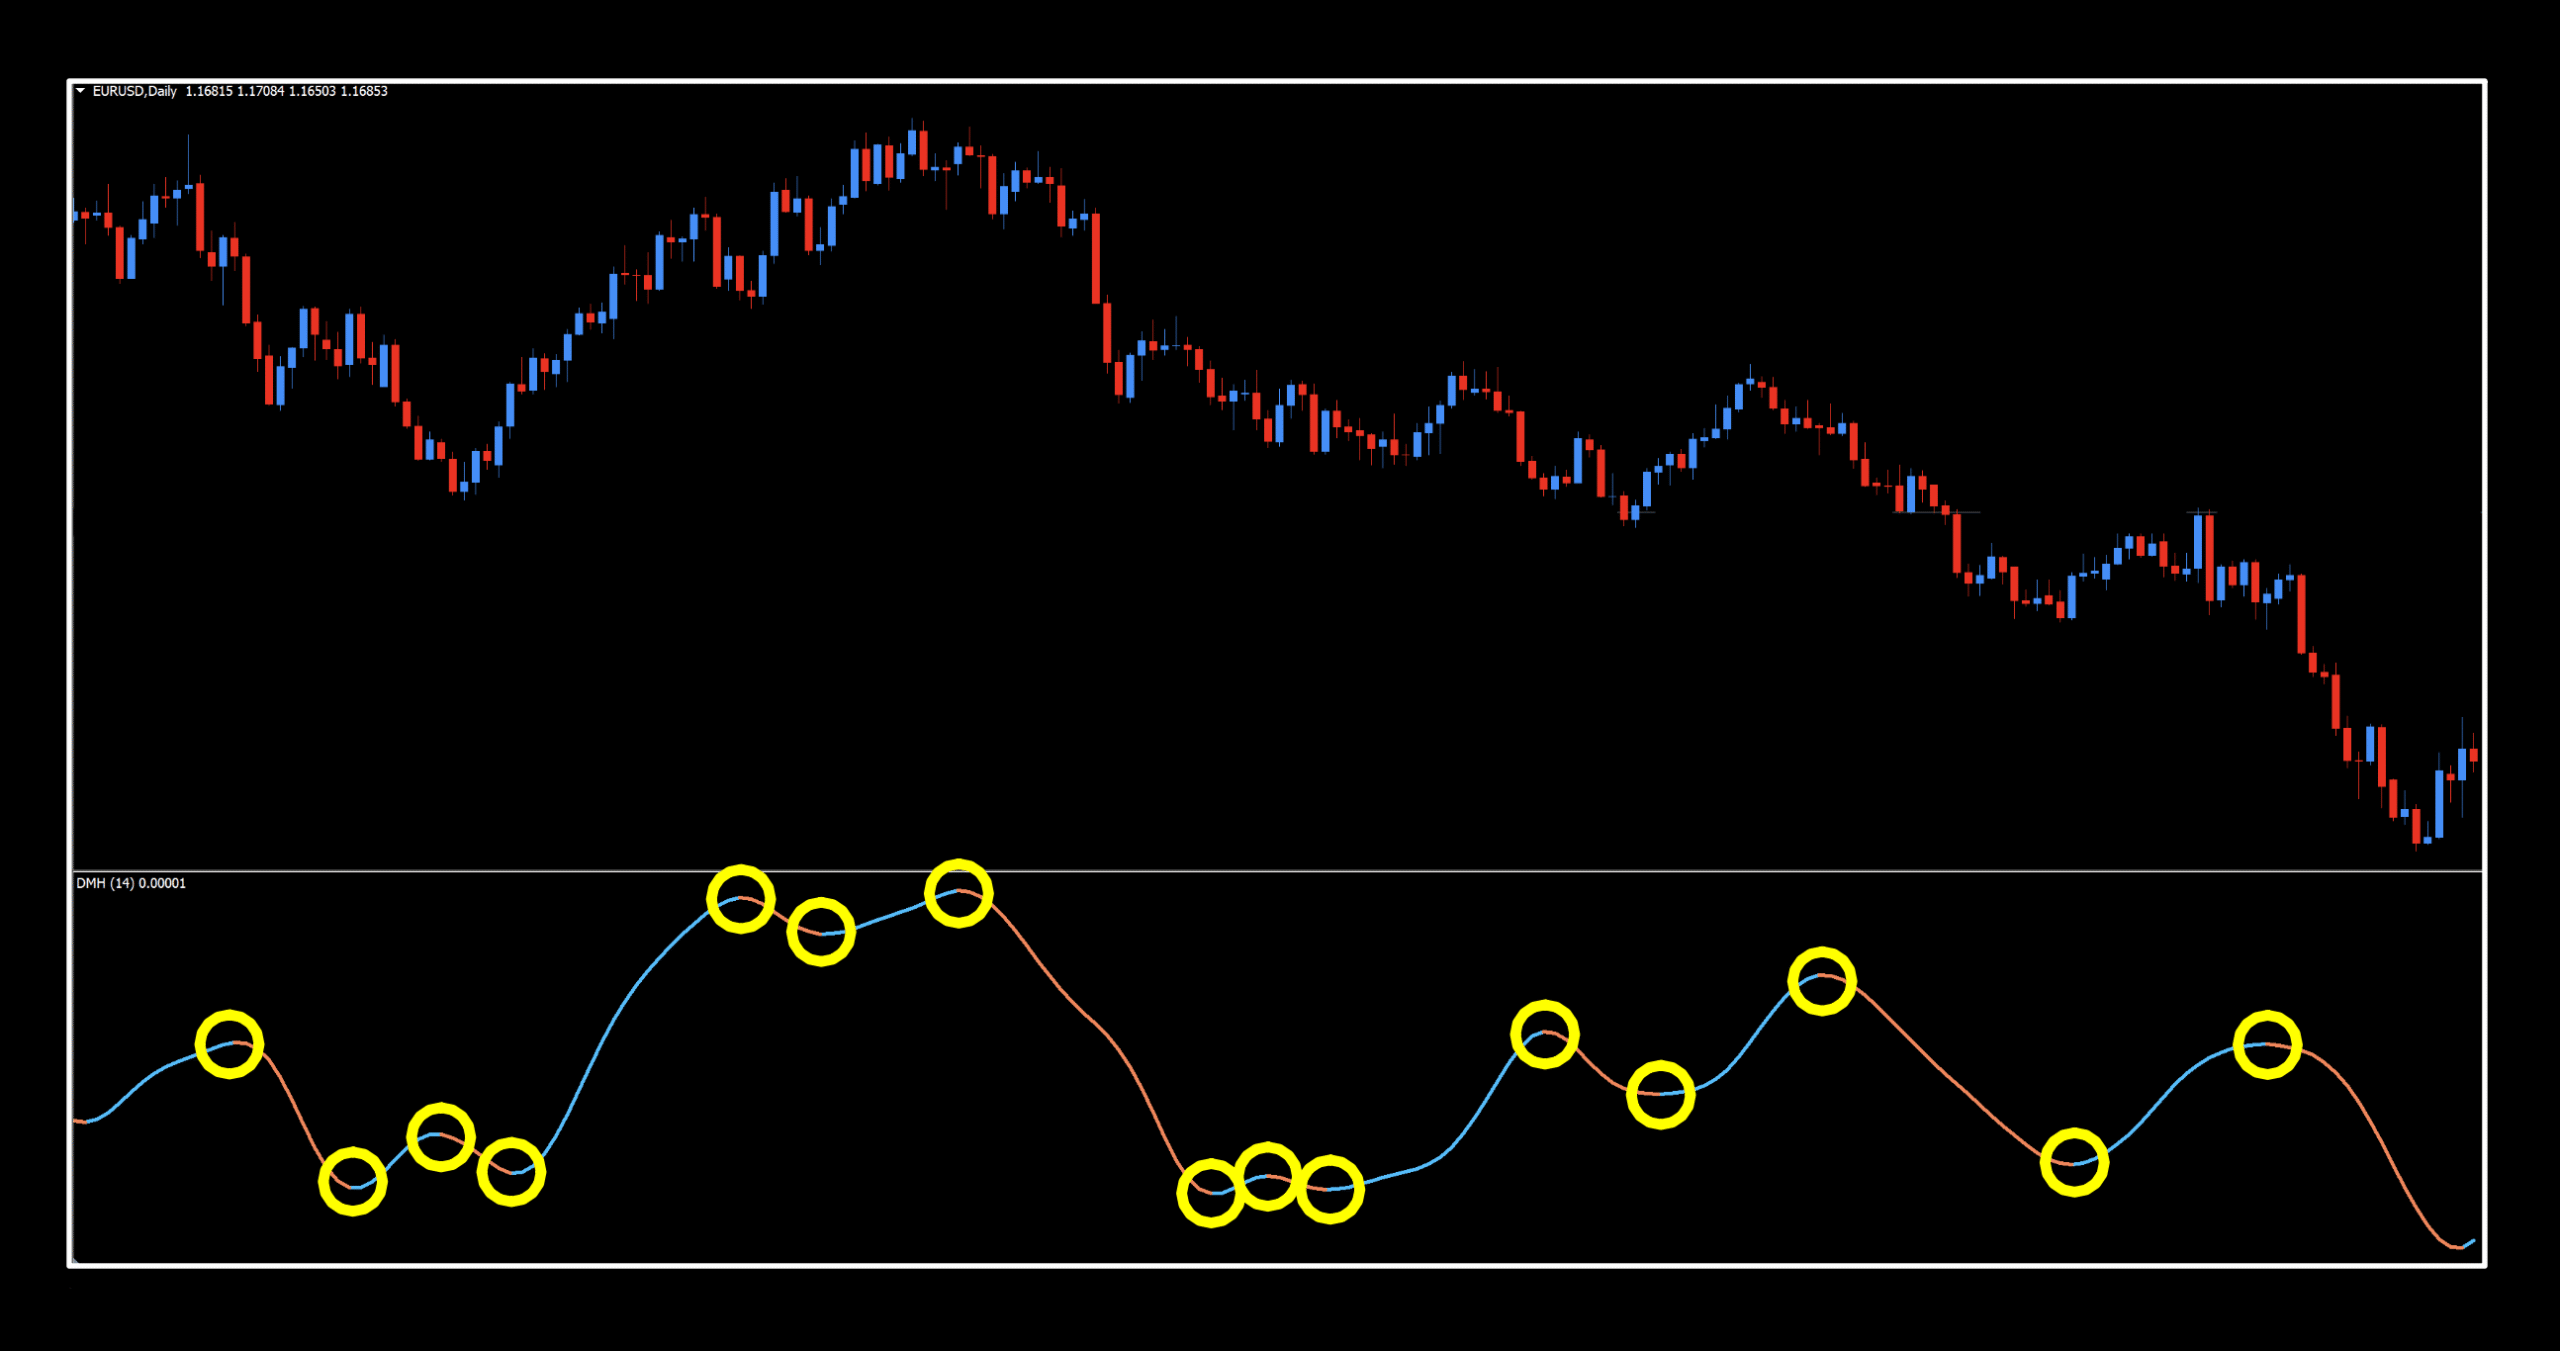
Okay, enough of the jibber jabber, let’s see what this pony looks like. We only had to thicken up the signal line, but we left the default colors and the default methodology for signal identification is of the two color variety.
Settings
This indicator only has two settings, but there is a bit of an interesting twist, which we’ll look at momentarily. Naturally, we use both of them.
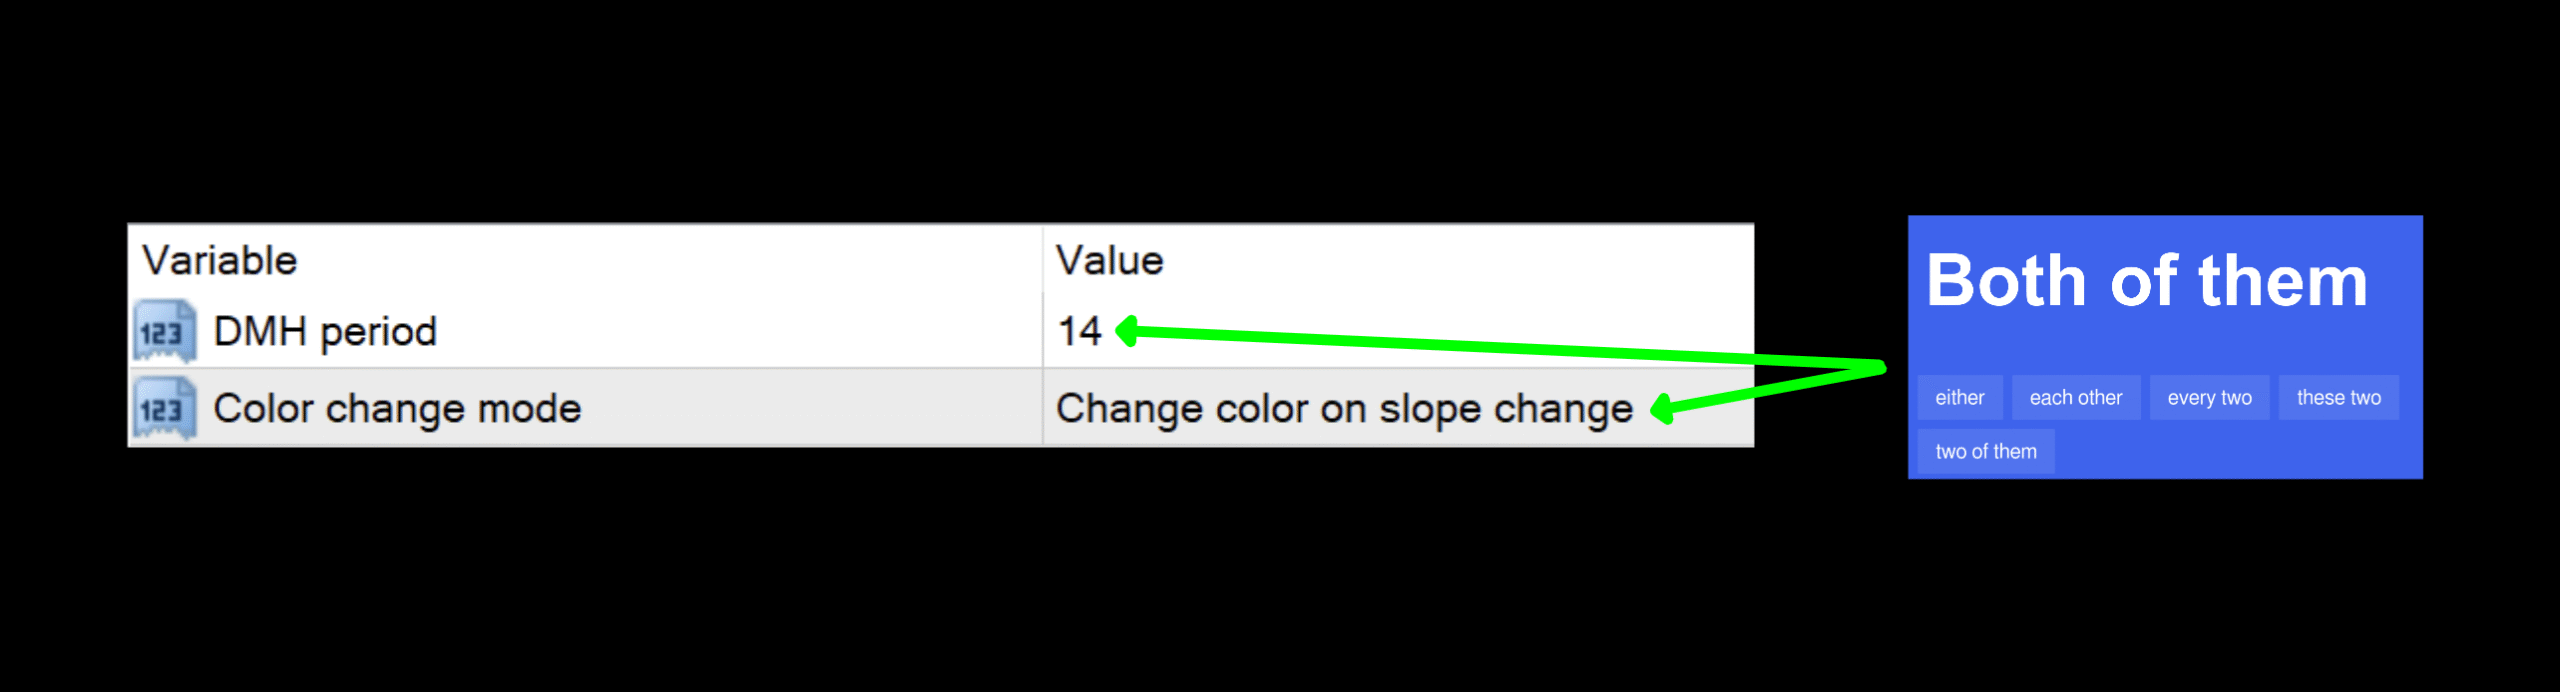
DMH period: The number of periods used for the overall calculation. The default value is 14.
Color change mode: Indicator display mode (we’ll address this shortly). The default is “Change color on slope change”.
Humor
I feel like we found an Easter Egg when we were looking at this indicator. For those who don’t know what that means, an Easter Egg “is an unexpected or undocumented feature in a piece of computer software or on a DVD, included as a joke or a bonus.” The joke is that the default is period value is 14, the magical, mystical number we use for ATR – the most important indicator in the world…which the DMI indicator is predicated on. And which this indicator specifically is NOT. Oh come on, that’s a little funny. Maybe ironic? Okay fine…but, I see you smiling back there.
Daily Maintenance
Remember, once you’re ready to perform daily maintenance on your trades during the last 20–30 minutes of the trading day (1700 New York time), you’ll be presented with one of four options.
- Opening a trade.
- Closing a trade
- Maintaining a trade; i.e.
- Moving a stop loss level.
- Exiting a trade.
- Taking a pass (nothing to do).
Long: When the signal line turns from orange to blue.
Short: When the signal line turns from blue to orange.
Take 1
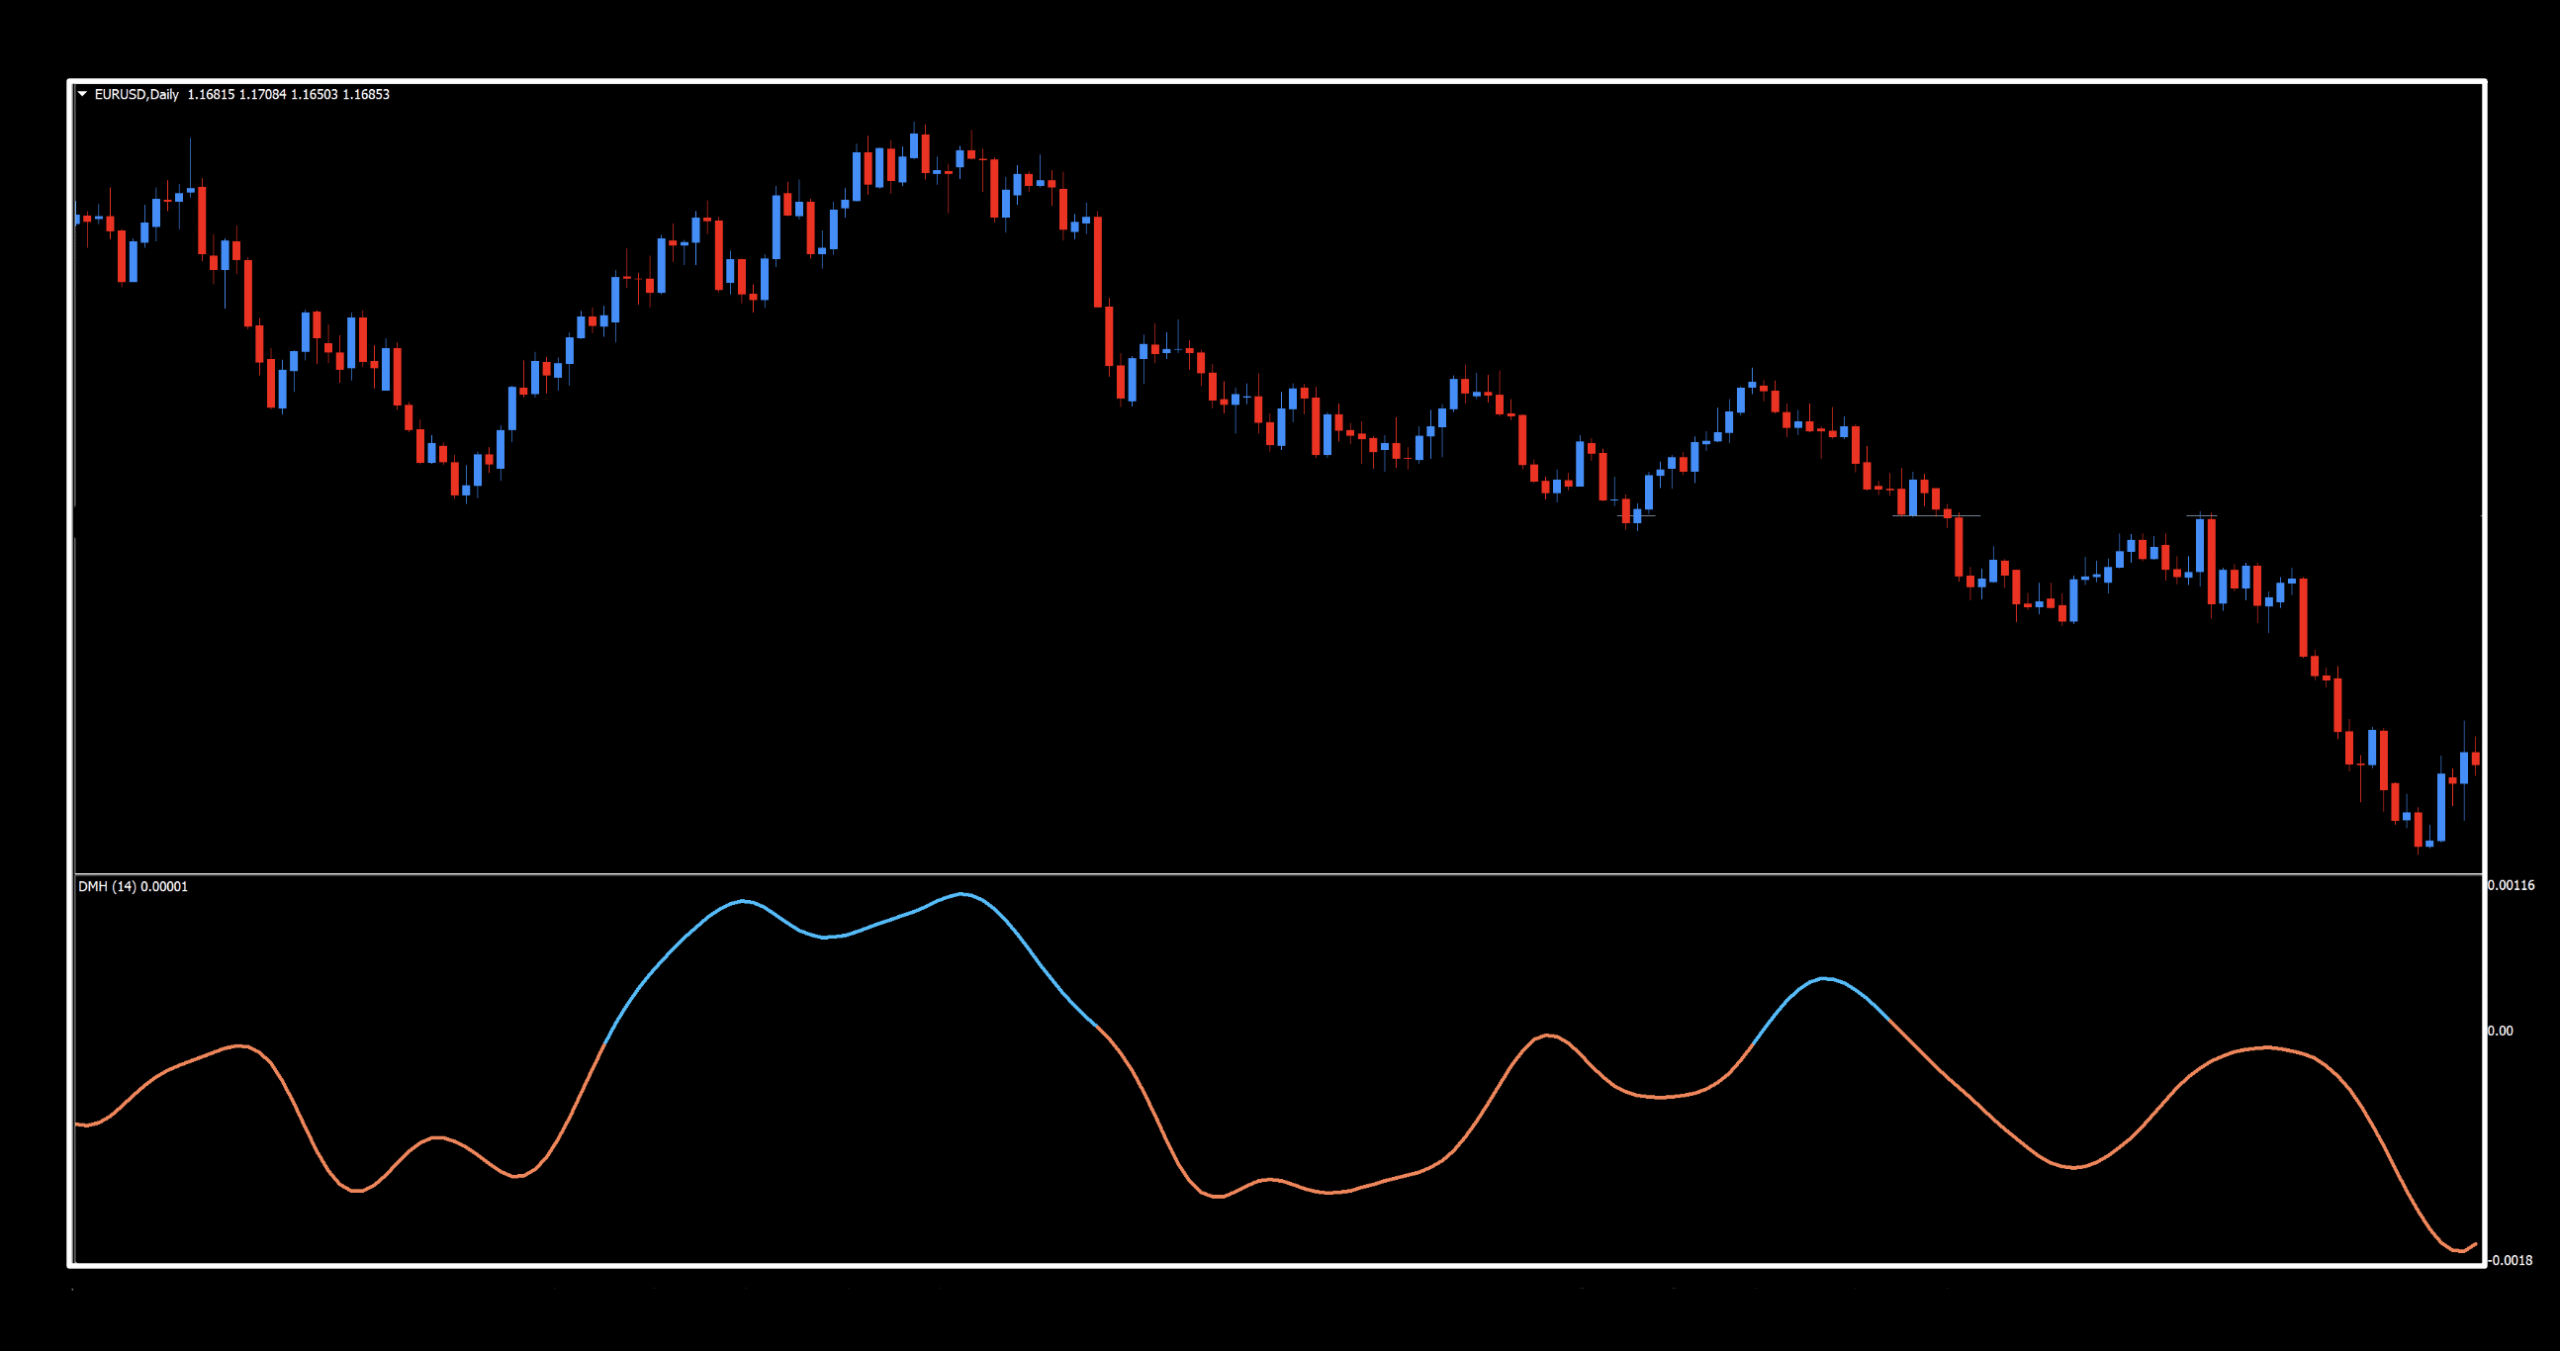
The initial reaction to this chart is that it reacts well to change in direction and has some great possibilities, even on the default settings. HOWEVER…
Settings (Take Two)
There is another drop down menu choice where we have the ability to use this indicator another way.
Can you figure out what the difference on this chart is? How about a clue?
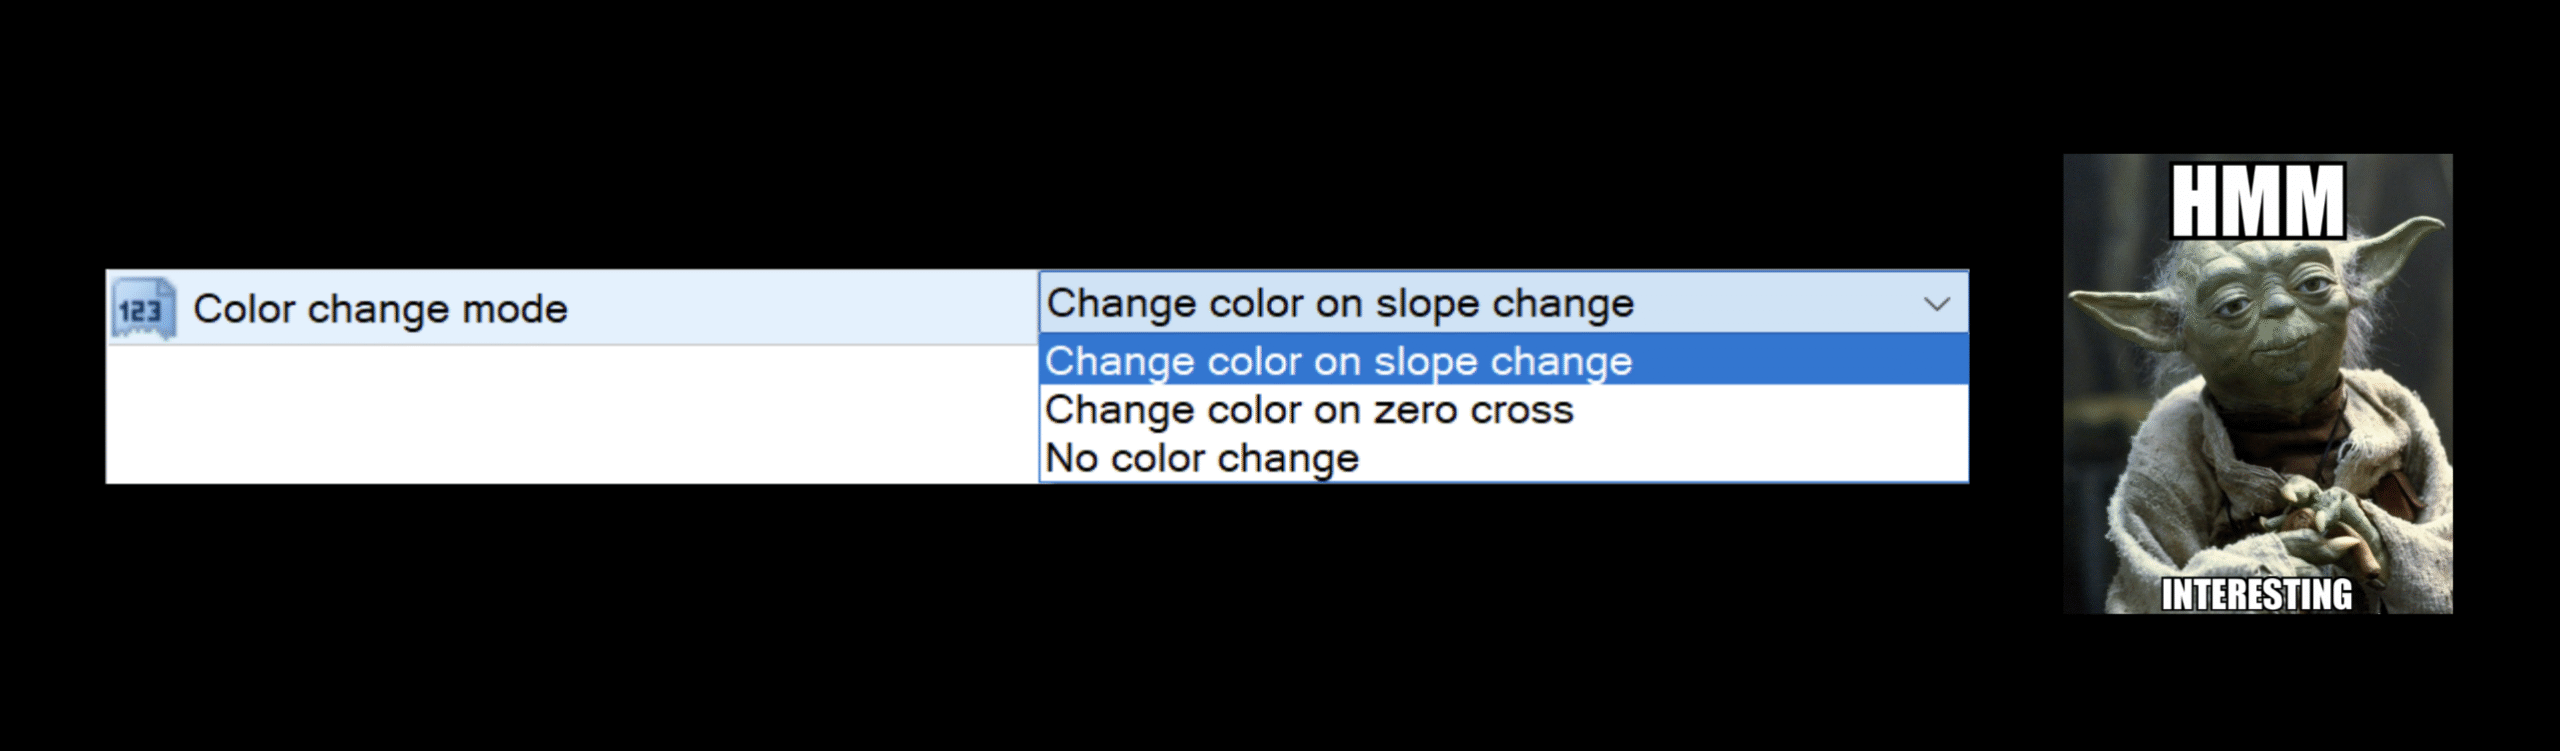
Did you see it? How about now?
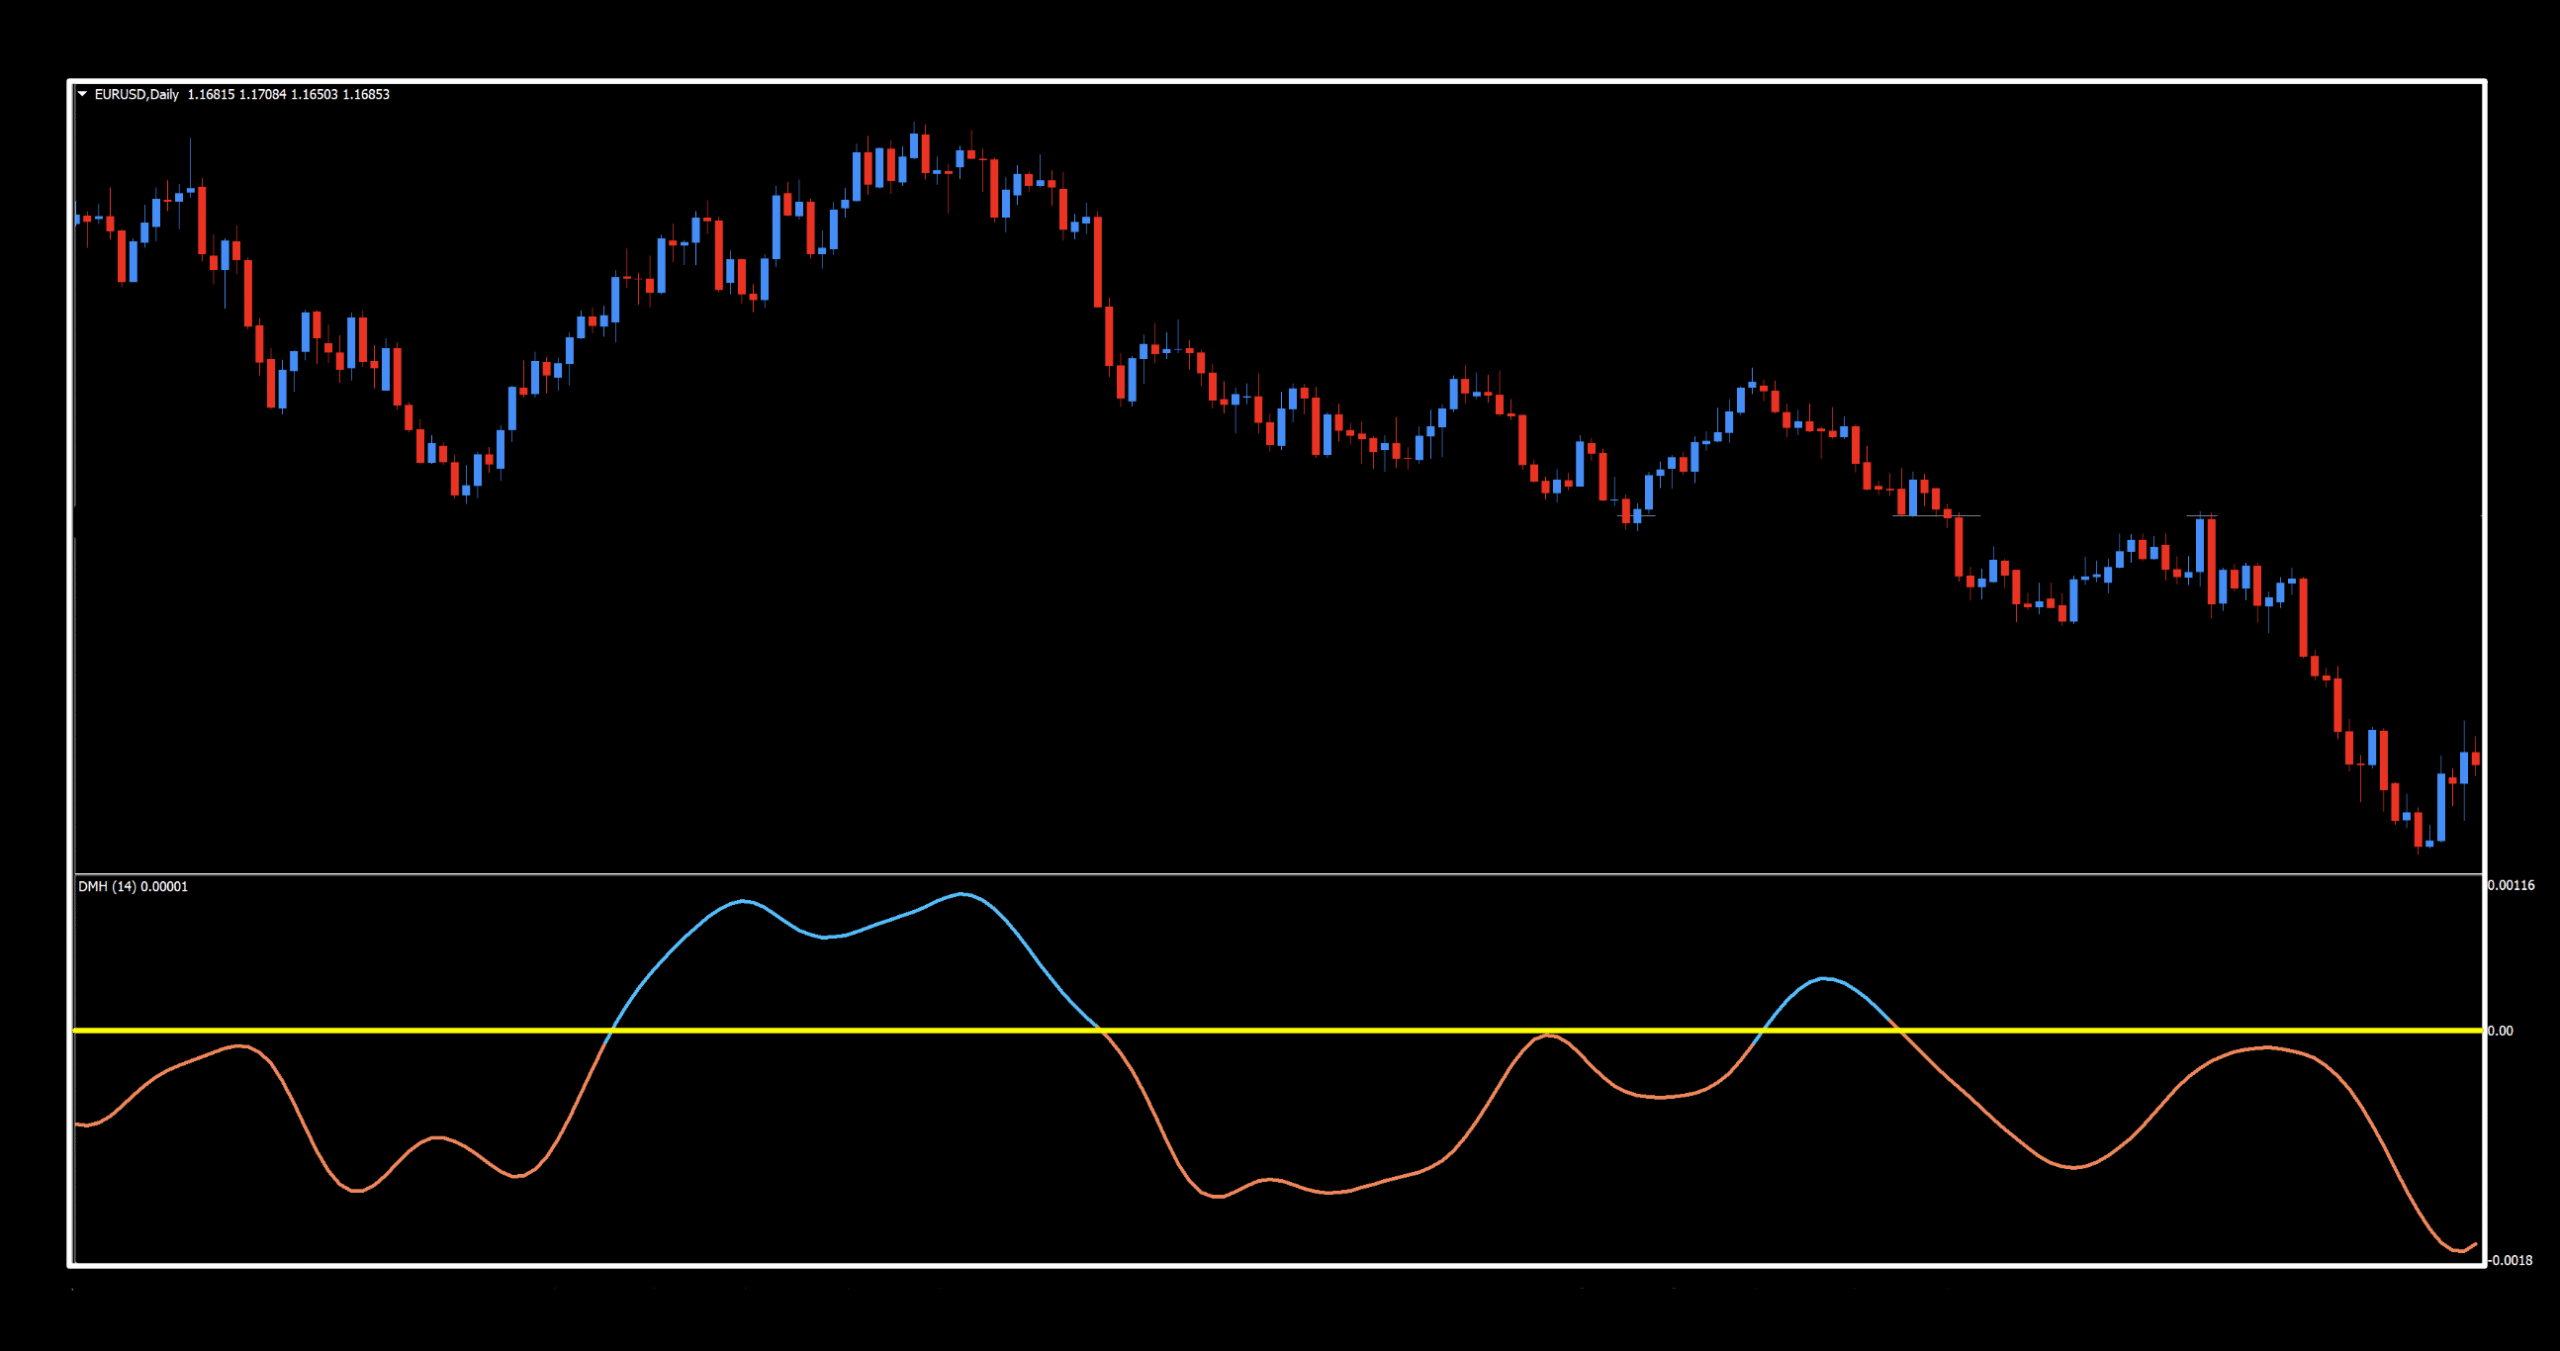
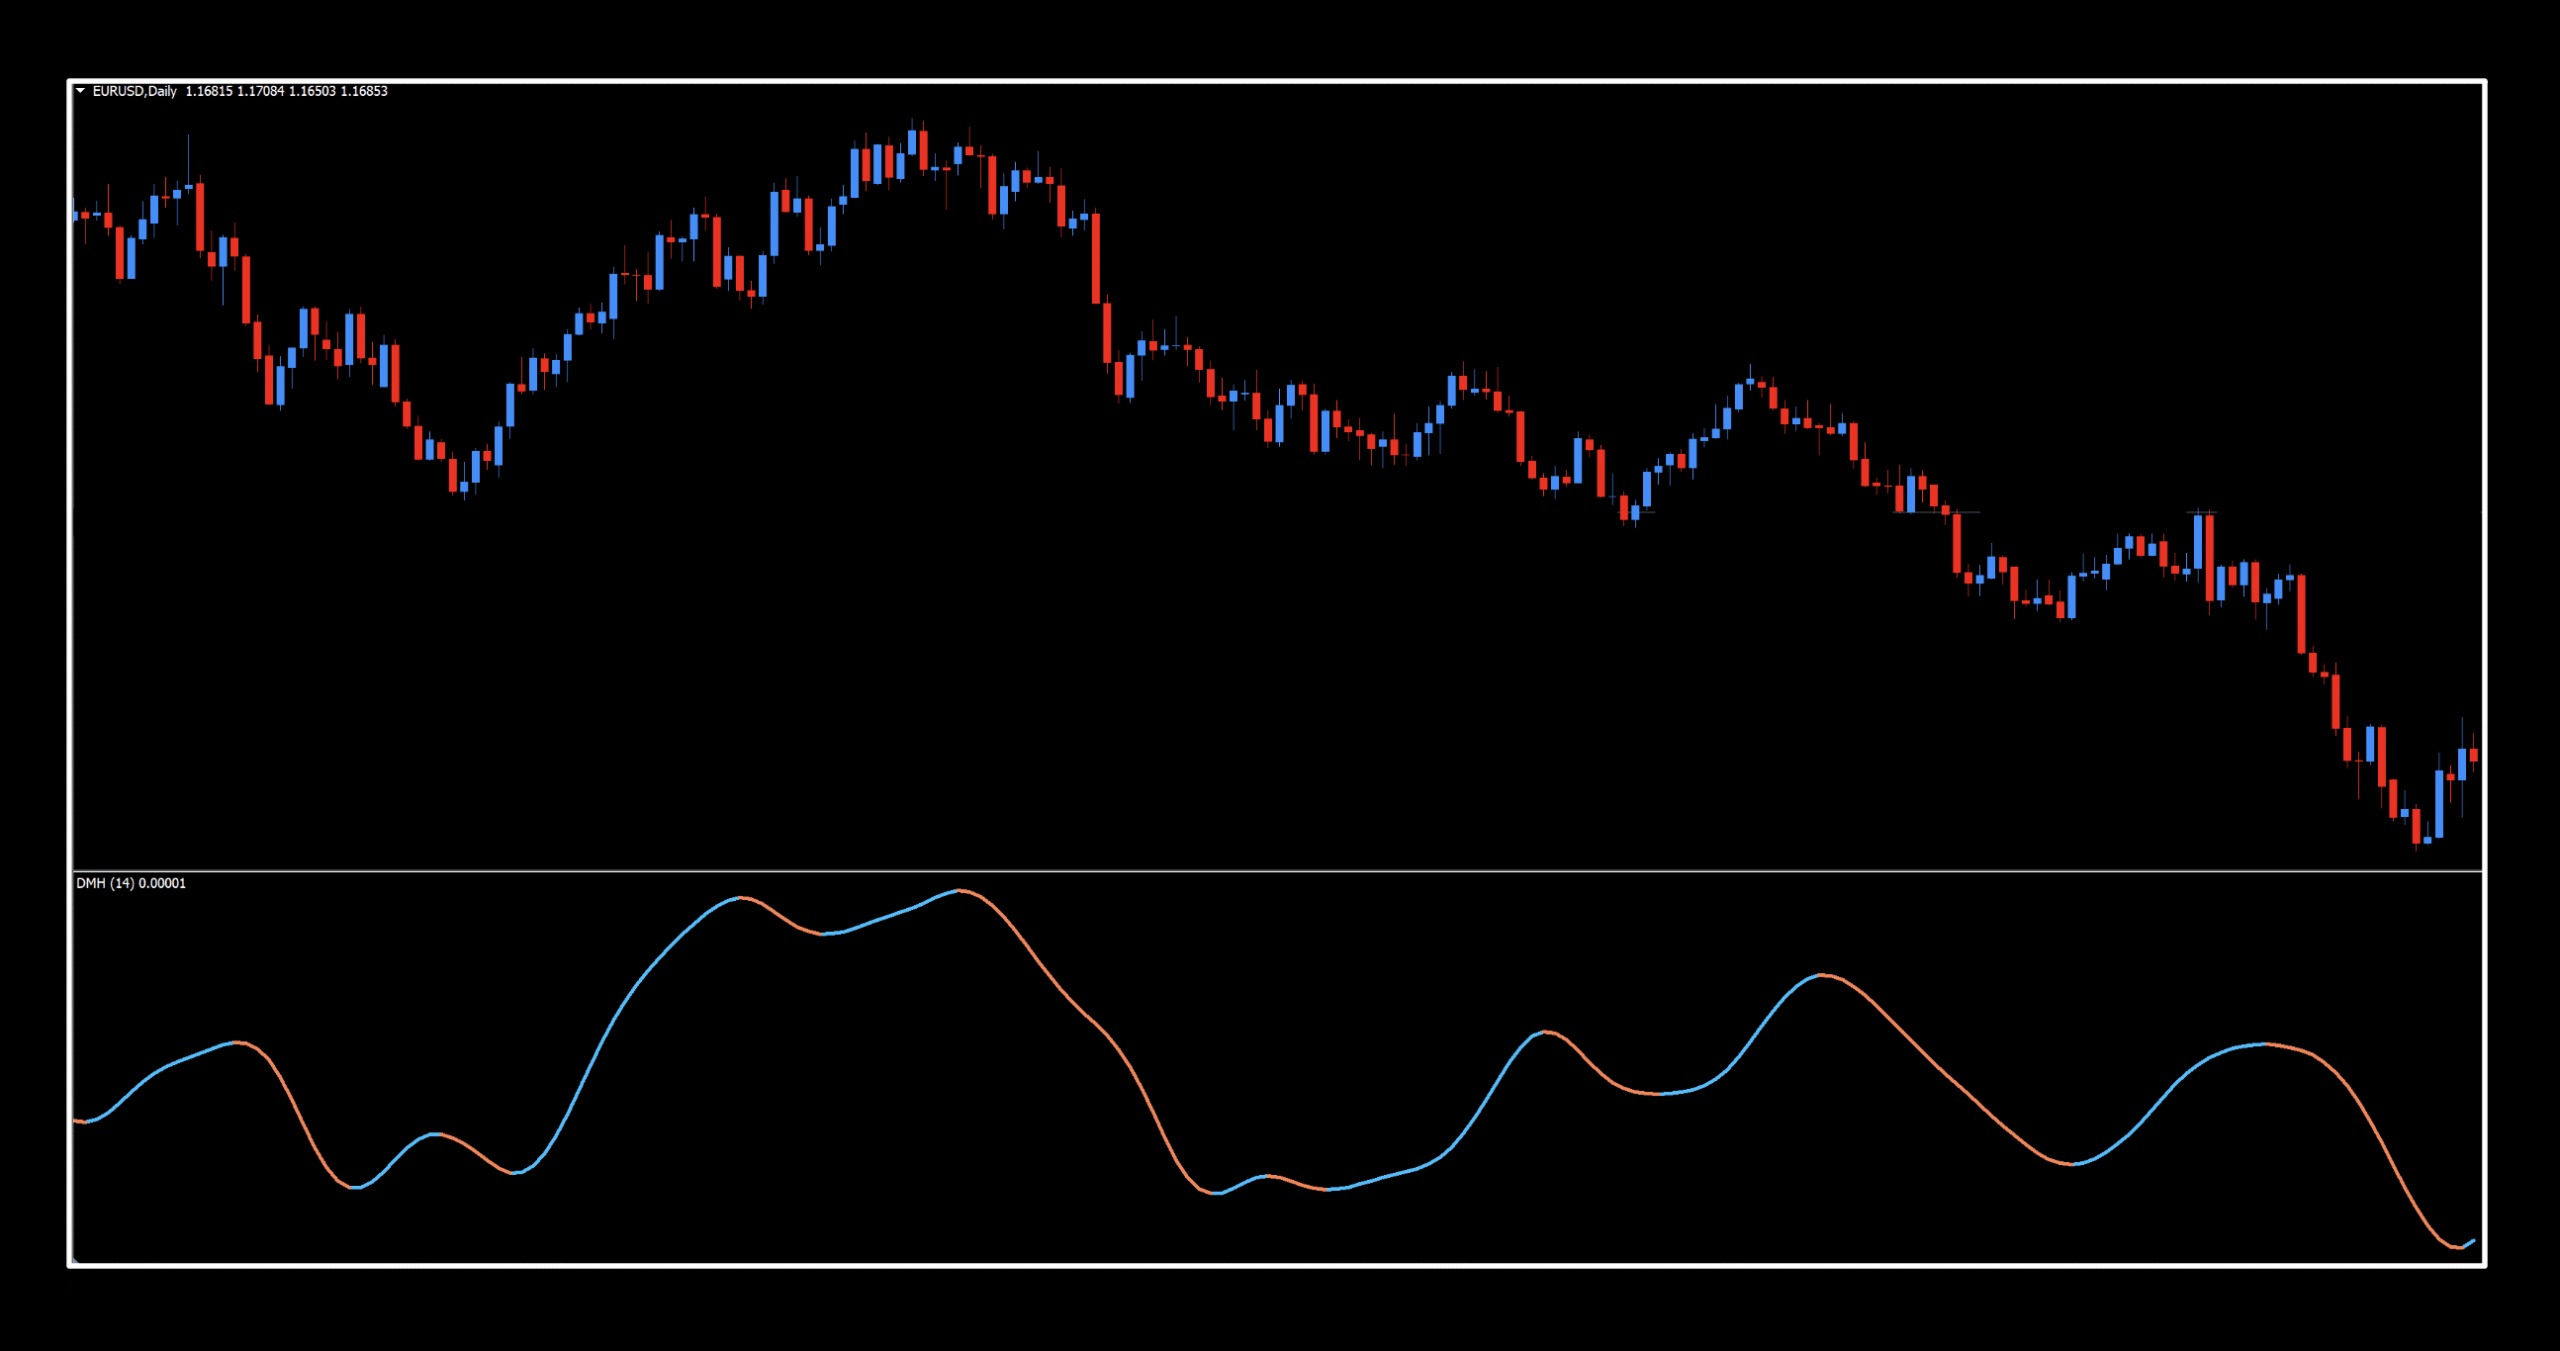
Yes, that’s right…it can be programmed to display signals as a zero cross, merely by toggling that second display. Those signals look like this…
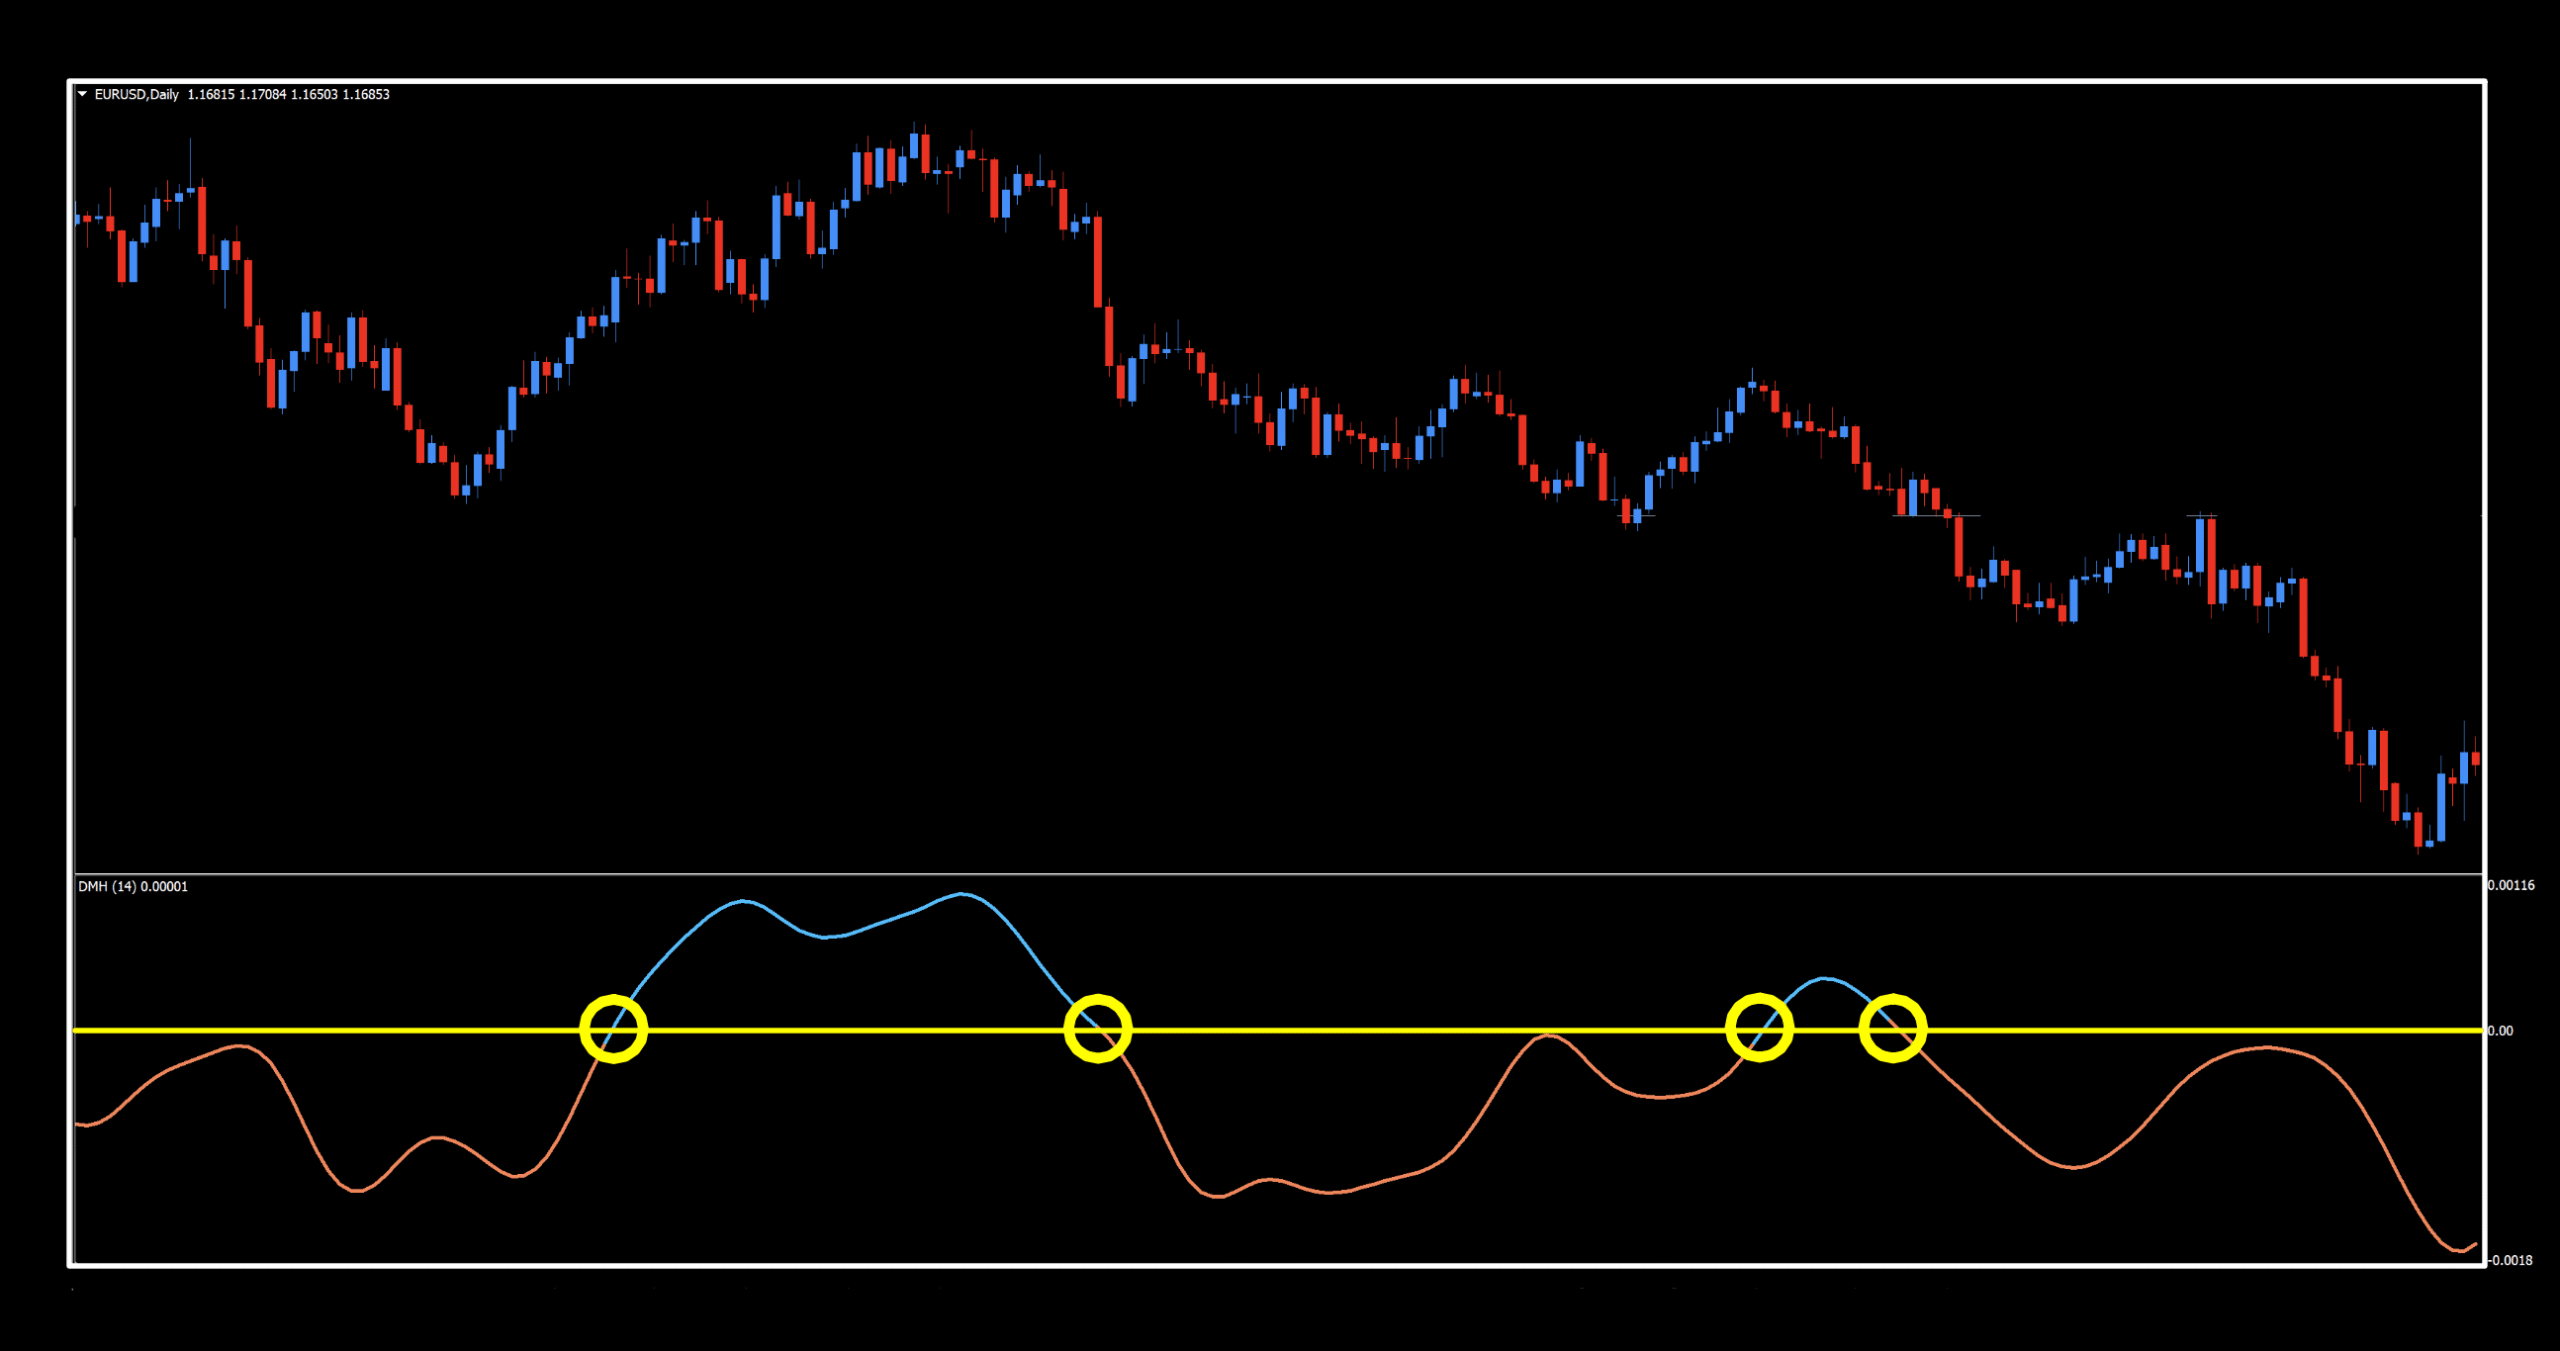
That’s a lot less signals, and a lot “slower” than the change in slope style. Who knows, perhaps you can use this version as your C1 and the first version as your C2. The big question is…which one performs better? Let’s go see!
Thirdly
By the way, the third choice, “No color change” just turns the signal line a solid blue which, with a zero line is the same thing as the second choice and your choice, as well.
We ran both versions through the process and came out with the following results.
As a color change on direction of slope:
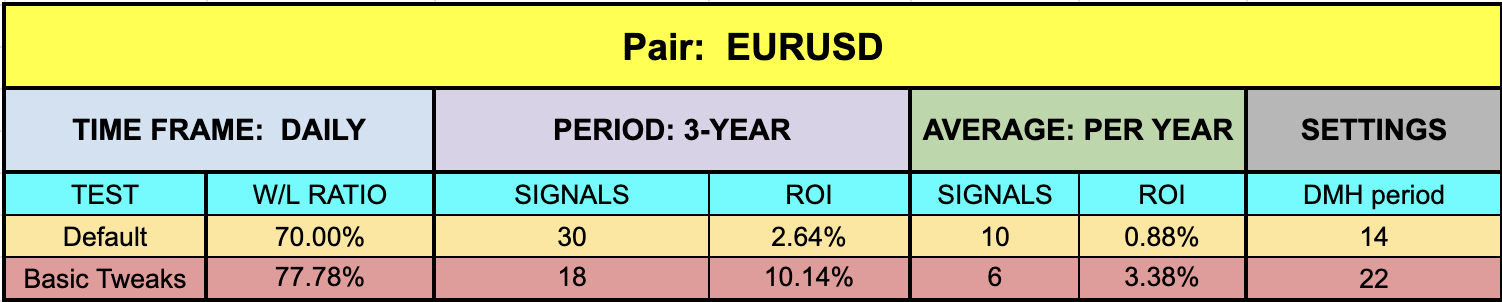
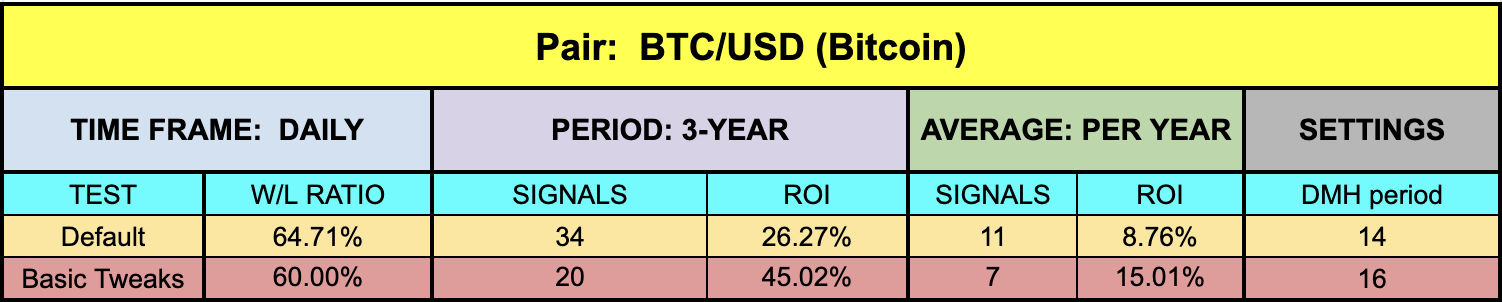
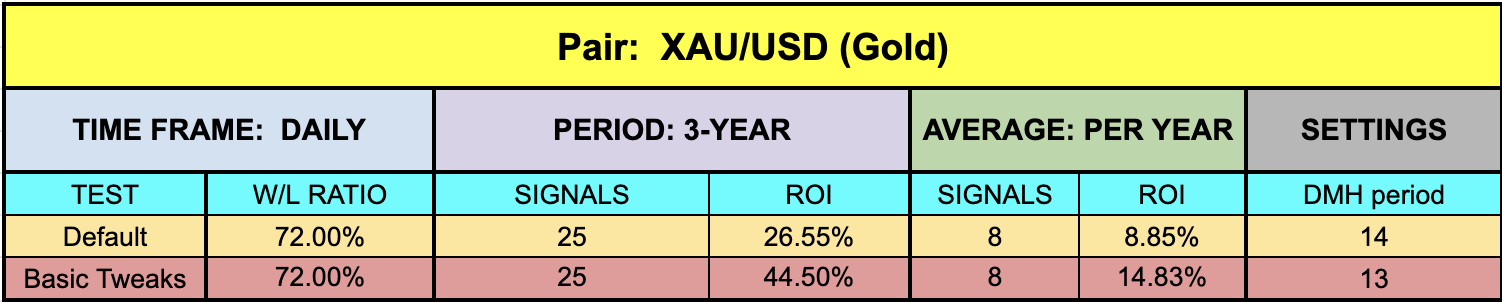

Looky, looky…first things first. The default ROI% on all pairs was net positive, so that’s a great start. Overall, the tweaked numbers returned pretty decent results. If you take a gander at the SPX500, we took a tweaked setting with a much higher period setting. Sure, there were fewer trades, but look at that win/loss ratio. Hot stuff! Now, let’s take a peek at the results using this indicator as a zero cross.
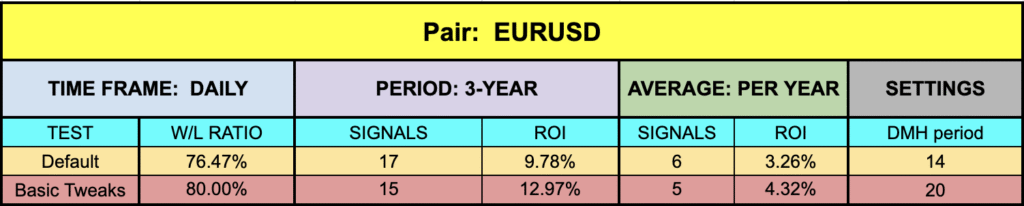

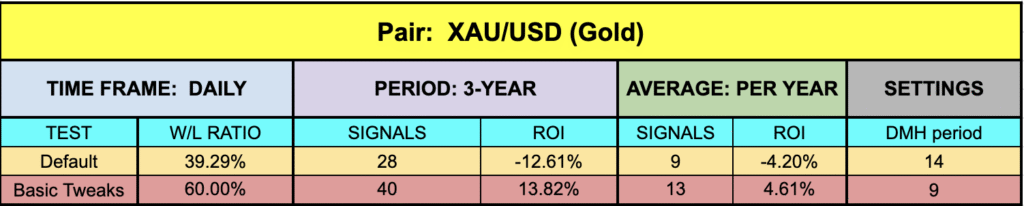
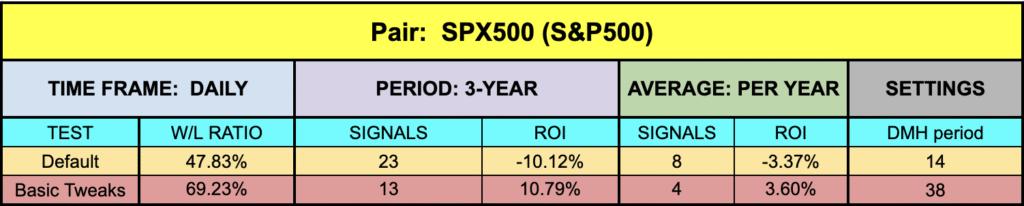
Well, we think the choice is obvious. While the EUR posted slightly better results as a zero cross and the SPX500 was close, XAU and BTC were way off the mark. We also started in negative territory on a couple of the tests, which may be something to consider as well.
Resources
This is available in the Stonehill Forex library for free and will have “NEW” in red to alert you to its location. Get it HERE. Be sure you’re subscribed to the Stonehill Forex YouTube channel to watch the technical analysis portion of this week’s installment. Get your trading to the next level by signing up for the Advanced NNFX Course HERE.
Our only goal is to make you a better trader.
*Our published testing results are based on money management strategies employed by the NNFX system and depend on varying external factors, which may be different between individuals and their specific broker conditions. No guarantee, trading recommendations, or other market suggestions are implied. Your results and subsequent trading activities are solely your own responsibility.
BTW — Any information communicated by Stonehill Forex Limited is solely for educational purposes. The information contained within the courses and on the website neither constitutes investment advice nor a general recommendation on investments. It is not intended to be and should not be interpreted as investment advice or a general recommendation on investment. Any person who places trades, orders or makes other types of trades and investments etc. is responsible for their own investment decisions and does so at their own risk. It is recommended that any person taking investment decisions consults with an independent financial advisor. Stonehill Forex Limited training courses and blogs are for educational purposes only, not a financial advisory service, and does not give financial advice or make general recommendations on investment.