Cousins Can Be Helpful
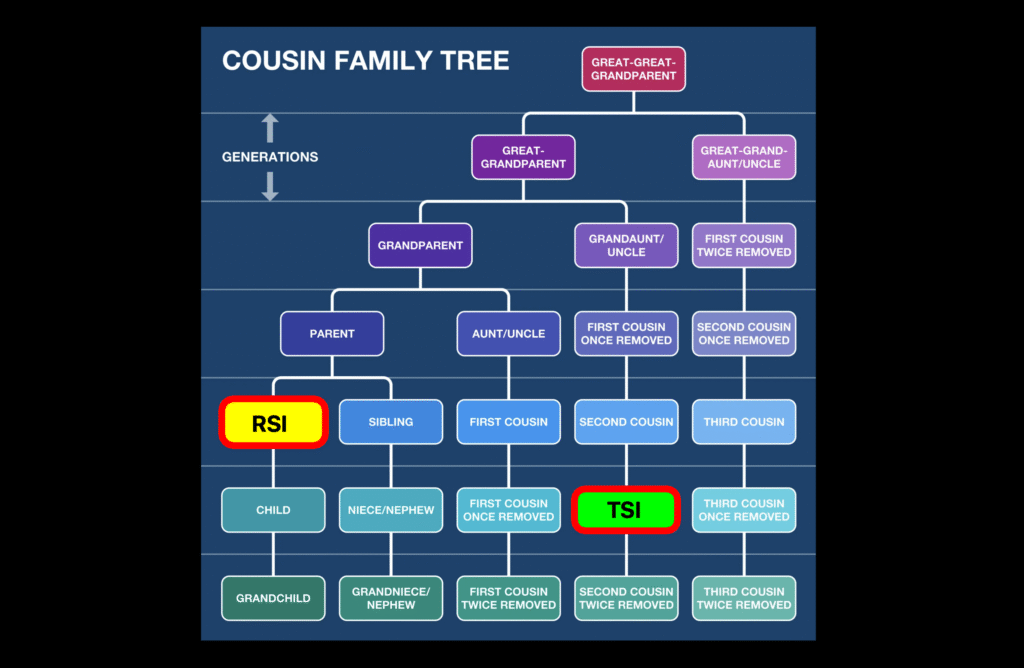
If you have a moderately extended family, then there’s a good chance you’ve got a cousin. Whether it’s the cousin that makes your family proud, cringe, or just occupies a space on the family tree, we’re hoping this cousin of the Relative Strength Index (RSI) has something to raise the family up. And, add some cashola to the trading account.
Technical Analysis Video will be inserted here!
What Makes it Tick
Unlike the RSI which compares the average gains of an asset over a specified period to its average losses over the same period, the True Strength Index (TSI) does more. Specifically, it employs double smoothing…and we love smooth. The double smoothing compares a shorter average against a longer one.
Step Two
Then, it applies both one period momentum of the close price and its absolute value. At the end of the day (figuratively and literally), this produces a percent ratio between the two values, which is then printed on the chart as a zero cross indicator.
The Archives are Buzzing
The True Strength Index was developed by one of our well known gurus, William Blau. This indicator was introduced in1991 and was showcased in Stocks & Commodities Magazine. In comparison, the RSI came out in 1978, so this one has a fresher approach to momentum. Granted it’s a little before our 1996 cutoff, but some of these “older” tools sometimes deserve a look.
Looky Looky
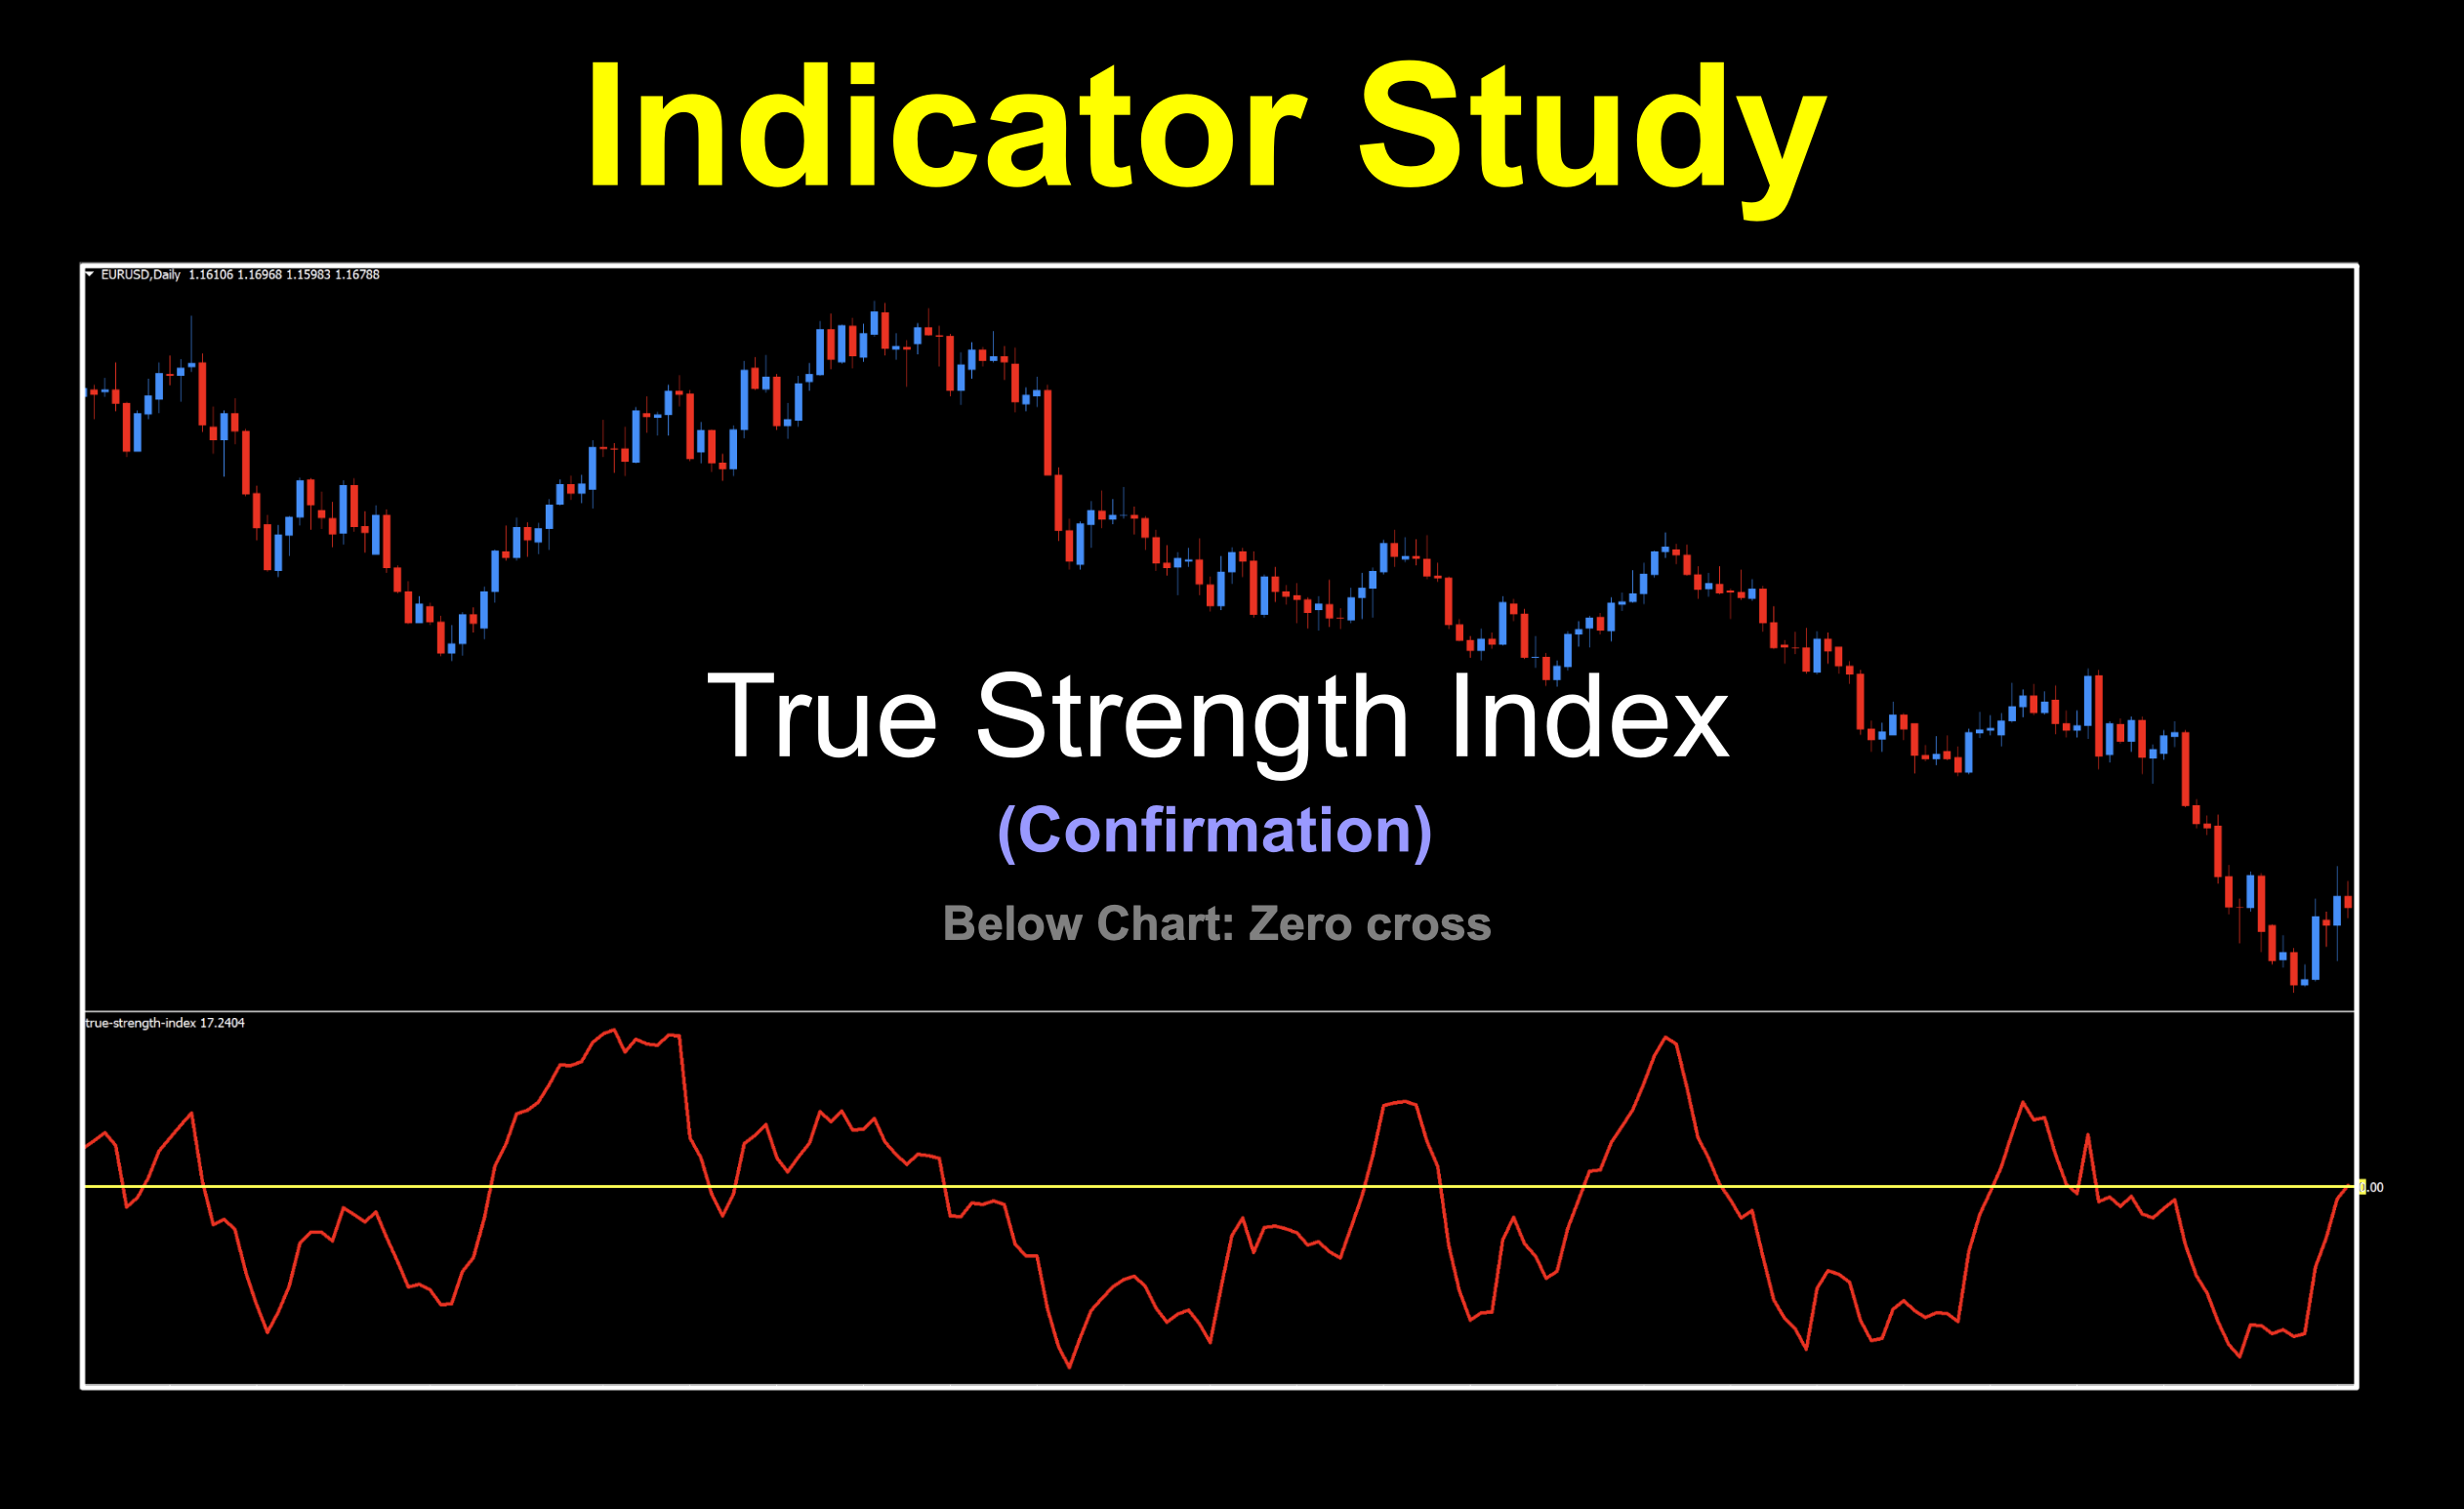
We’ll take a look at the default view. We had to thicken up the red signal line and add a zero line, which is kind of odd since there was none…and it’s billed as a zero cross indicator. Easy fix.
Like many of our other zero cross indicators, it’s pretty straight forward. We happen to notice that we seem to go with the red and yellow theme. It just happened that way. You can make things whatever color you want. It’s your party…
Settings
There are only two settings so that’s kind of sweet when testing. But just remember, you WILL have to add a zero line so you know when long and short signals print.
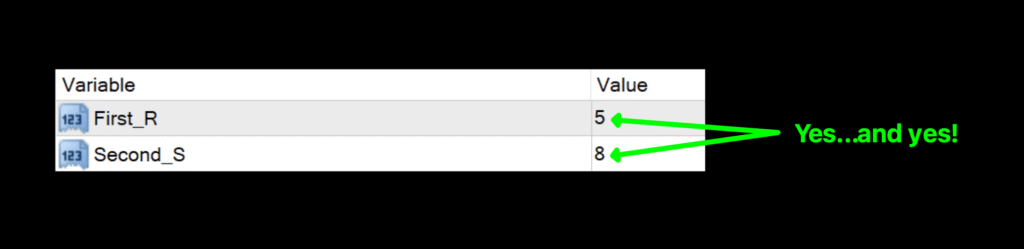
First_R: The number of periods used to calculate the short average. The default value is 5.
Second_S: The number of periods used to calculate the long average. The default value is 8.
Daily Maintenance
Remember, once you’re ready to perform daily maintenance on your trades during the last 20–30 minutes of the trading day (1700 New York time), you’ll be presented with one of four options.
- Opening a trade.
- Closing a trade
- Maintaining a trade; i.e.
- Moving a stop loss level.
- Exiting a trade.
- Taking a pass (nothing to do).
Long: When the signal line crosses above zero.
Short: When the signal line crosses below zero.
Elementary
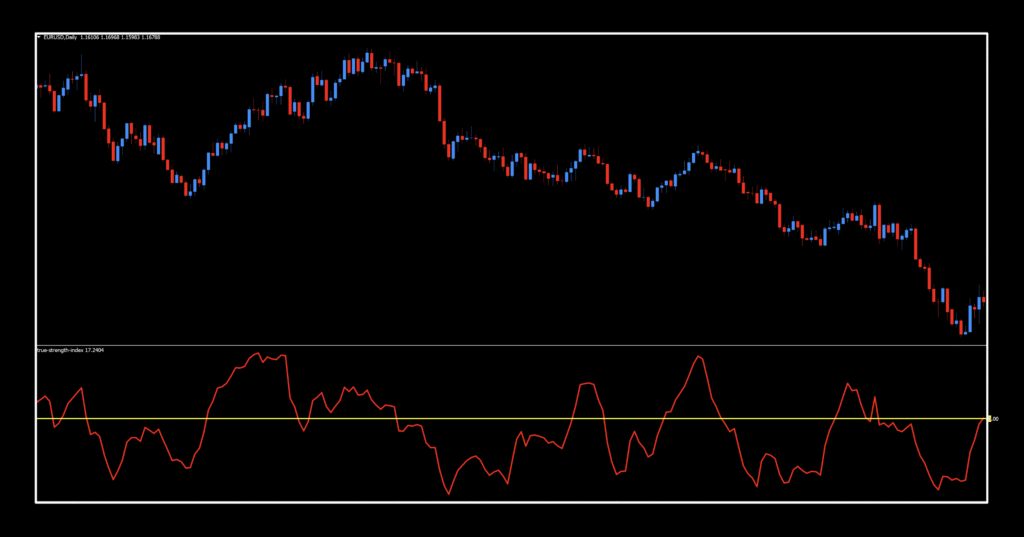
Below are the marked up signals. Note that there are a couple of areas where the signal line jumps between long and short. Naturally, changing the settings may remedy this, and that’s where the fun lives.
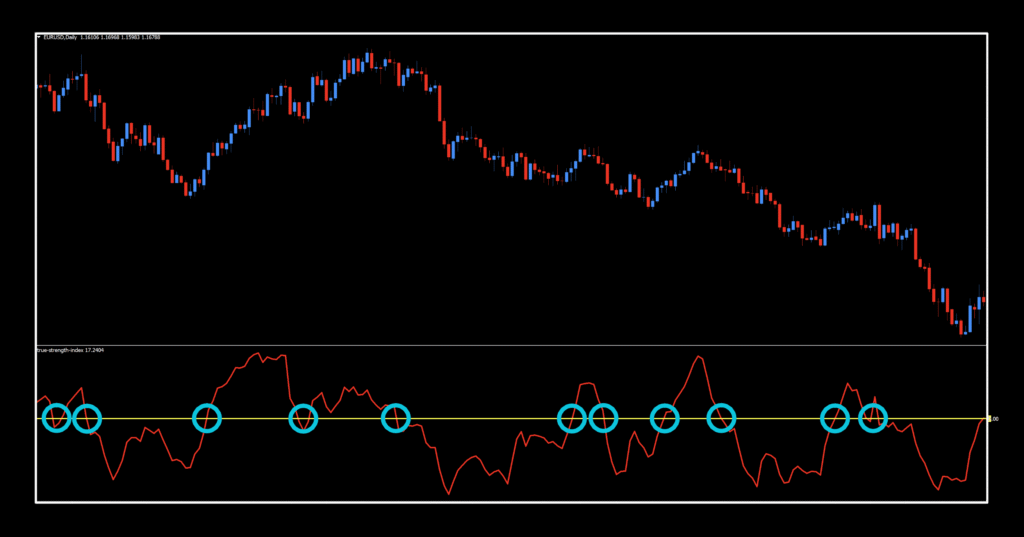
It’s got some good legs. Visually, you can follow its reaction to price pretty clearly, and it appears to have some pretty decent entries (and exits) on the default settings. Remember that the smaller the period, the faster the signal line and the more frequent signals you’ll see. Finding that balance is what it’s all about.
Evaluation
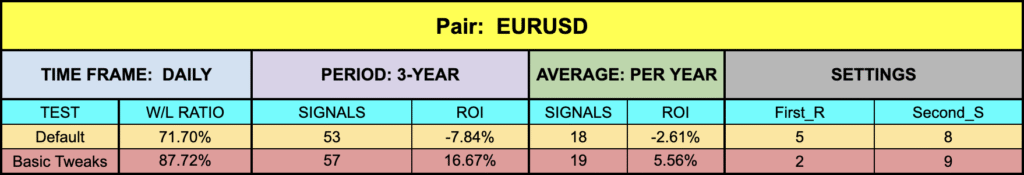
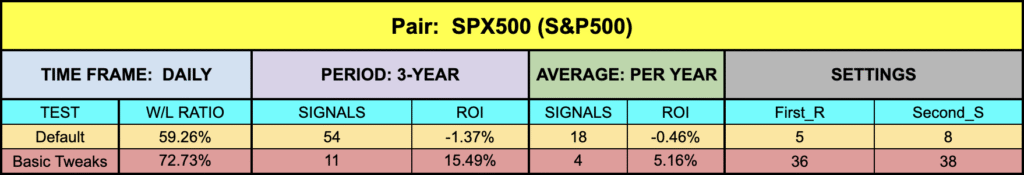
Don’t be bashful. Take a look at our results and decide if it’s something you want to try out yourself. It costs you nothing but a bit of time.


That’ll Work
XAU and BTC came up roses on both their default settings and even better when tweaked a bit. EUR and SPX500 were a bit soft but as you know, different markets have their own moves and grooves so what may work better for one, doesn’t necessarily work for another…unless it does!
Resources
Now go grab this slightly older indicator and see how it does for you in your testing environment, by downloading it from our on-line library, HERE. It’ll have the word, “NEW” in red next to the name to help you find it. Be sure you’re subscribed to the Stonehill Forex YouTube channel to watch the technical analysis portion of this week’s installment. Get your trading to the next level by signing up for the Advanced NNFX Course , HERE.
Our only goal is to make you a better trader.
*Our published testing results are based on money management strategies employed by the NNFX system and depend on varying external factors, which may be different between individuals and their specific broker conditions. No guarantee, trading recommendations, or other market suggestions are implied. Your results and subsequent trading activities are solely your own responsibility.
BTW — Any information communicated by Stonehill Forex Limited is solely for educational purposes. The information contained within the courses and on the website neither constitutes investment advice nor a general recommendation on investments. It is not intended to be and should not be interpreted as investment advice or a general recommendation on investment. Any person who places trades, orders or makes other types of trades and investments etc. is responsible for their own investment decisions and does so at their own risk. It is recommended that any person taking investment decisions consults with an independent financial advisor. Stonehill Forex Limited training courses and blogs are for educational purposes only, not a financial advisory service, and does not give financial advice or make general recommendations on investment.