The Roof…The Roof
We had a flashback to that old ‘84 song about a burning roof…so of course, there was a lot of humming while working on this blog. Thankfully, this roof isn’t that roof and hopefully our guy Mr. Ehlers will provide yet again, another wonderfully sharp tool for the toolbox.

Versions
We found multiple versions across various platforms, so most of you out in traderland should be able to find one that suits your needs. Some have different coloring functions (which we’ll mention), but the version we’re using is relatively simple but will require a few small color changes for visibility purposes on our charts. Depending on the background color of your chart will determine if you need to make any changes.
Tracing Origins and Other Bits
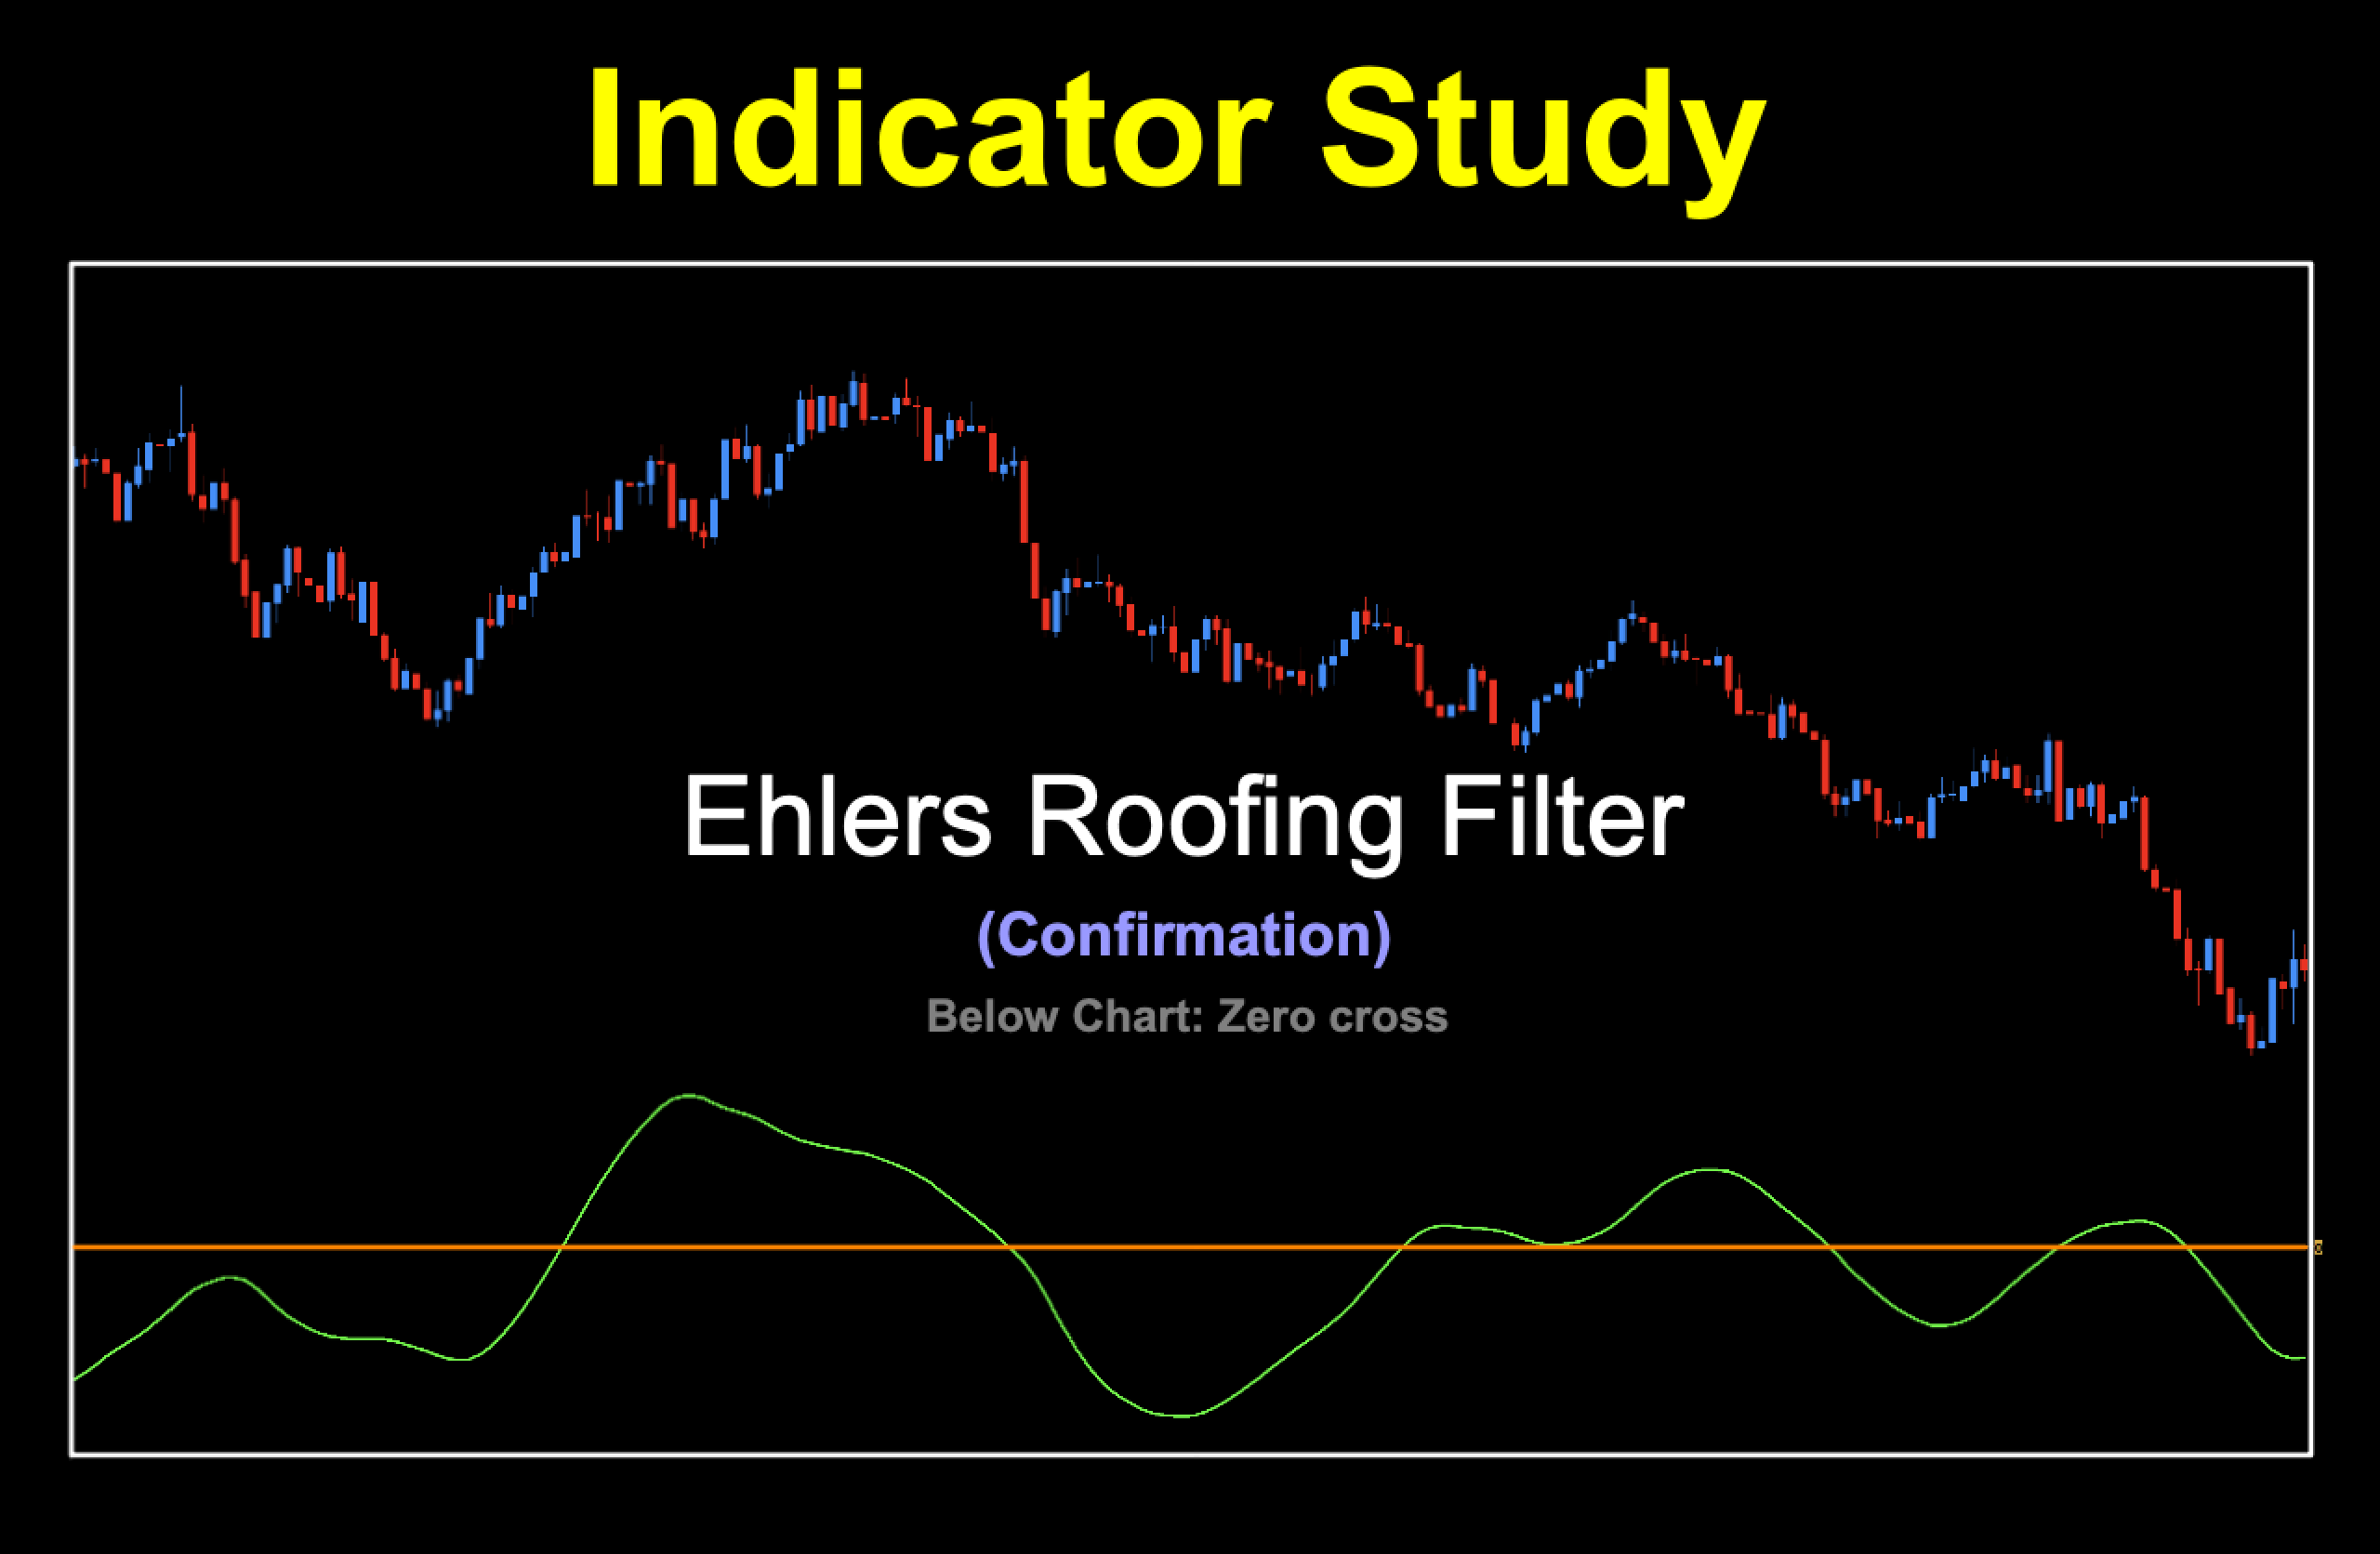
The concept of the “roofing filter” came to be in the 2013 book by John Ehlers called “Cycle Analytics for Traders”. The premise is that only data components between upper and lower periods are used. There are two internal filters which are combined to create a “two-pole” high pass filter. Essentially, the indicator attempts to identify the dominant cycle (or trend) which gives us the heads-up when to go long or short based on a faster filter signal line crossing over a slower signal line.
Take Two
If you read up on this indicator in other places, you’ll see some who propose using this as a two lines cross or as a zero cross. There are even articles suggesting using both styles concurrently, meaning you first look for the two lines cross, then look to see if it’s above or below the zero line. The issue with this is that by the time both happen, the trend has been in place for some time and the chance for a profitable trade may be long gone. We tested this indicator as a two lines cross and as a zero cross, and found that using the zero cross method produced better results.
Images
It wasn’t worth the effort to put up the default image as it’s very difficult to see one of the signal lines and the crossover arrow, so we made some changes. We’ll post both the default color settings and then what we changed them to for simplicity’s sake.
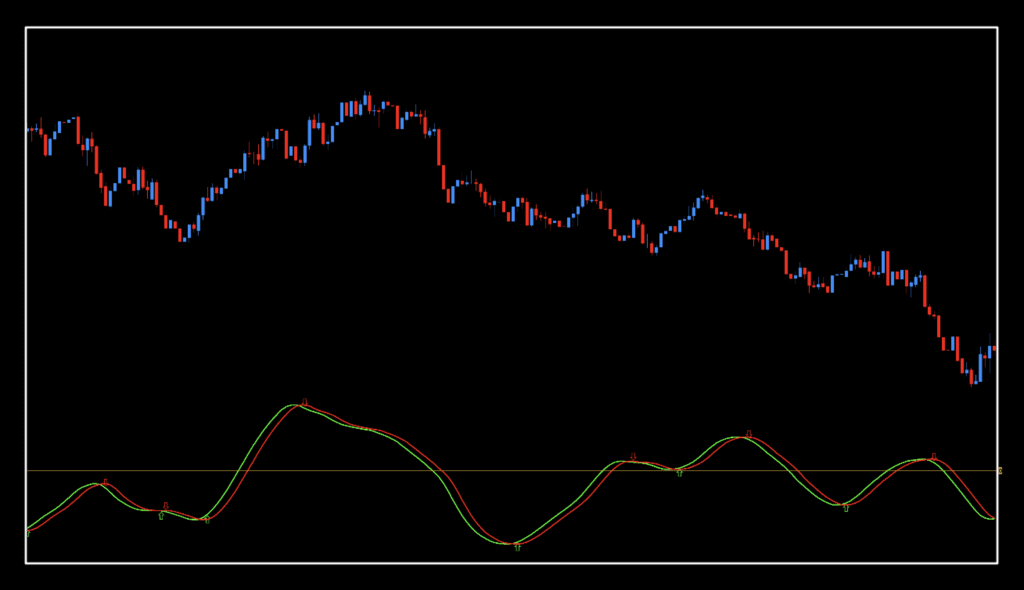
In the above image, you can see both the roofing filter line (green), the trigger line (red), and both up and down arrows. To get your chart looking like this, set the colors to the following…
However
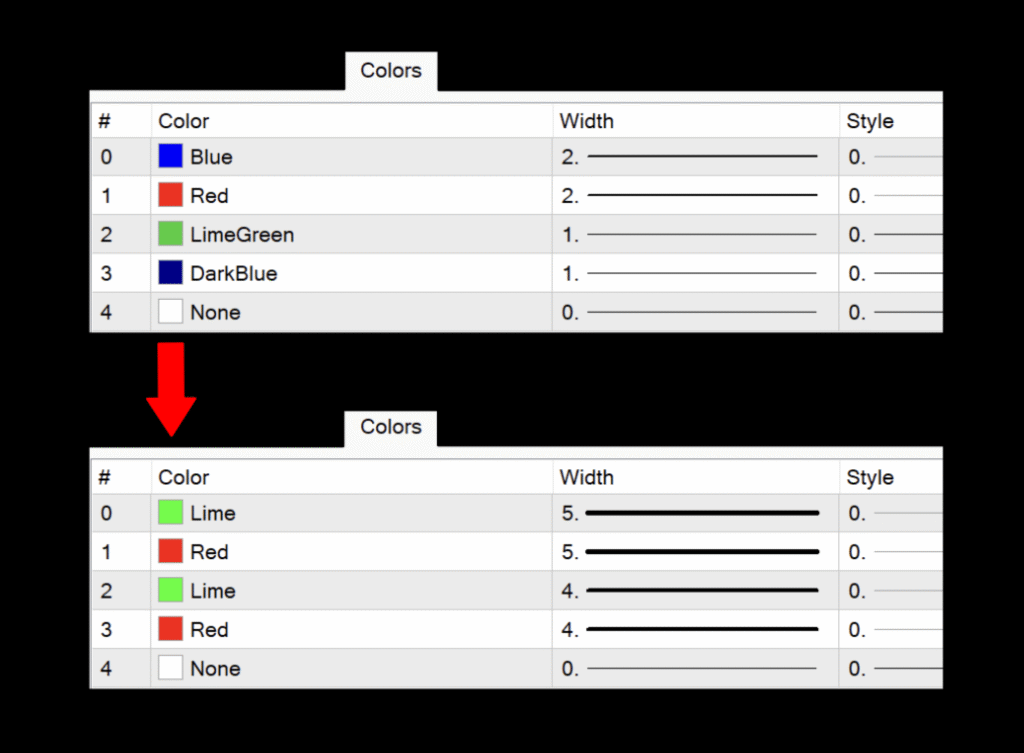
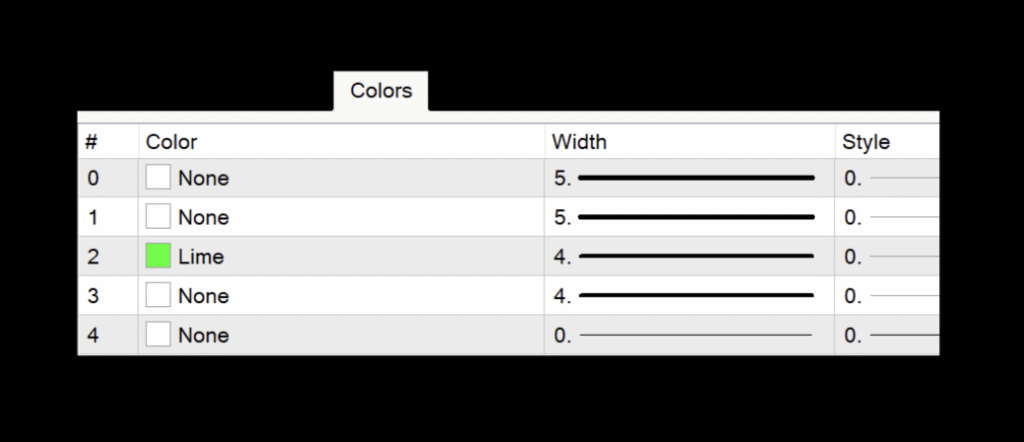
However, if you’re going to use just the roofing filter line like we did for testing, then it should look like this.
And the color settings should look like this.
Settings
There are three indicators which can be changed. The third one was designated to control visualization properties, but it seemed to affect (minor) the results. By leaving it on the default setting, you’d be okay.
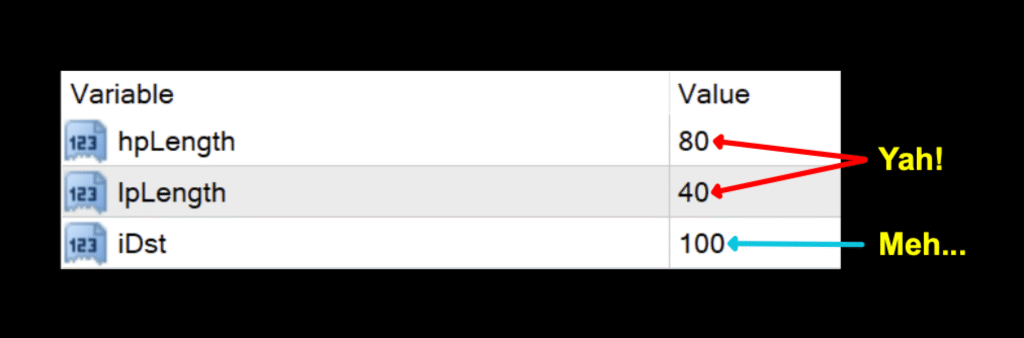
hpLength: The number of high pass periods used for the calculations. The default value is 80.
lpLength: The number of low pass periods used for the calculations. The default value is 40.
iDst: Affects the visualization of the indicator. You can just leave this on the default value of 100, if you choose. It doesn’t make much of a difference.
Daily Maintenance
Remember, once you’re ready to perform daily maintenance on your trades during the last 20–30 minutes of the trading day (1700 New York time), you’ll be presented with one of four options.
- Opening a trade.
- Closing a trade
- Maintaining a trade; i.e.
- Moving a stop loss level.
- Exiting a trade.
- Taking a pass (nothing to do).
Long: When the roofing filter signal line crosses above zero.
Short: When the roofing filter signal line crosses below zero.
Going For Signals
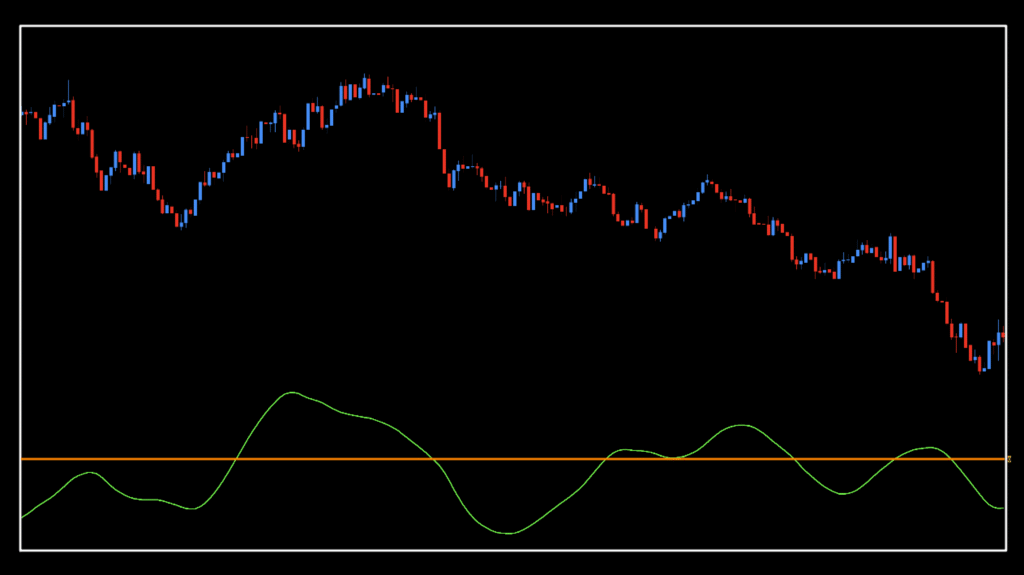
Below is the mark-up of the chart on the default settings, except we’ve made a few changes to the colors so we only see the roofing filter line. Unlike the two lines cross, using this as a zero cross identifies fewer signals and can be used as a C1 in your algorithm.
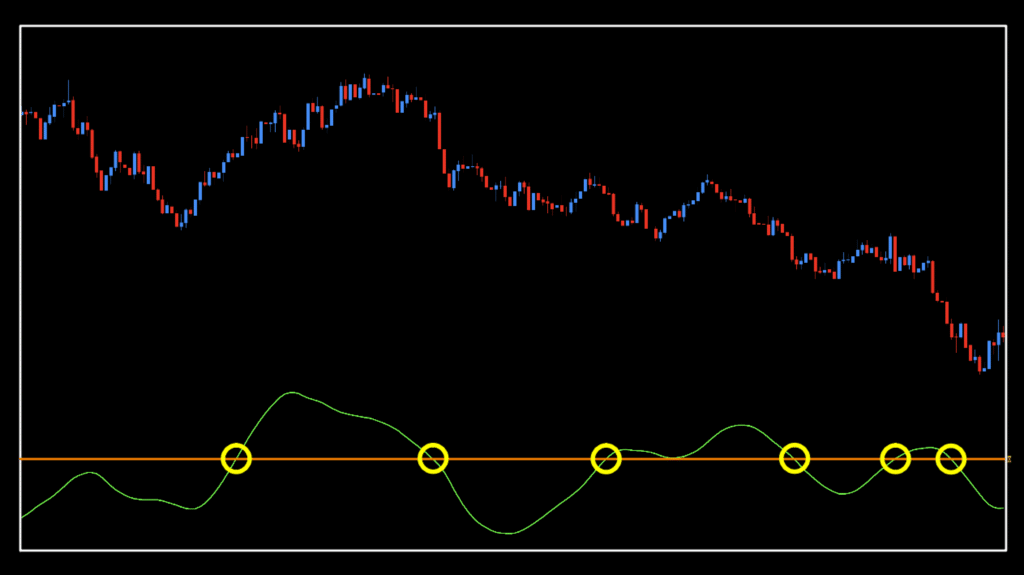
So, pretty standard look for a zero cross and certainly a lot different from a two lines cross. Ultimately, you can decide how you’d like to use this indicator, and some have even suggested using it as a zero cross for the entry and a two lines cross for the exit. We haven’t tested it like that, but it might make for a pretty cool project for those who are inclined to do so.
Testing For Soul
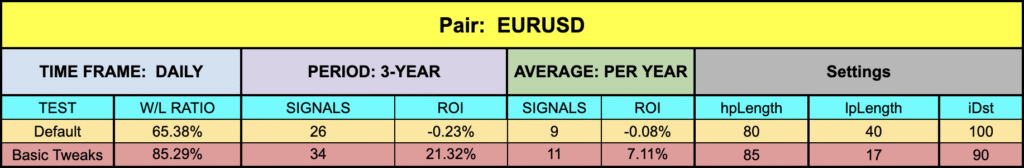
Below are the usual metrics we test for when profiling indicators. Have a gander and decide if you’d like to give it a whirl.

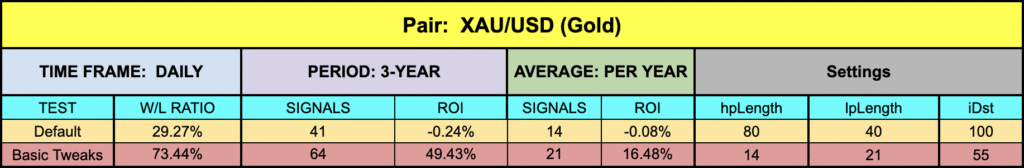
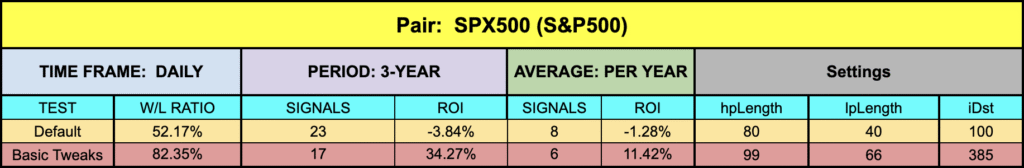
Ring The Bell
Nice results all around. Notice that all four of the default settings were in negative ROI territory, but with a little tweaking, we were able to find some nice combinations. XAU improved quite nicely on both ROI and W/L Ratio. Golden opportunity?
Resources
Go grab this fun little gem by our good friend Mr. Ehlers by downloading it from our on-line library, HERE. It’ll have the word, “NEW” in red next to the name to help you find it. For the video portion of this week’s installment, be sure to check out the technical analysis video on the Stonehill Forex YouTube channel. Get your trading to the next level by signing up for the Advanced NNFX Course, HERE.
Our only goal is to make you a better trader.
*Our published testing results are based on money management strategies employed by the NNFX system and depend on varying external factors, which may be different between individuals and their specific broker conditions. No guarantee, trading recommendations, or other market suggestions are implied. Your results and subsequent trading activities are solely your own responsibility.
BTW — Any information communicated by Stonehill Forex Limited is solely for educational purposes. The information contained within the courses and on the website neither constitutes investment advice nor a general recommendation on investments. It is not intended to be and should not be interpreted as investment advice or a general recommendation on investment. Any person who places trades, orders or makes other types of trades and investments etc. is responsible for their own investment decisions and does so at their own risk. It is recommended that any person taking investment decisions consults with an independent financial advisor. Stonehill Forex Limited training courses and blogs are for educational purposes only, not a financial advisory service, and does not give financial advice or make general recommendations on investment.