Cycle Analytics
Cycle analytics is a concept which finds itself in multiple fields from marketing, to software development, to business and even operational and human action environments. The over arching need for analyzing cycles is to identify repetitive patterns and distinguish areas for improvement.
So How Does That Affect Us?
By breaking down complex price action movements into measurable stages, cycle analytics helps identify choke points, improve efficiency, and make data-driven decisions easier for better outcomes. In a nutshell, this indicator works hard to provide signals where (hopefully) the best cycles can be identified and profited from.
Ya Done It Again
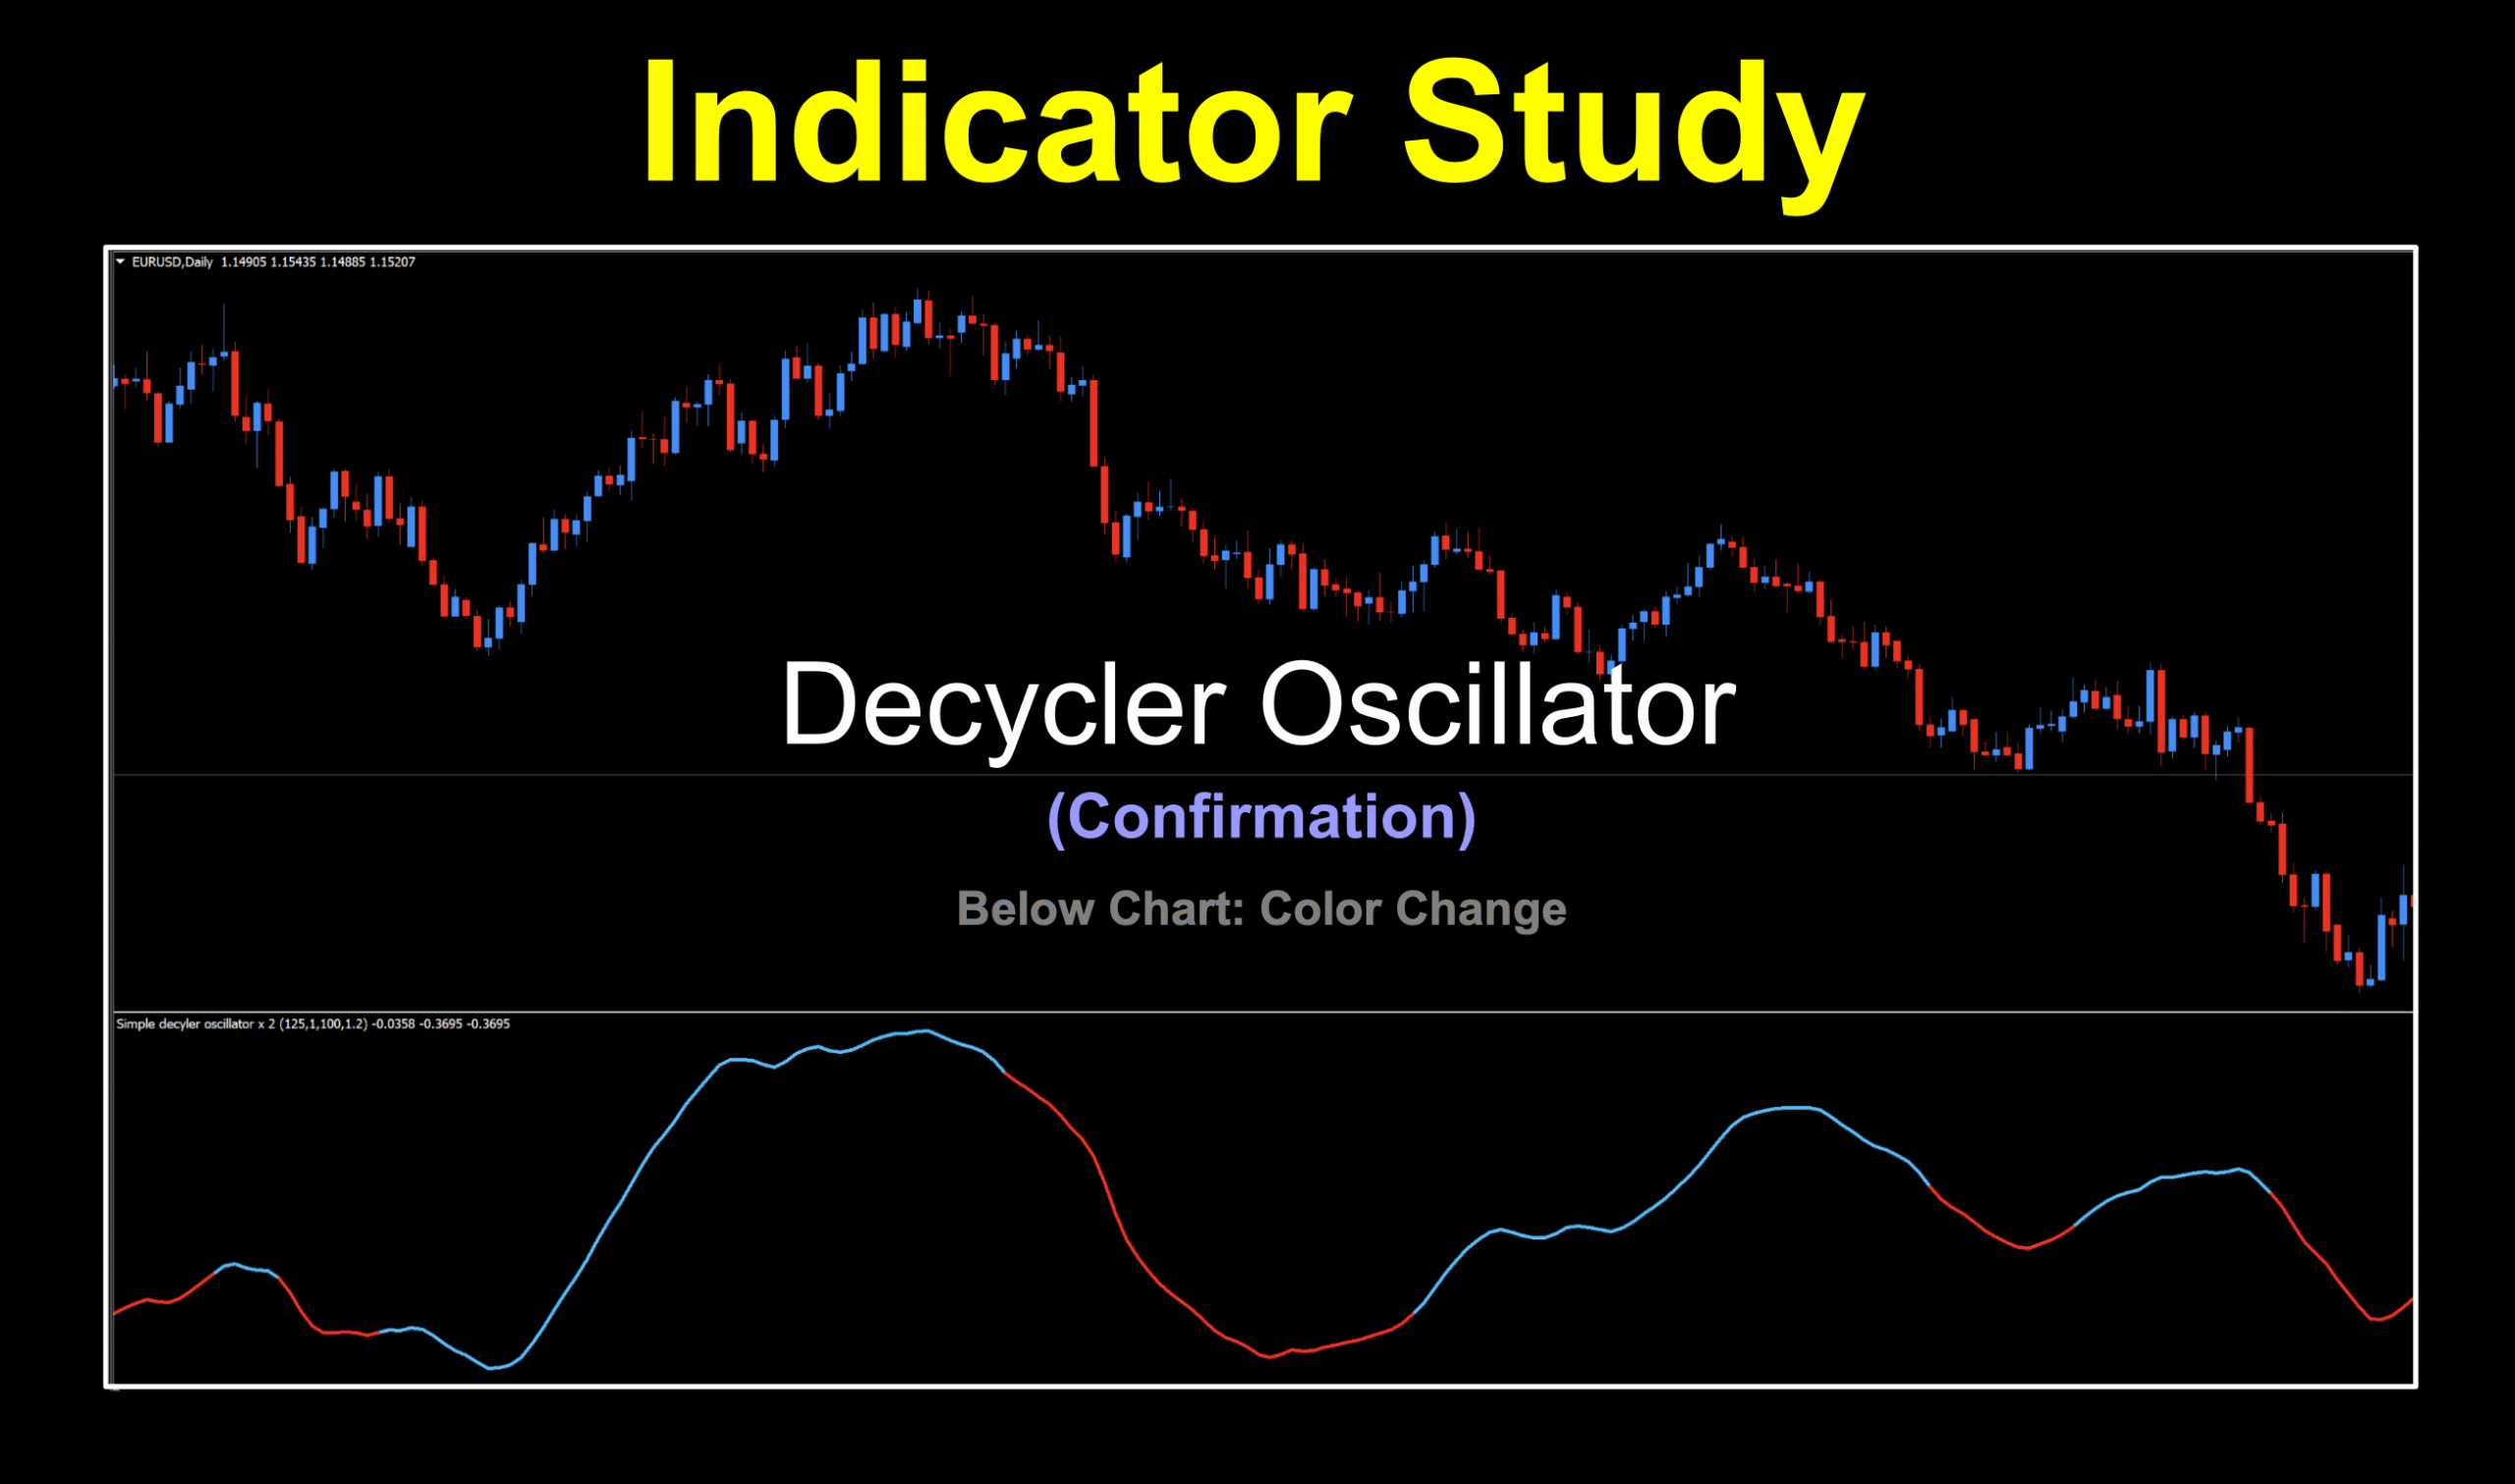
Mr. Ehlers, you old “so-and-so”, you’ve given us yet another sharp tool for our trader’s toolbox. We salute you, sir. For those technically inclined, you can read all about decycling in his book, “Cycle Analytics For Traders” published in 2013, which is the origin of the concept. The indicator we’re using is from the 2017 era. There are many versions of the Decycler Oscillator, which can be found using on-line searches. Some are two lines cross variety, zero cross and color change varieties, and there are those which include various filters to further smooth out signals. We’ll be looking at a color change version, although it too can be used in multiple ways, should you wish.
Zero Hero
We’ve come across indicators which are identified as, “zero-lag” in the past. This alerts us to the fact they don’t have the typical lag that many indicators are cursed with — usually anything that relies on moving averages. Naturally, a quick, reactive indicator is preferred (within reason) but as a note of caution, too quick, and it can create an overabundance of false signals. The premise behind the Decycler Oscillator is that market data can be considered as a reoccurrence of cycle periods (frequency) with different cycle amplitudes (height from midpoint). So, in effect;
Trending periods = segments of longer (low-frequency) cycles.

With A Purpose
The goals of the decycler are relatively simple;
Price Data Input — High-Pass Filter Output
By removing “high-frequency” components from price data and keeping the “low-frequency” components (which are the trends), the decycler kicks out those trends with little to no lag. Easy-peasy!
Original Packaging
We’ll take a look at the original optics of this indicator, point out a couple of things, then make a couple of changes to better visualize the signals. It’s not a big deal, trust us.
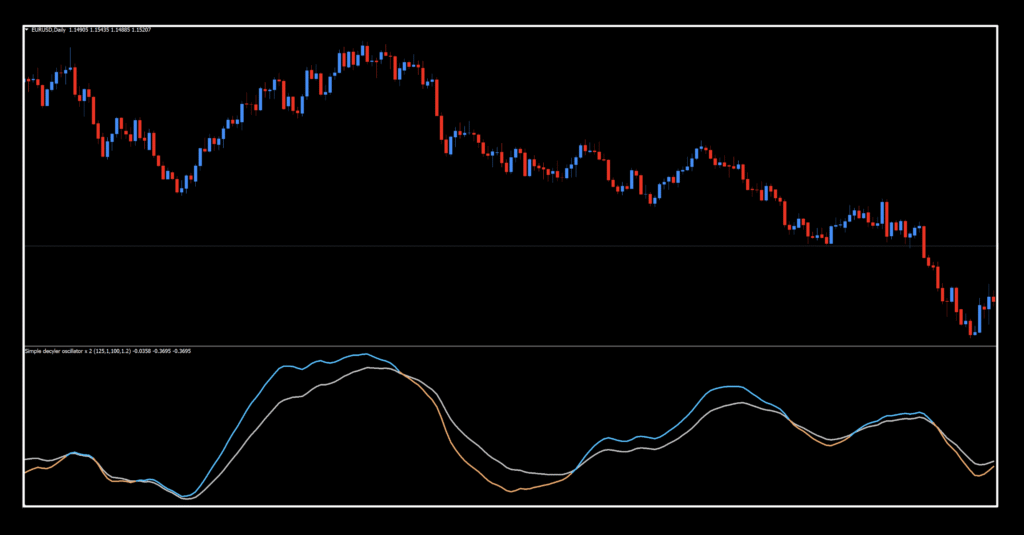
Is It GREY or GRAY
I suppose it depends on which side of the pond you live on, but whether you spell it “grey” or “gray”, we’re going to get rid of that monochromatic line. It just lends confusion to where the signals are happening. If you look closely, it denotes where longs become shorts and the other way around, as illustrated in the image below.
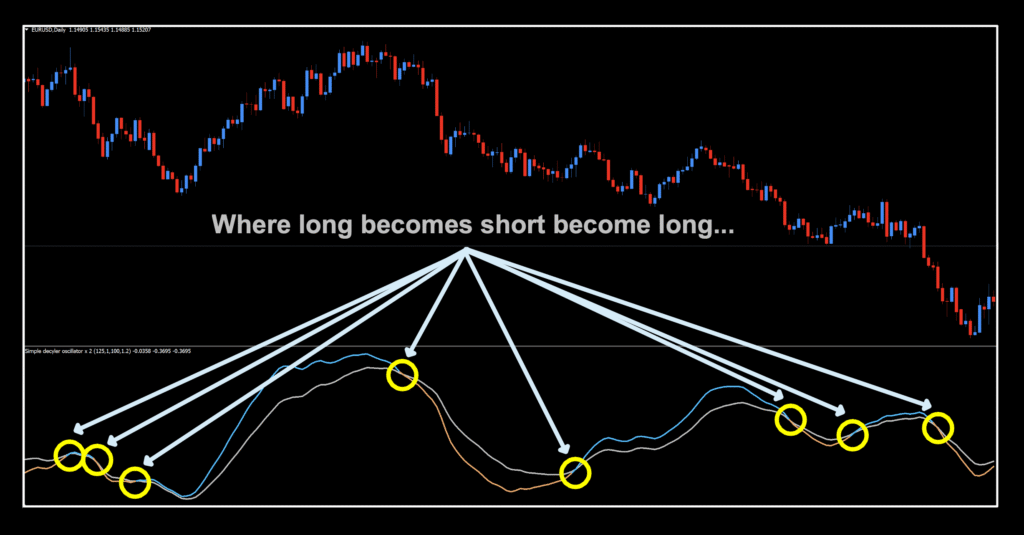
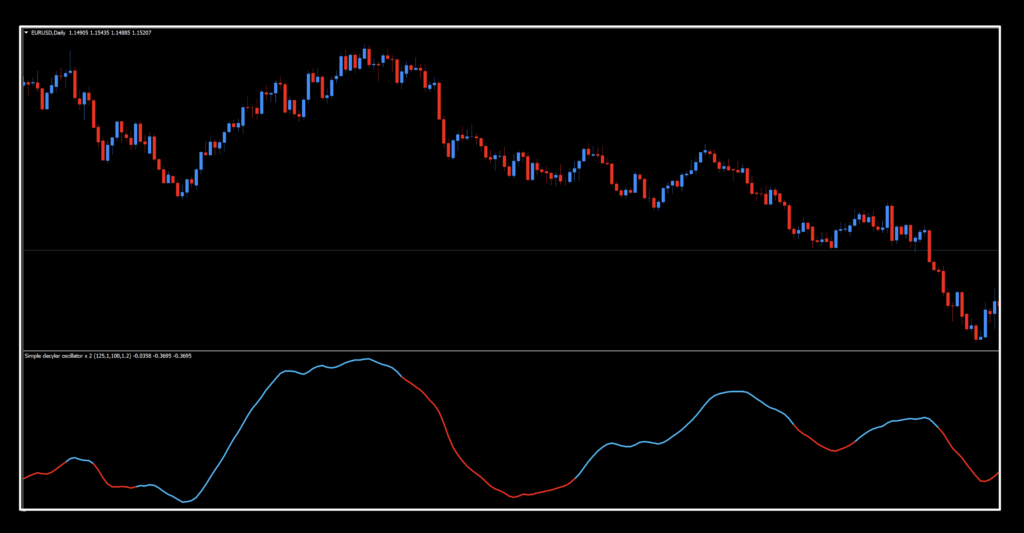
So, if we just make that line goes away, then it looks so much cleaner and the signals just pop right out. Of course, you can change the colors to whatever your heart desires. I used to use green and red, but for whatever reason, I started using blue instead of red. Maybe it was just easier on the eyes when looking at my screens in the dark.
Settings
There are a literal handful of variables in the settings menu. All of them are used and the last one, “Price”, we’ll take a closer look at.
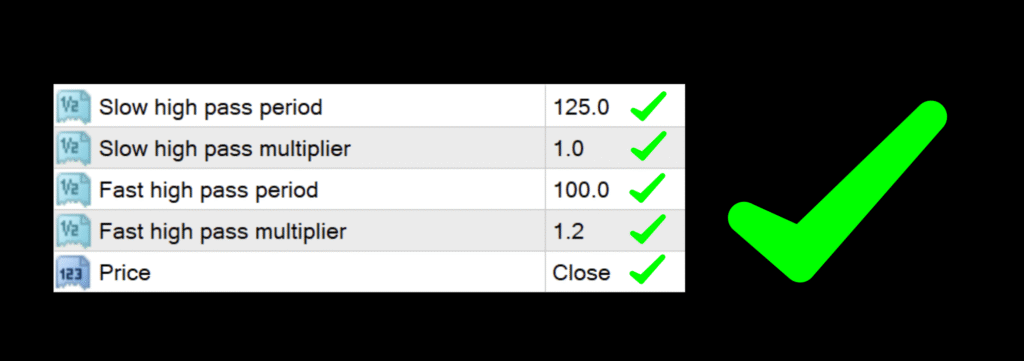
Slow high pass period: Defines the number of periods used in the slow filter. Default setting is 125.
Slow high pass multiplier: Acts as a multiplier for the Slow High Pass Period. Default setting is 1.0.
Fast high pass period: Defines the number of periods used in the fast filter. Default setting is 100.
Fat high pass period: Acts as a multiplier for the Fast High Pass Period. Default setting is 1.2.
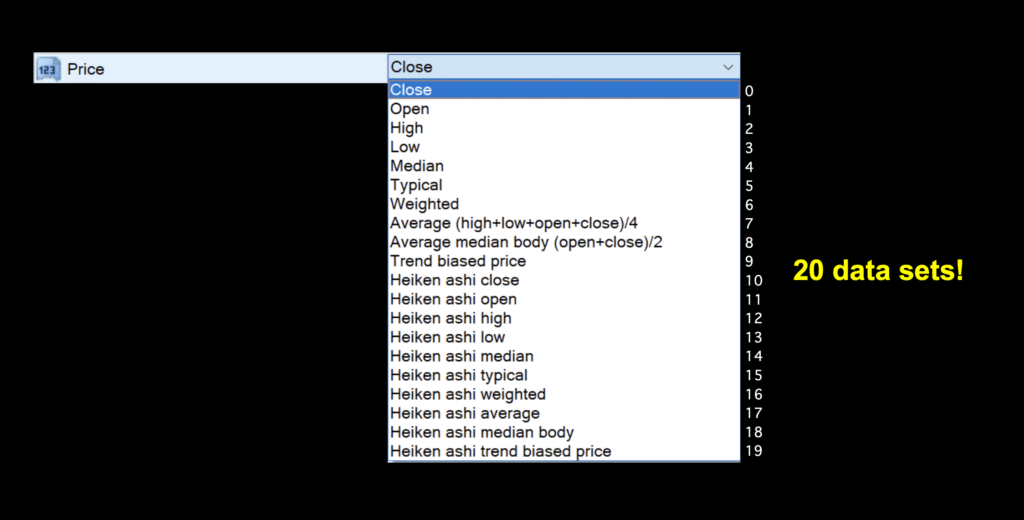
Price to use: The indicator uses specific price data sets from a list of choices, as noted in the image below. The default value is “0”, or Close.
Daily Maintenance
Remember, once you’re ready to perform daily maintenance on your trades during the last 20–30 minutes of the trading day (1700 New York time), you’ll be presented with one of four options.
- Opening a trade.
- Closing a trade
- Maintaining a trade; i.e.
- Moving a stop loss level.
- Exiting a trade.
- Taking a pass (nothing to do).
Take It Easy
As we mentioned, there are a few ways you can use this indicator and depending on which version you have, there are even more choices. Since we’re just profiling one version, we’re going to stick with the color change.
Long: When the signal line turns from red to blue.
Short: When the signal line turns from blue to red.
One For The Gipper
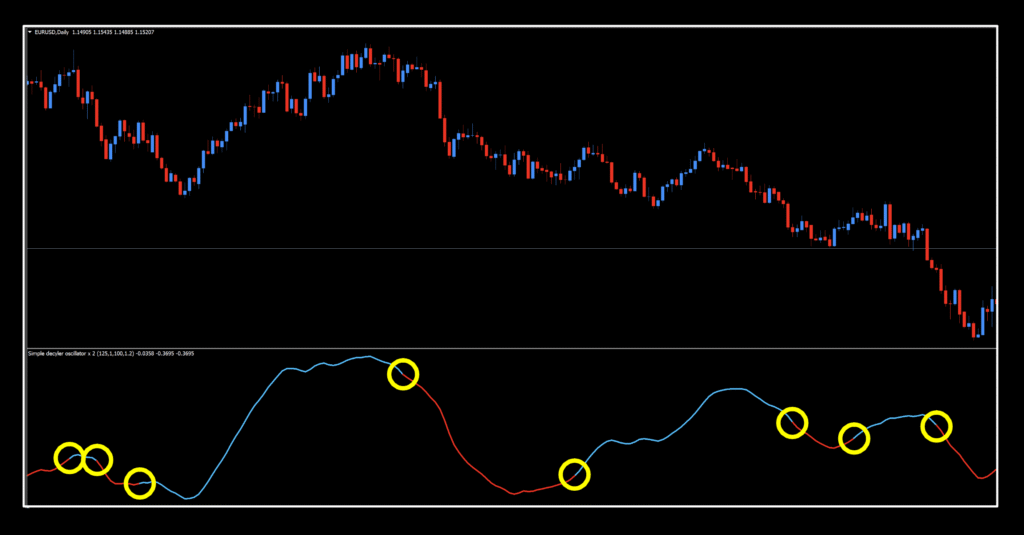
It’s a lovely mark up, with those signals just as obvious as you please. Keep in mind that the default periods are extremely slow, so while it does identify the overall trends, we believe it should probably get a makeover in the settings department. However, that is totally your call. Hint, note the tweaked period values in the testing data.
Test Envy
If you’ve forgotten how we test, or want to learn what we test for, check out the Cross Roads indicator study, which has all the information you need. Just click, HERE. We delve into all the fun and interesting points for your reading pleasure.
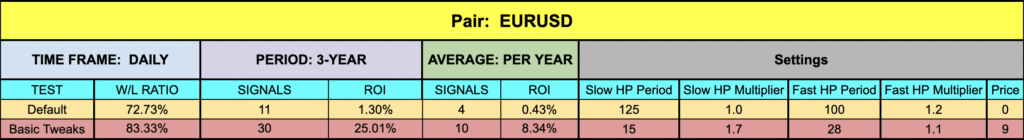
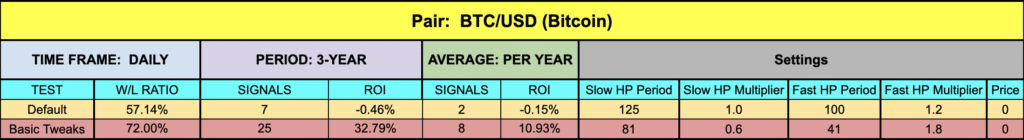
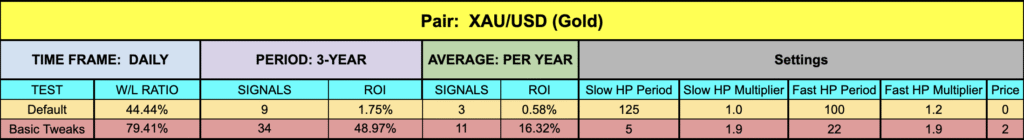

Chicken Dinner

The first thing that kind of slaps you in the face is the number of trades. In all instances, tweaking the settings dramatically increased that metric, meaning more opportunities to line your pockets. Second, the ROI percentage was also improved upon, so there’s that to rejoice. And lastly, the Win/Loss percentage totally kicks butt. What more can we say? That’s definitely a winner in our book.
Resources
This little dandy can be yours for free by downloading it from our on-line library, found, HERE. It’ll have the word, “NEW” in red next to the name to help you find it. And for all the audio and visual excitement you can stand, subscribe to the Stonehill Forex YouTube channel for the technical analysis videos, among other vids. If you need to get things to the next level, consider signing up for the Advanced NNFX Course, HERE.
Our only goal is to make you a better trader.
*Our published testing results are based on money management strategies employed by the NNFX system and depend on varying external factors, which may be different between individuals and their specific broker conditions. No guarantee, trading recommendations, or other market suggestions are implied. Your results and subsequent trading activities are solely your own responsibility.
BTW — Any information communicated by Stonehill Forex Limited is solely for educational purposes. The information contained within the courses and on the website neither constitutes investment advice nor a general recommendation on investments. It is not intended to be and should not be interpreted as investment advice or a general recommendation on investment. Any person who places trades, orders or makes other types of trades and investments etc. is responsible for their own investment decisions and does so at their own risk. It is recommended that any person taking investment decisions consults with an independent financial advisor. Stonehill Forex Limited training courses and blogs are for educational purposes only, not a financial advisory service, and does not give financial advice or make general recommendations on investment.