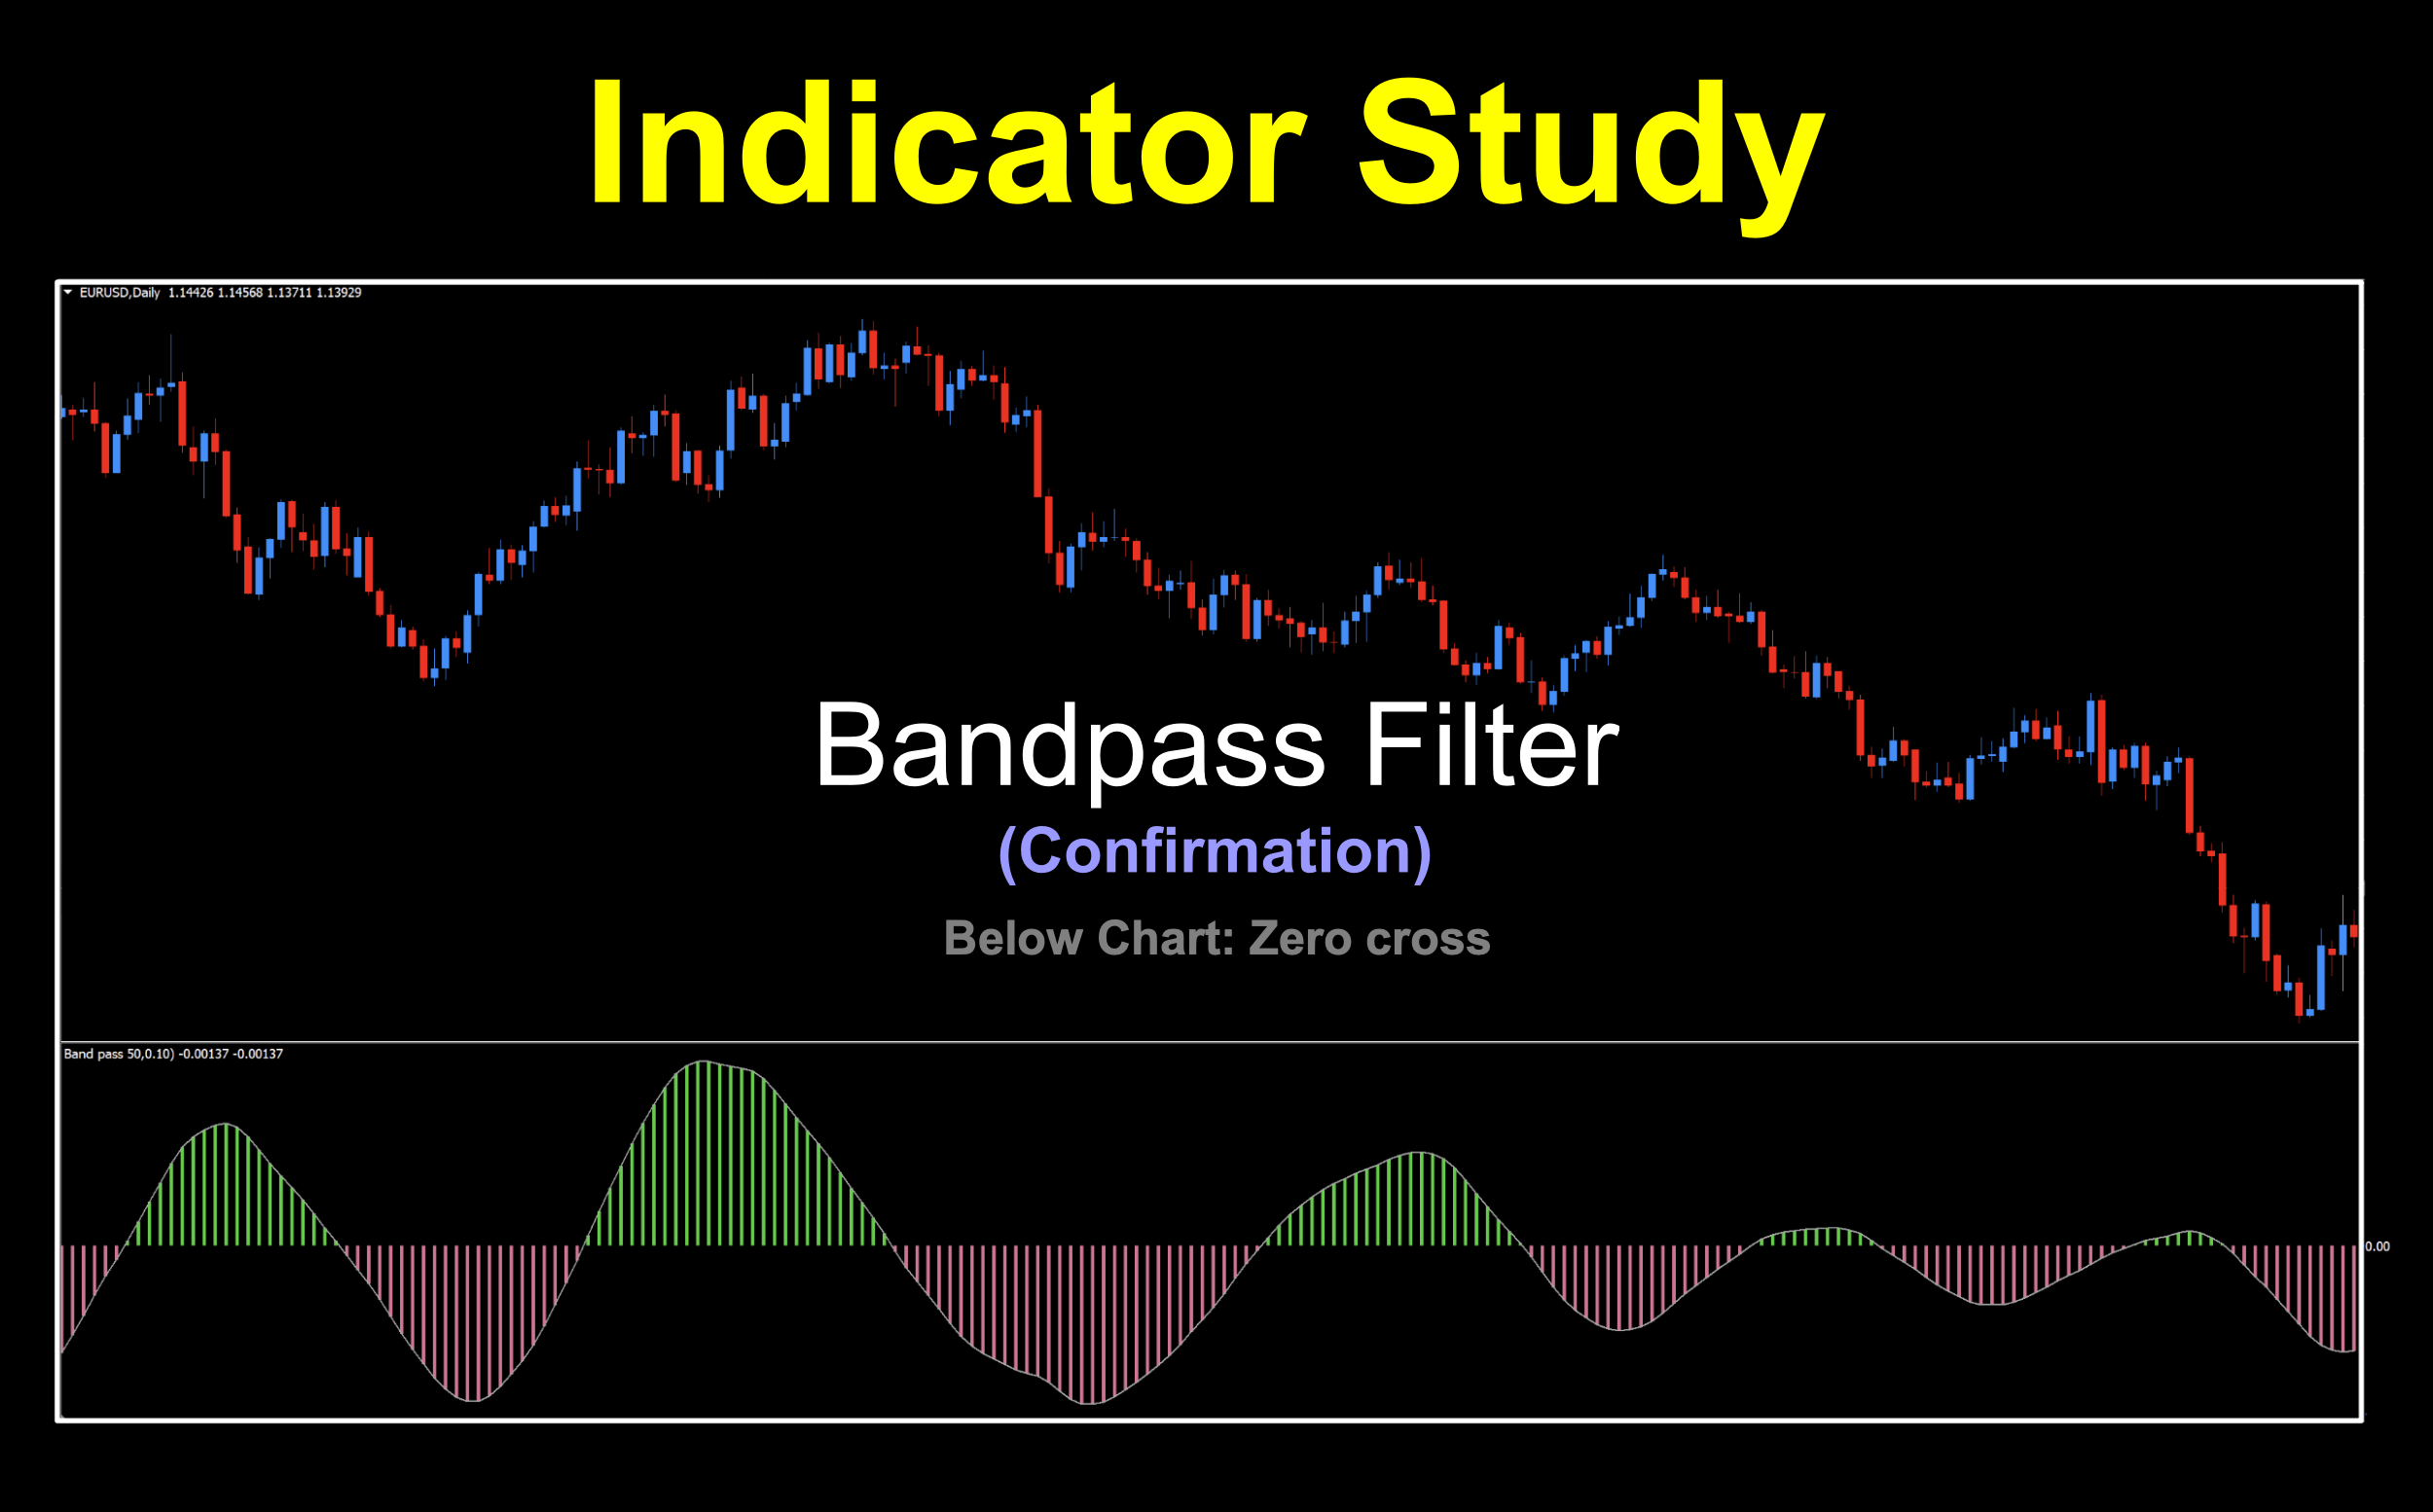
Band On The Run
Our profile series is always searching for the “Unusual”, among other descriptors. “Performance”, “Accuracy”, and “Effective” also come to mind. This one is no different. That being said, we stumbled across a delightful indicator which utilizes some high level math functions affecting how trading signals are processed. And from the name, who can guess what else it has in it? Tip…we’ll be looking into that soon enough.
Direction
As we all know, price can only move in three directions, up, down…and sideways (although that is questionable). So, in essence, these movements create cycles, or waves. Indicators act similarly by displaying waves or printing signals dependent on internal waves by way of calculations. Either way, it’s those waves which we look for, especially sustained profit generating monsters.
We Know Him
A guy we know, and probably many of you too by now, developed this bit of logic. He goes by the name; John Ehlers. Remember him? He’s responsible for a couple of handfuls worth of indicators in our profile series. This one came out of a 2008 paper titled, “Empirical Mode Decomposition”. The indicator was coded in 2019 (MT4) and was originally a TradingView indicator before it migrated over to MetaTrader. So TV chartist, you may be in luck with this one based on a simple Google search.
Isolation
The attempts to isolate certain frequency components out of the price data it encounters. It is further assisted by filtering it through something called the Fourier Series. This converts the data into waveshapes, which for us creates a visual representation to identify signals — something we’ll gander at below. As in other “filtering” indicators, the aim is to reject undesirable market static and eliminate false signals.
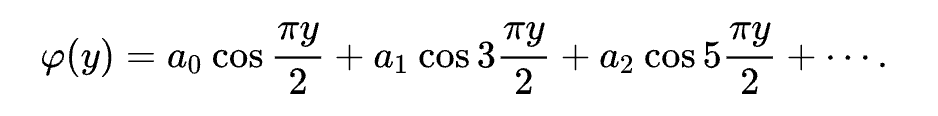
Fourier Series
We couldn’t let things go without mentioning a bit of the magic that happens inside the box. In simple terms (we like simple), the Fourier Series is a formidable tool that breaks down complex data into components we can use to create a sine wave.
Sine Waves, Yo!
We’ll be taking a closer look at the sine wave because there features which you need to be aware of.
OG
The origin of the series comes from a brilliant French mathematician named Jean-Baptiste Joseph Fourier who published his findings in the early 19th century (1807). Since then, an innumerable amount of variations, expansion, and deviations have been published to assist us in numerous aspects of our physical world. Totally rad.
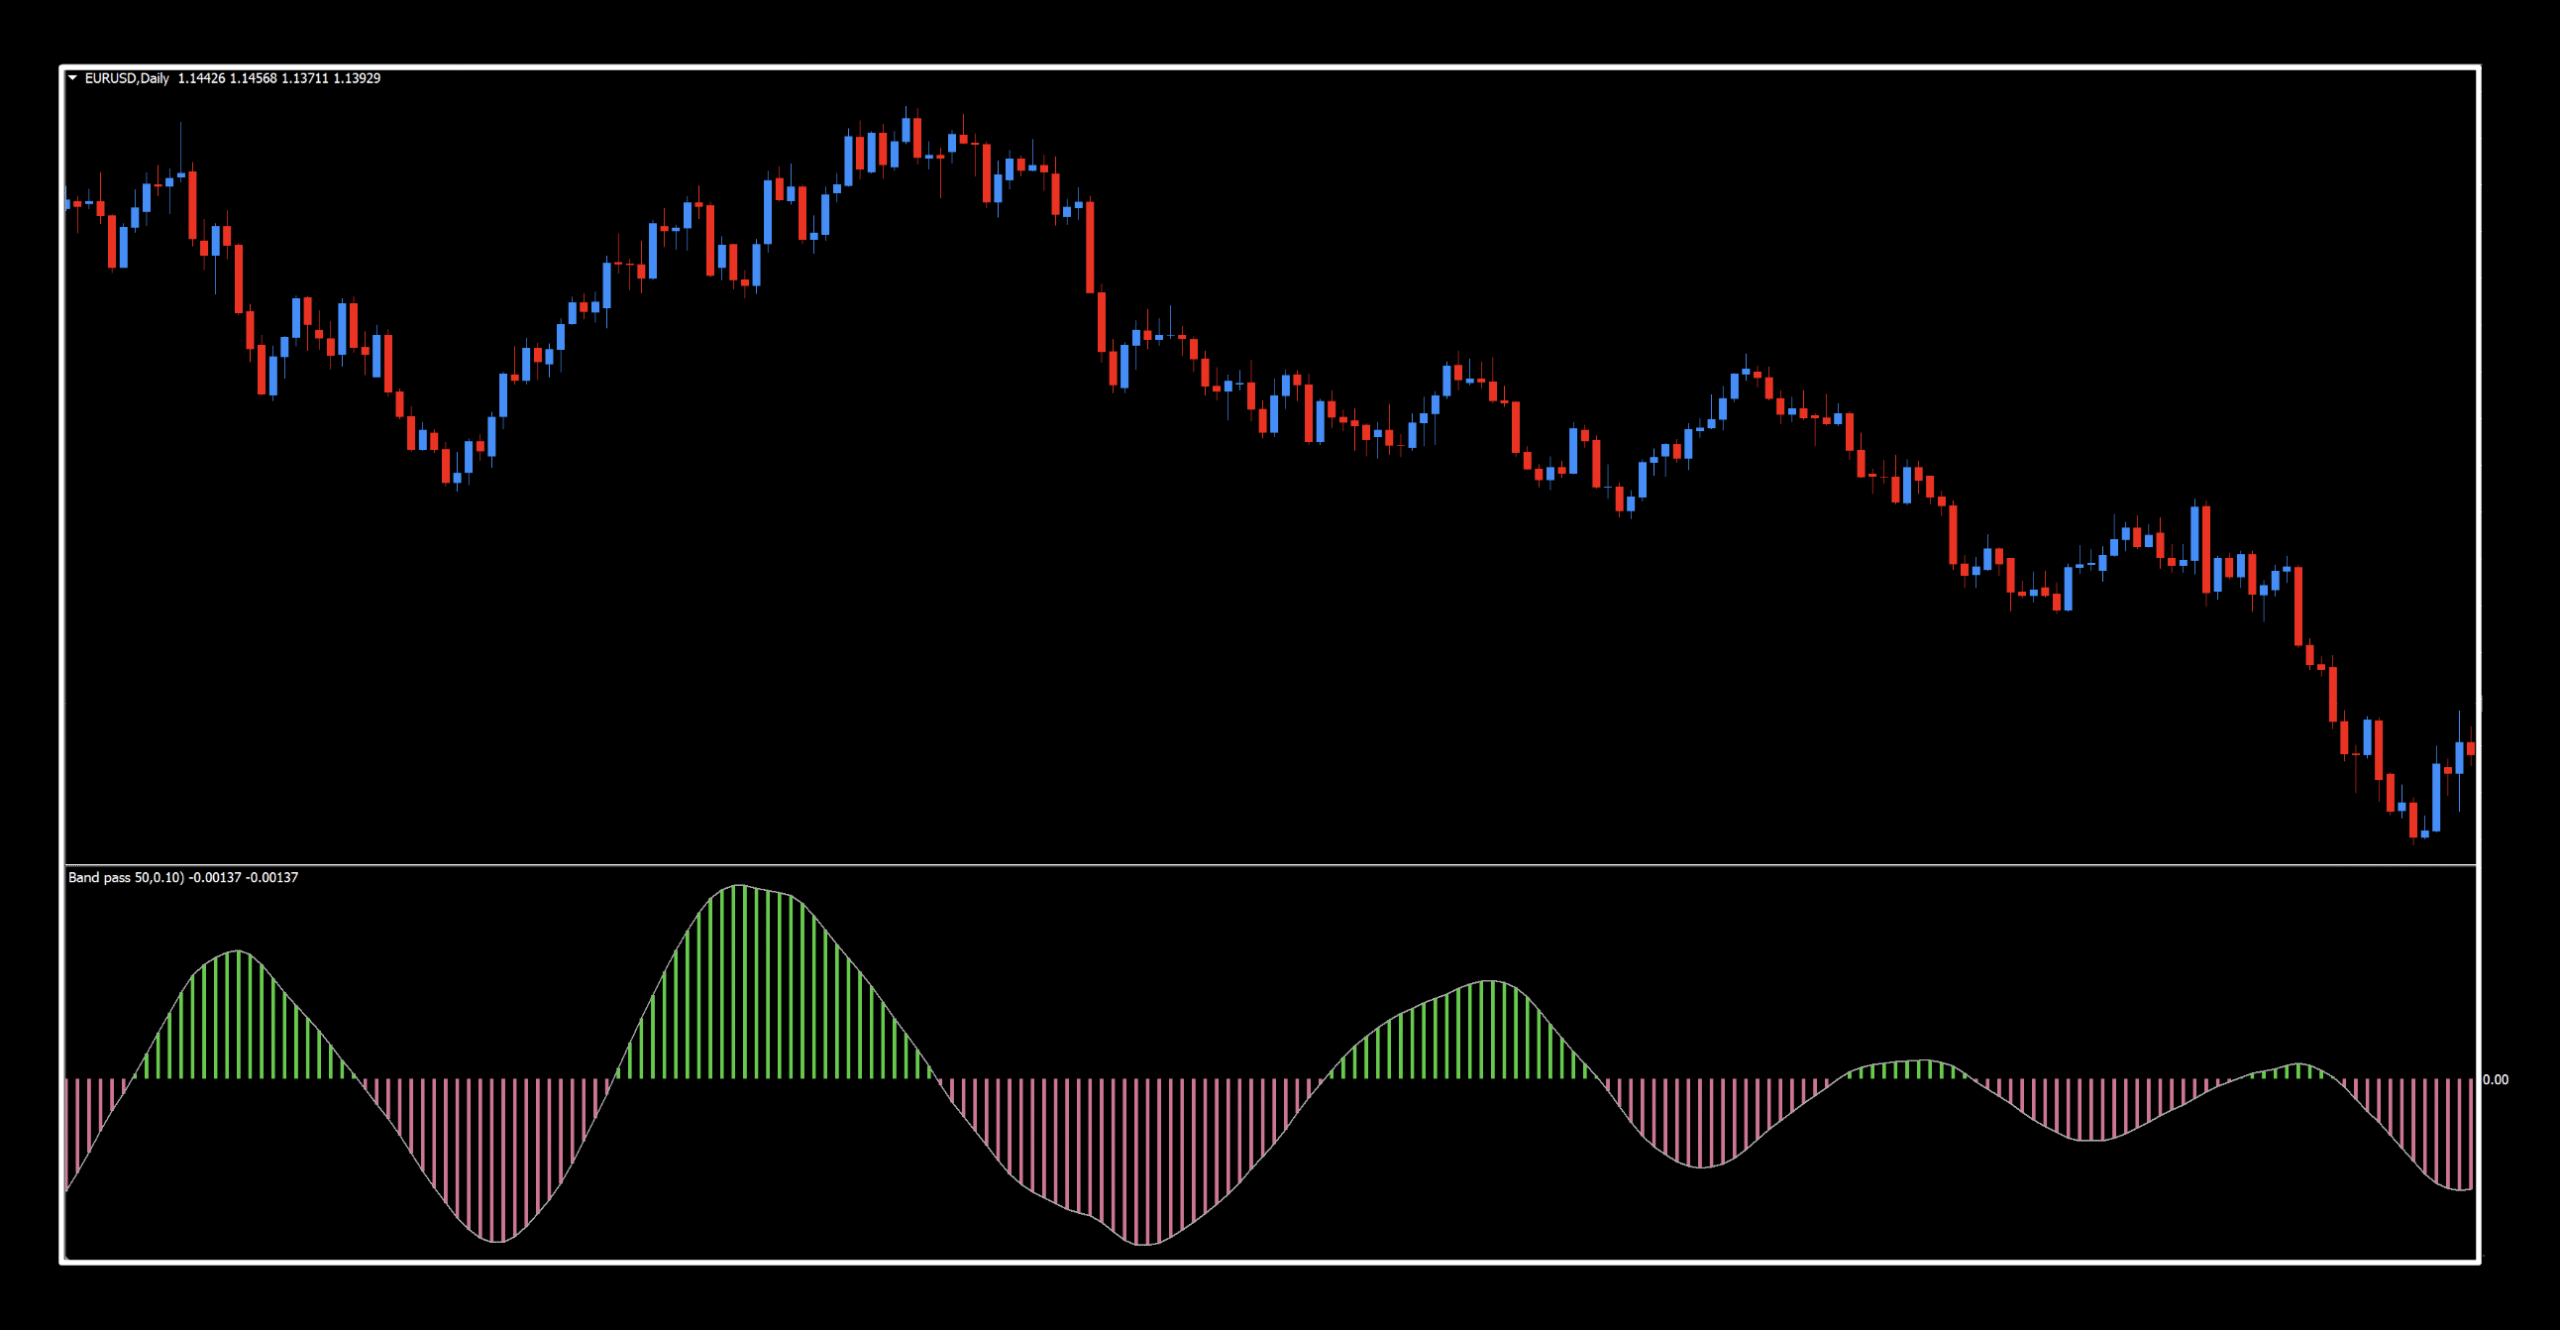
Hang Ten
We’ve got the default chart below in all its glory. Notice how smooth things are against ragged price action. That’s the magic working hard in our interests.
Settings
In this indicator, we’ve got three variables to contend with, but the second choice presents us with some serious abilities in the testing field. We’ll explore those shortly.
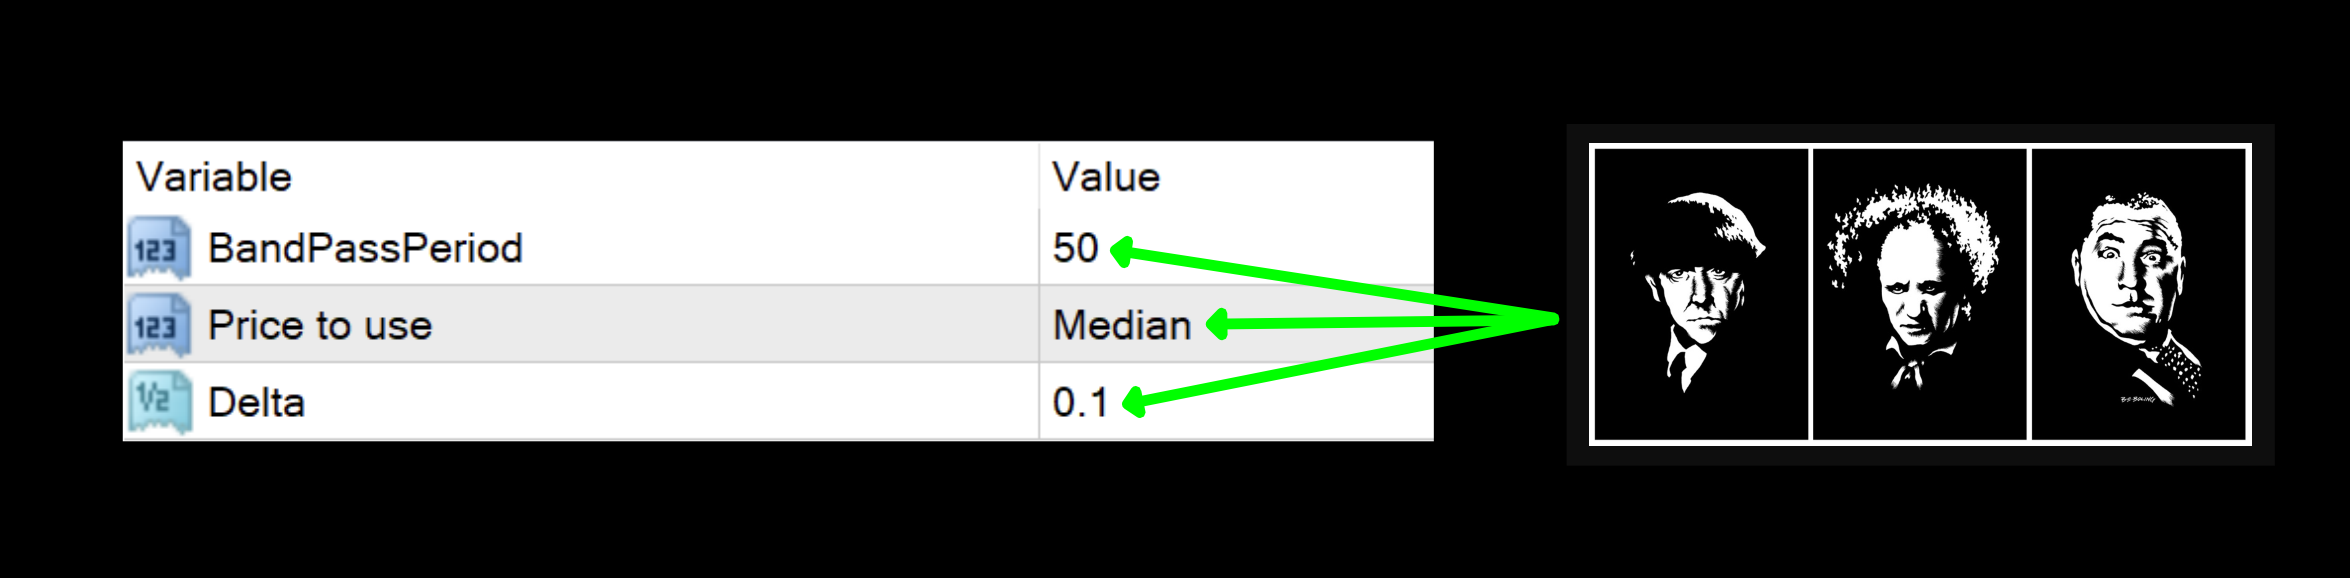
BandPassPeriod: This setting specifies the number of periods the filter will pass though, centered at the default value of 50.
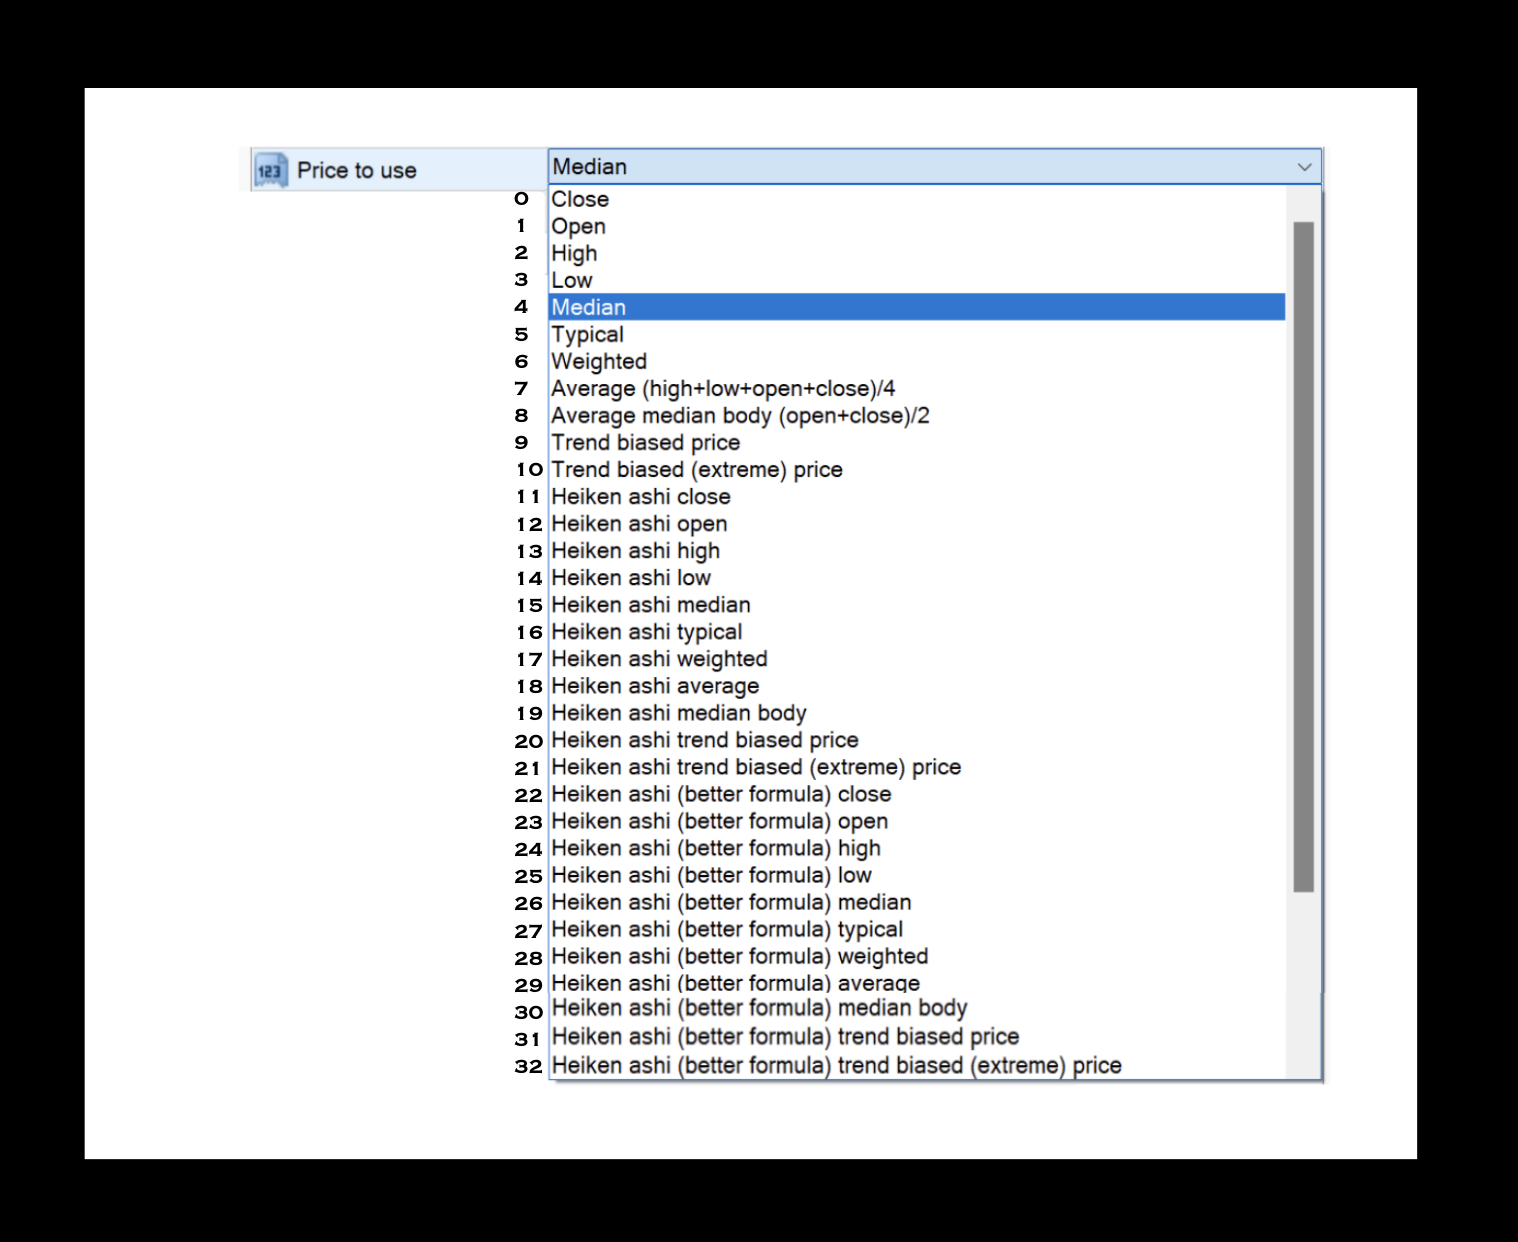
Price to use: The indicator pulls price data from different specified “sets” depending on how they’re calculated. This indicator has a very large catalog of available price data, as noted in the table below. We just used the listing number in our testing to keep things simple. The default value is “4”, or Median price.
Delta: The approximate half-bandwidth of the filter. The default setting is 0.1.
Daily Maintenance
Remember, once you’re ready to perform daily maintenance on your trades during the last 20–30 minutes of the trading day (1700 New York time), you’ll be presented with one of four options.
- Opening a trade.
- Closing a trade
- Maintaining a trade; i.e.
- Moving a stop loss level.
- Exiting a trade.
- Taking a pass (nothing to do).
Keep It Simple
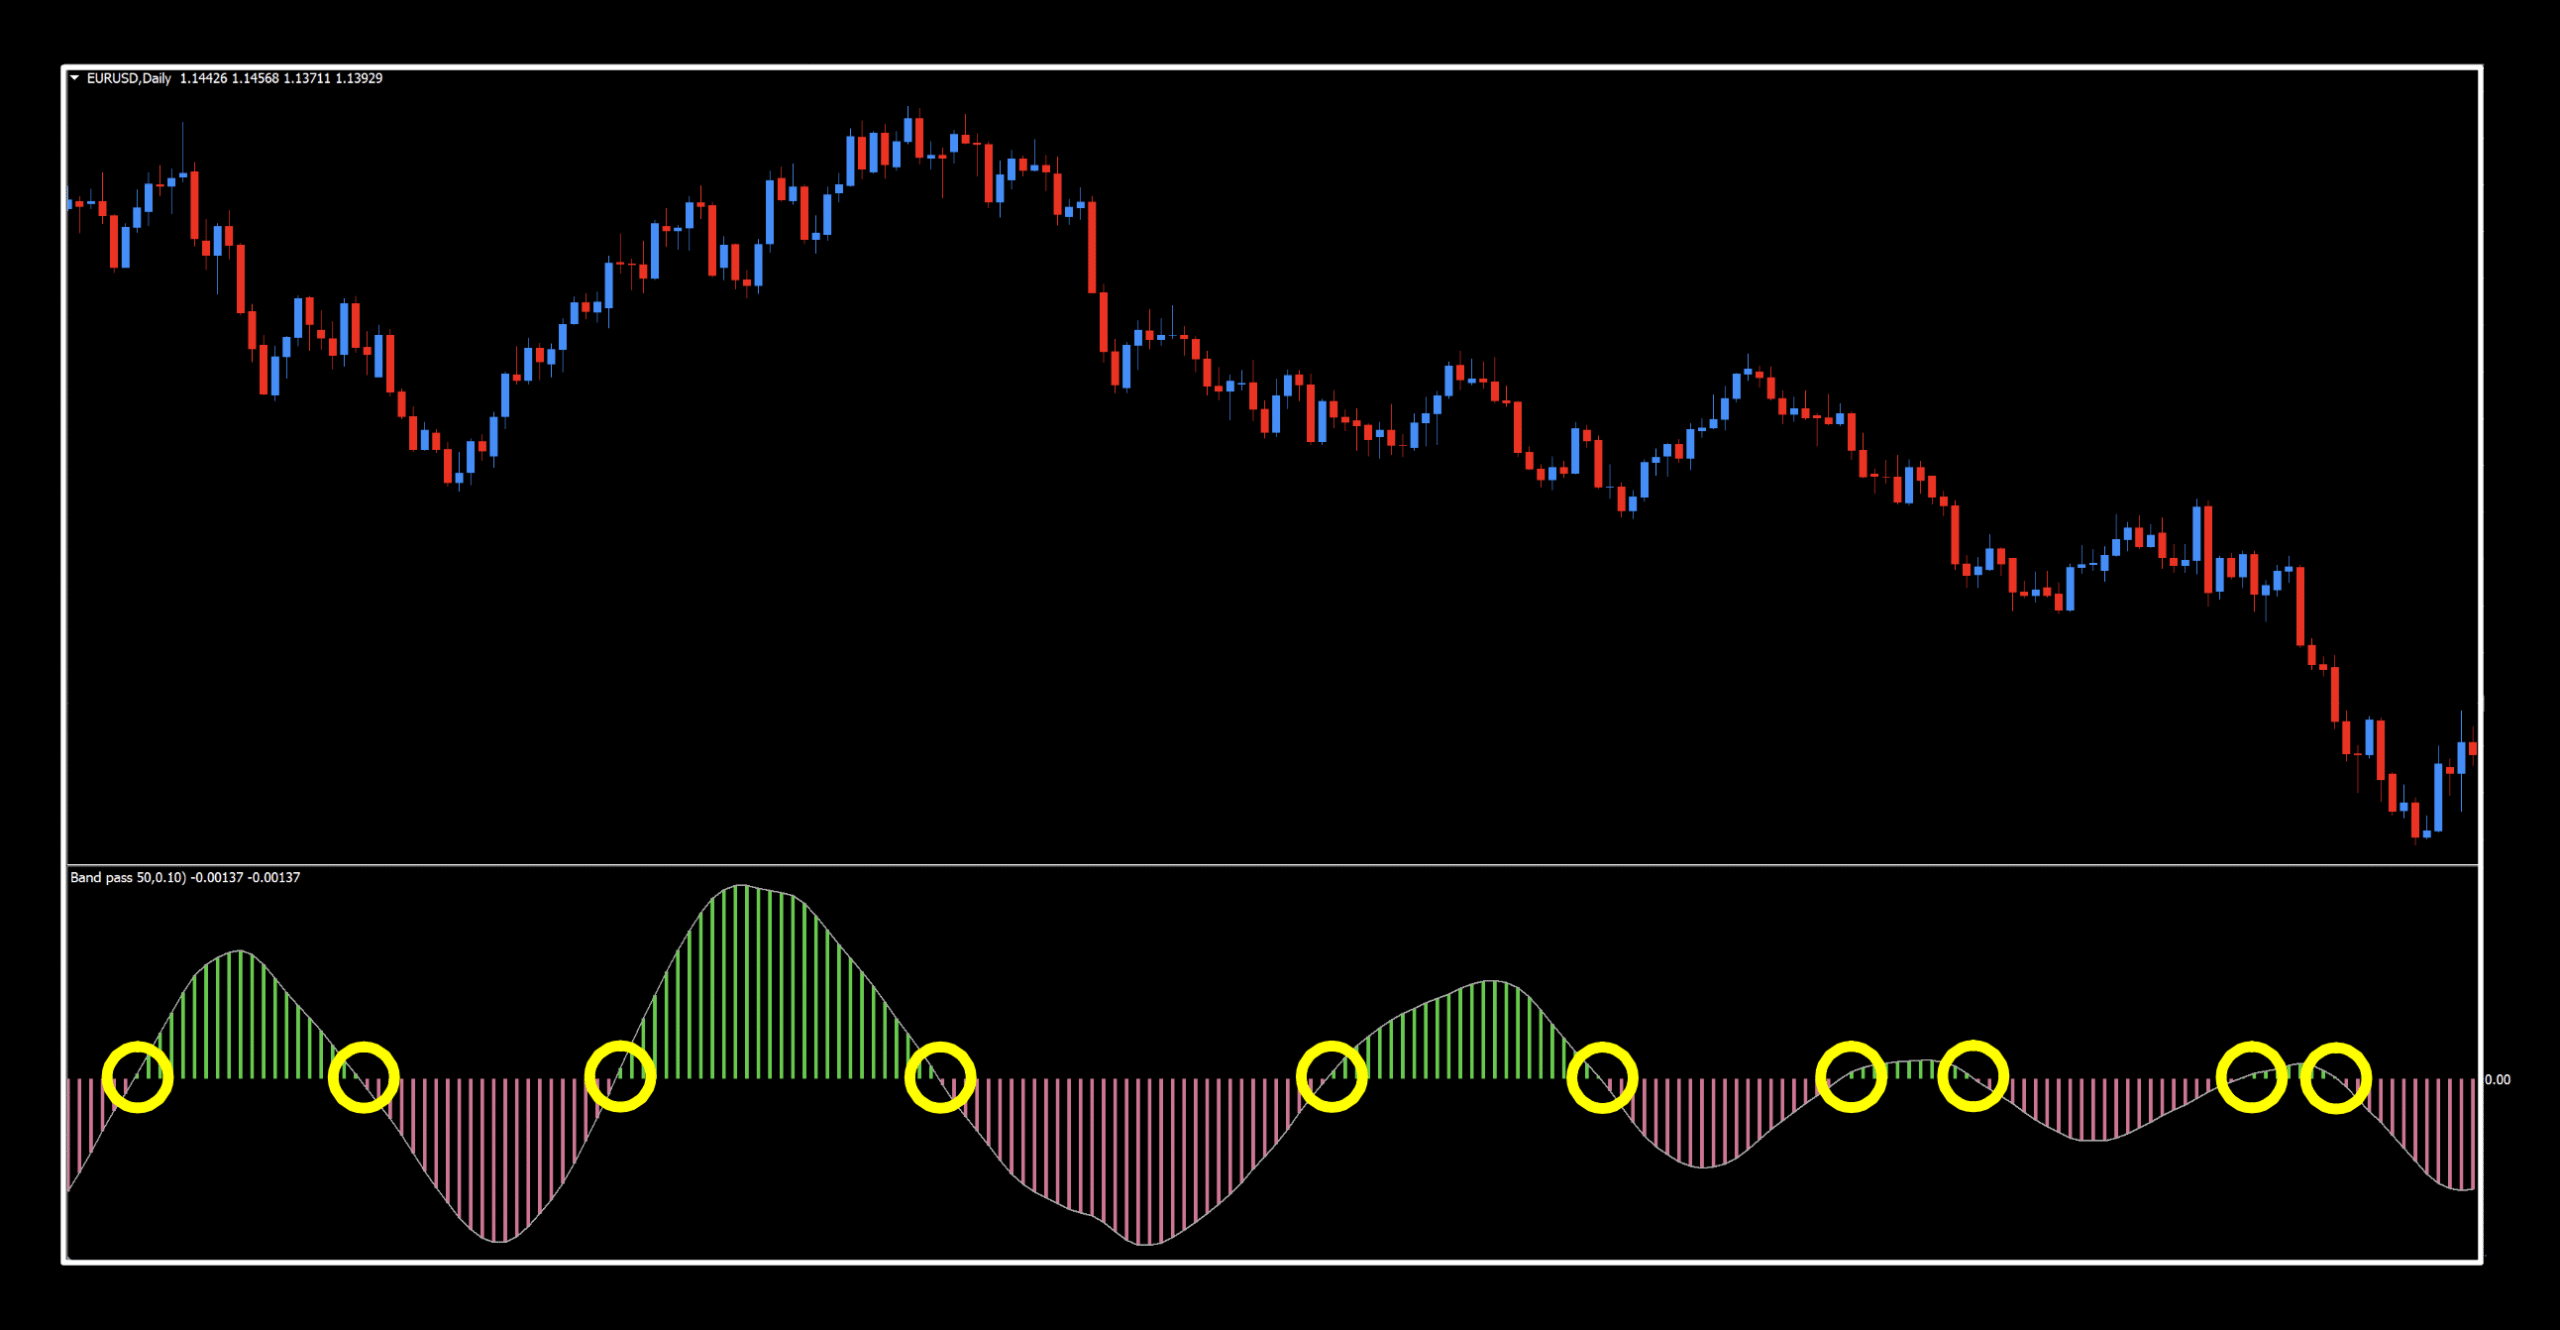
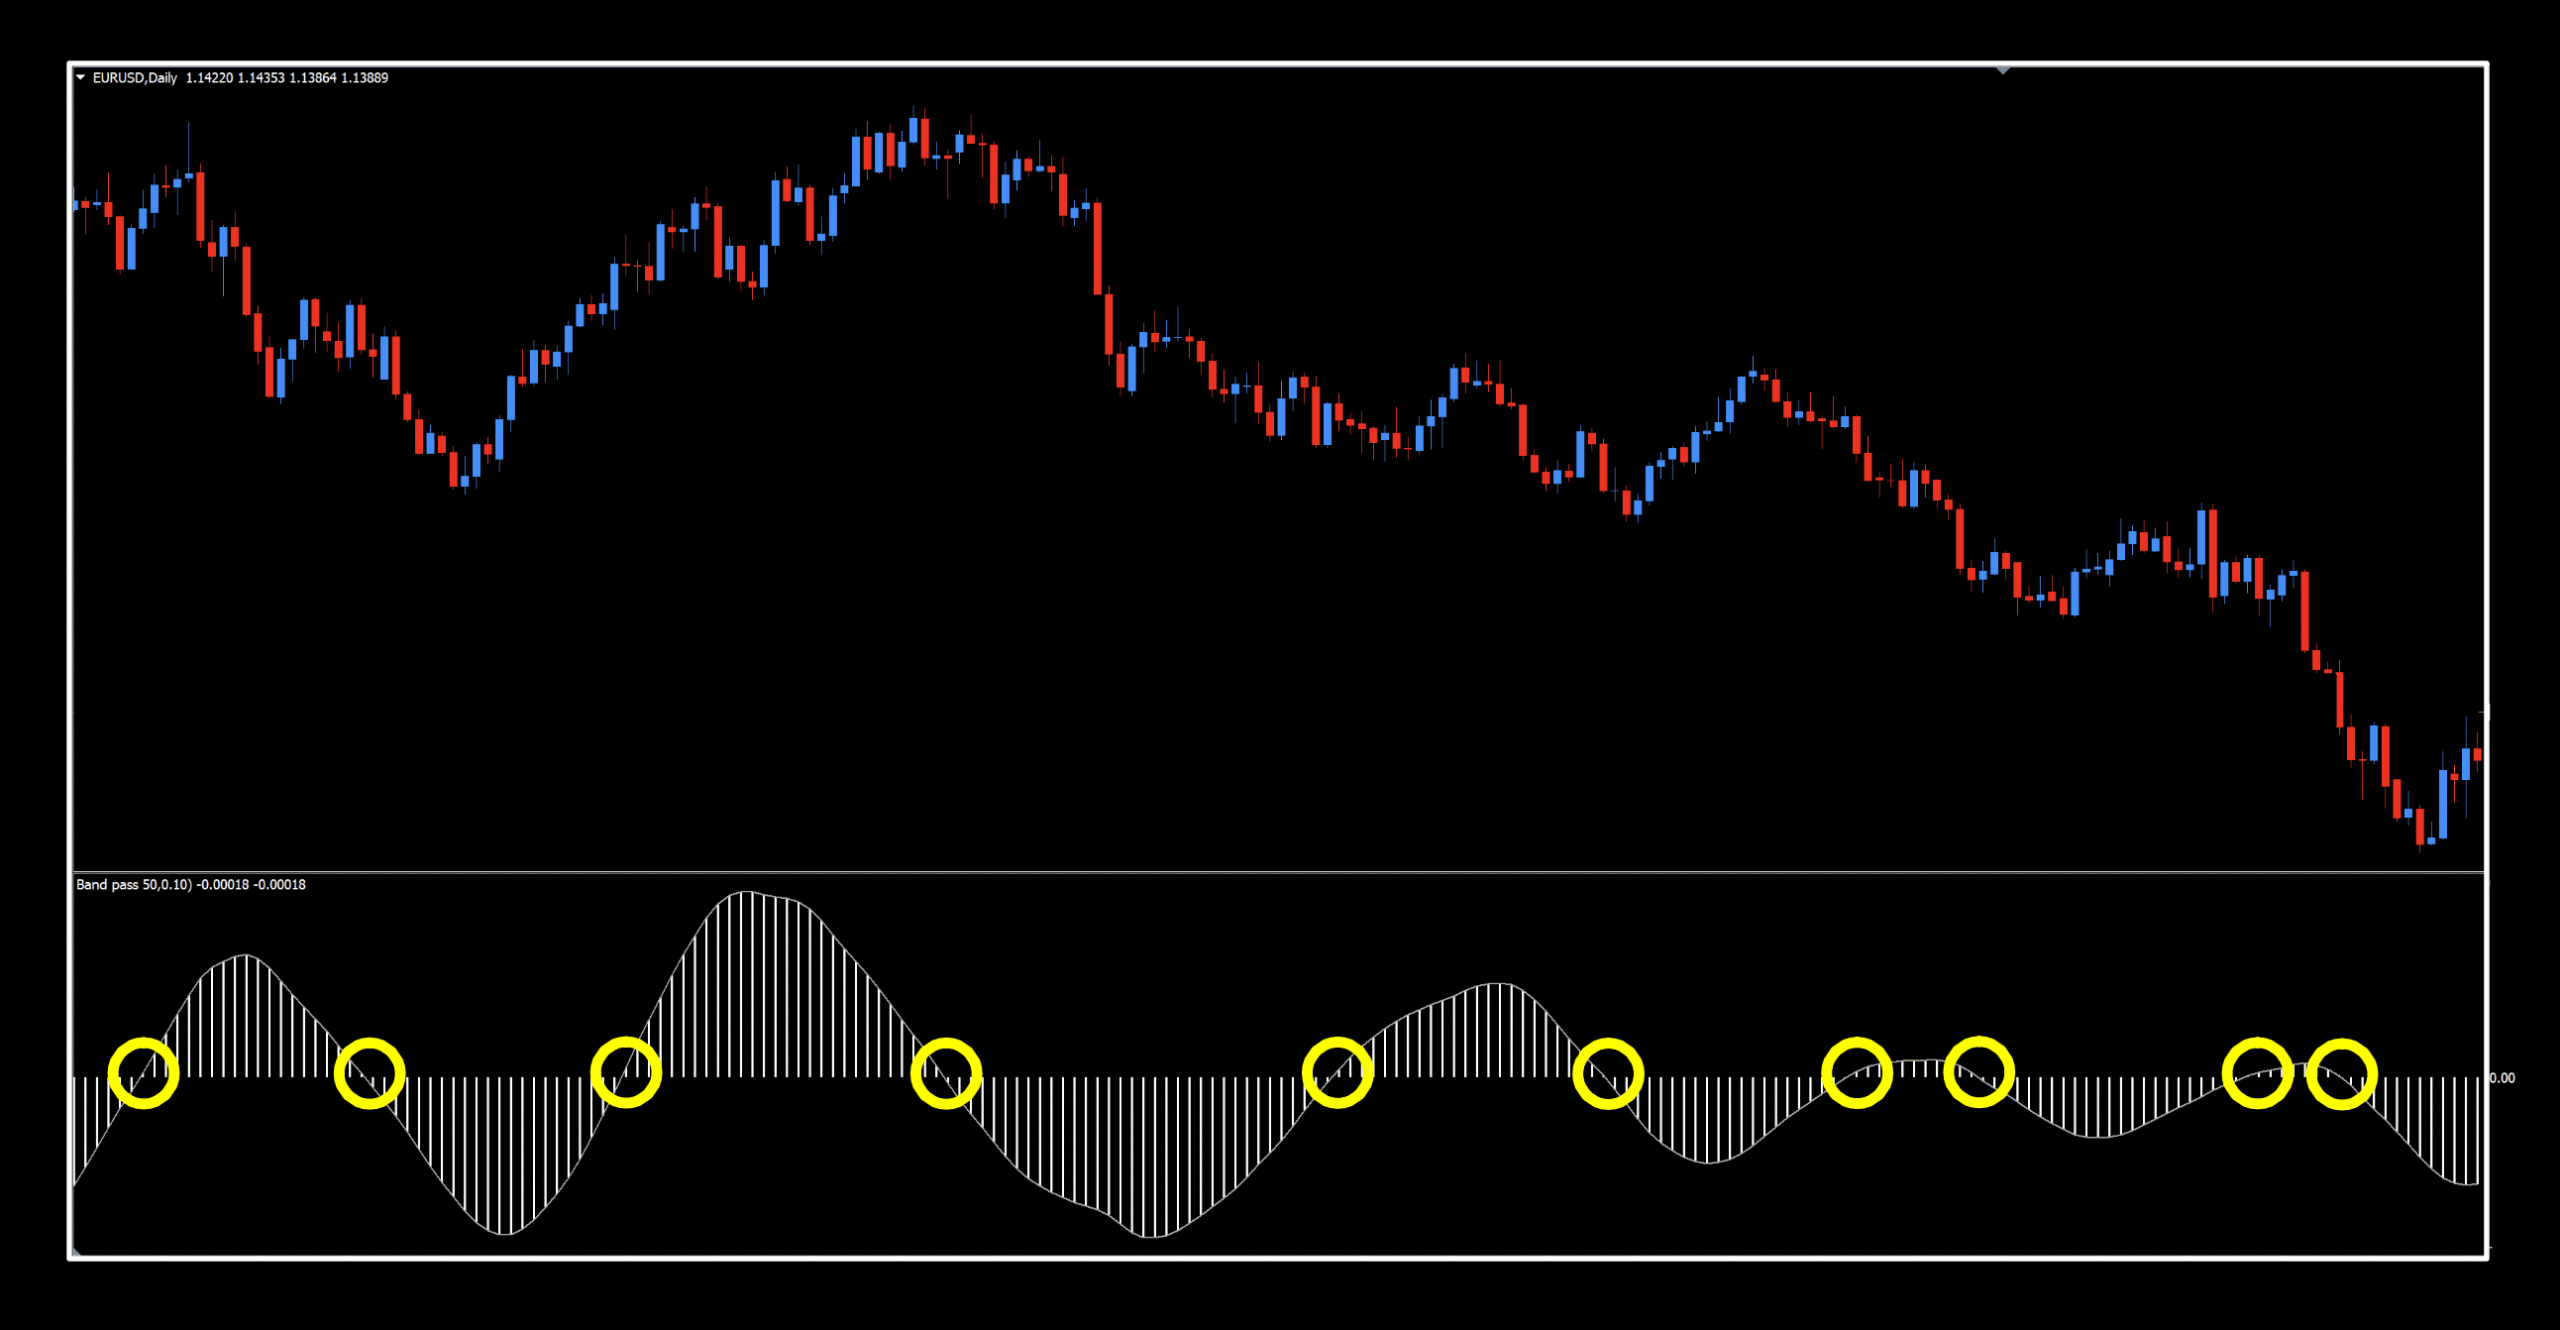
If you look closely at this indicator, you’ll notice there are a few things going on. Color, line thickness, increasing/decreasing amplitude and…a zero line. The only thing that matters to us is the zero line. We’ll address all the other features a little further down.
Long: When the signal bar crosses above the zero line (or turns green).
Short: When the signal bar crosses below the zero line (or turns red).
Downtown Traffic
This below price indicator paints a very pretty picture. Signals are clear, and it looks like a decent C1 indicator for your algorithm. As the default period value is (50), which is somewhat long, the signals below are a bit late. However, with the variables in the settings menu at your fingertips, you have plenty of opportunities to make changes.
It’s In The Details
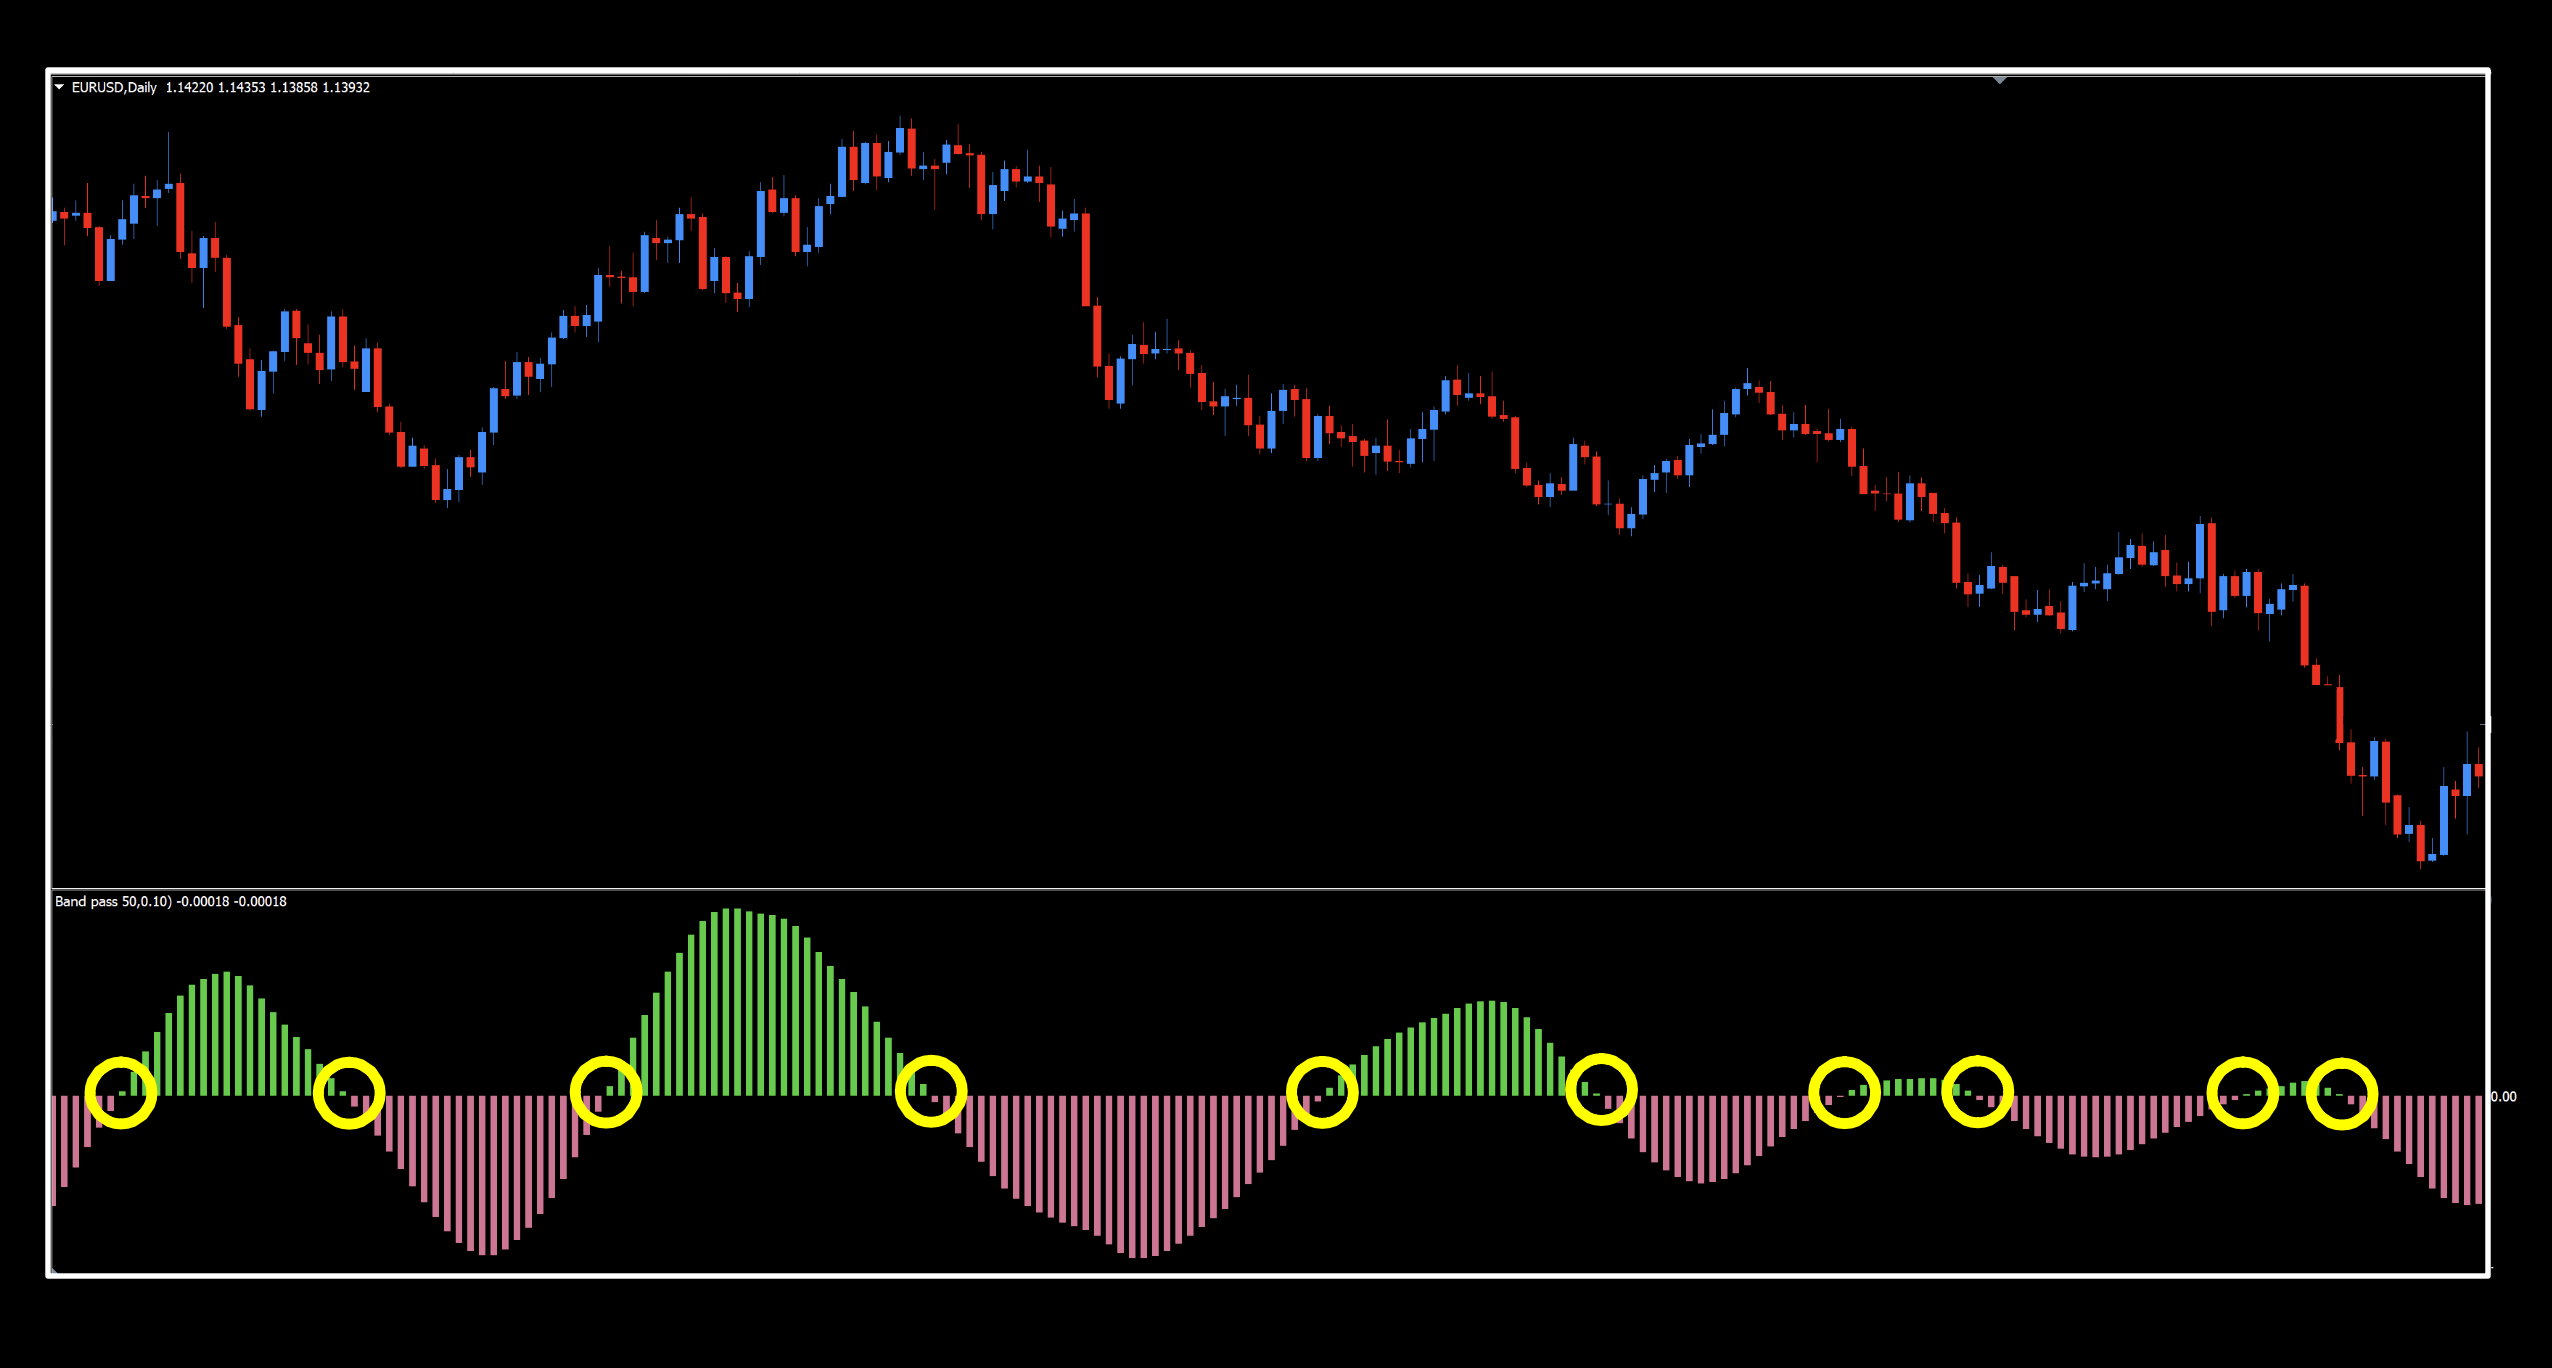
We’ve been alluding to a couple of things with this indicator which bear mentioning. They are (in no particular order); amplitude and line thickness. Let’s look at amplitude first.
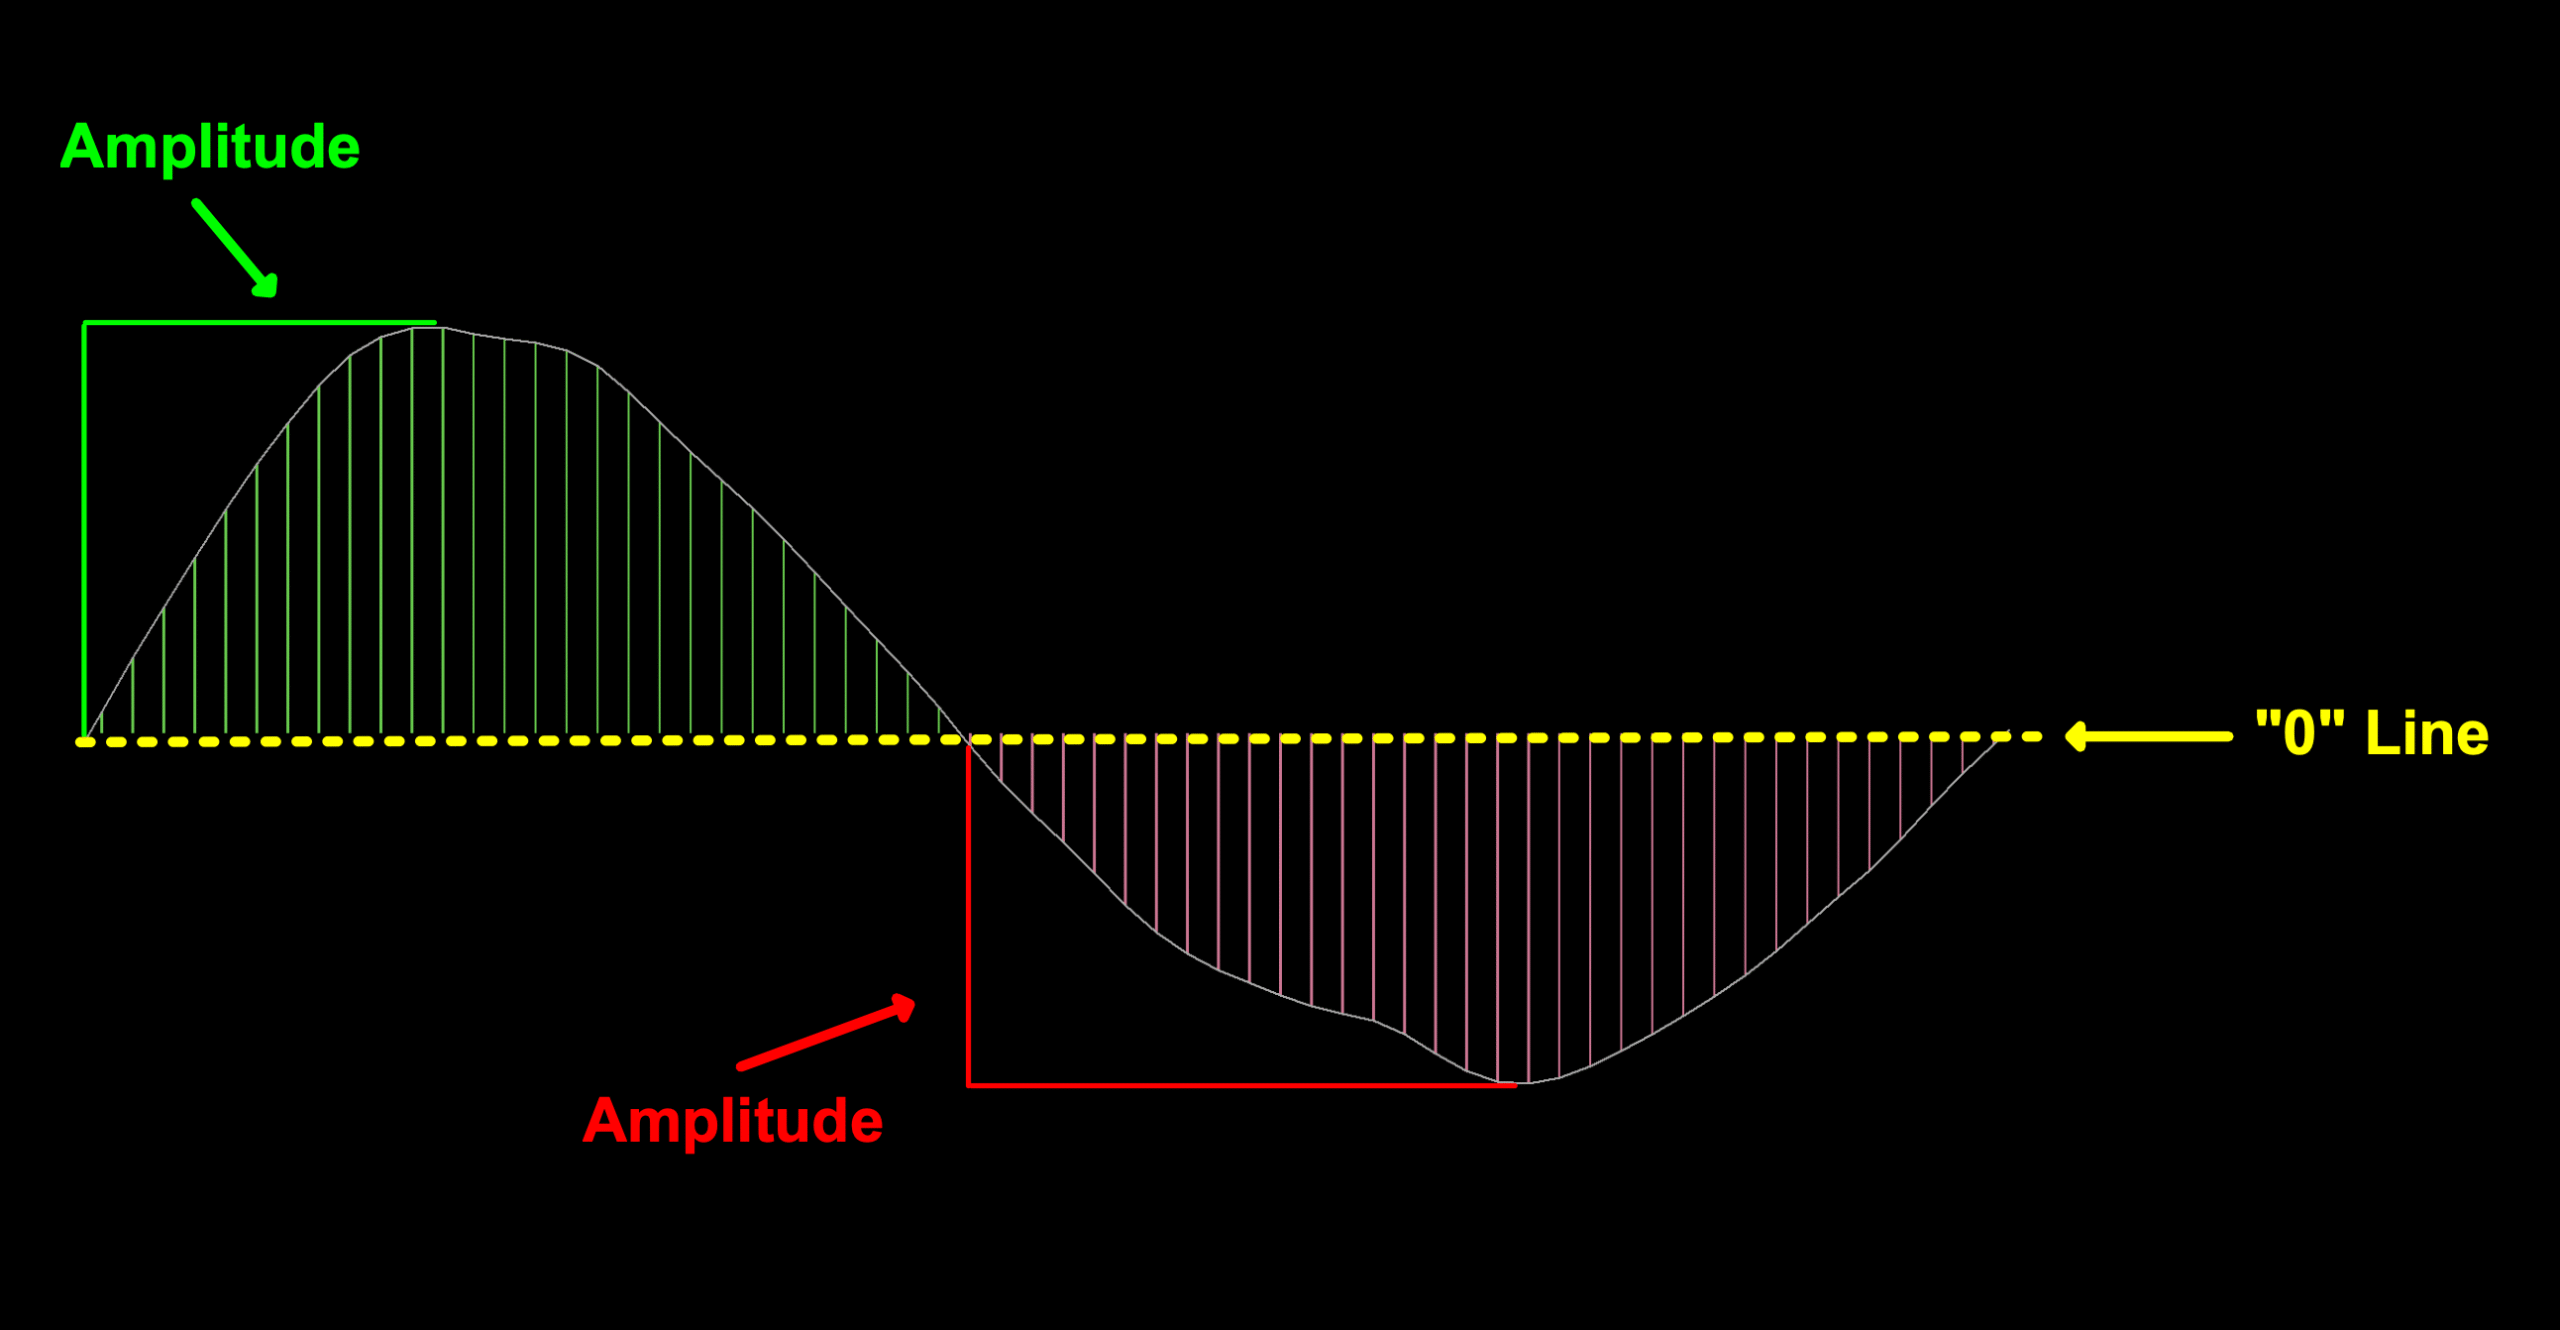
Amplitude is the “height” of the wave from the mid-line (zero, in our instance) to its highest/lowest point. While some may attribute this as the strength of the move, it’s only helpful in hind site. After all, you really don’t know how far up or down it will move. So, ignore it.
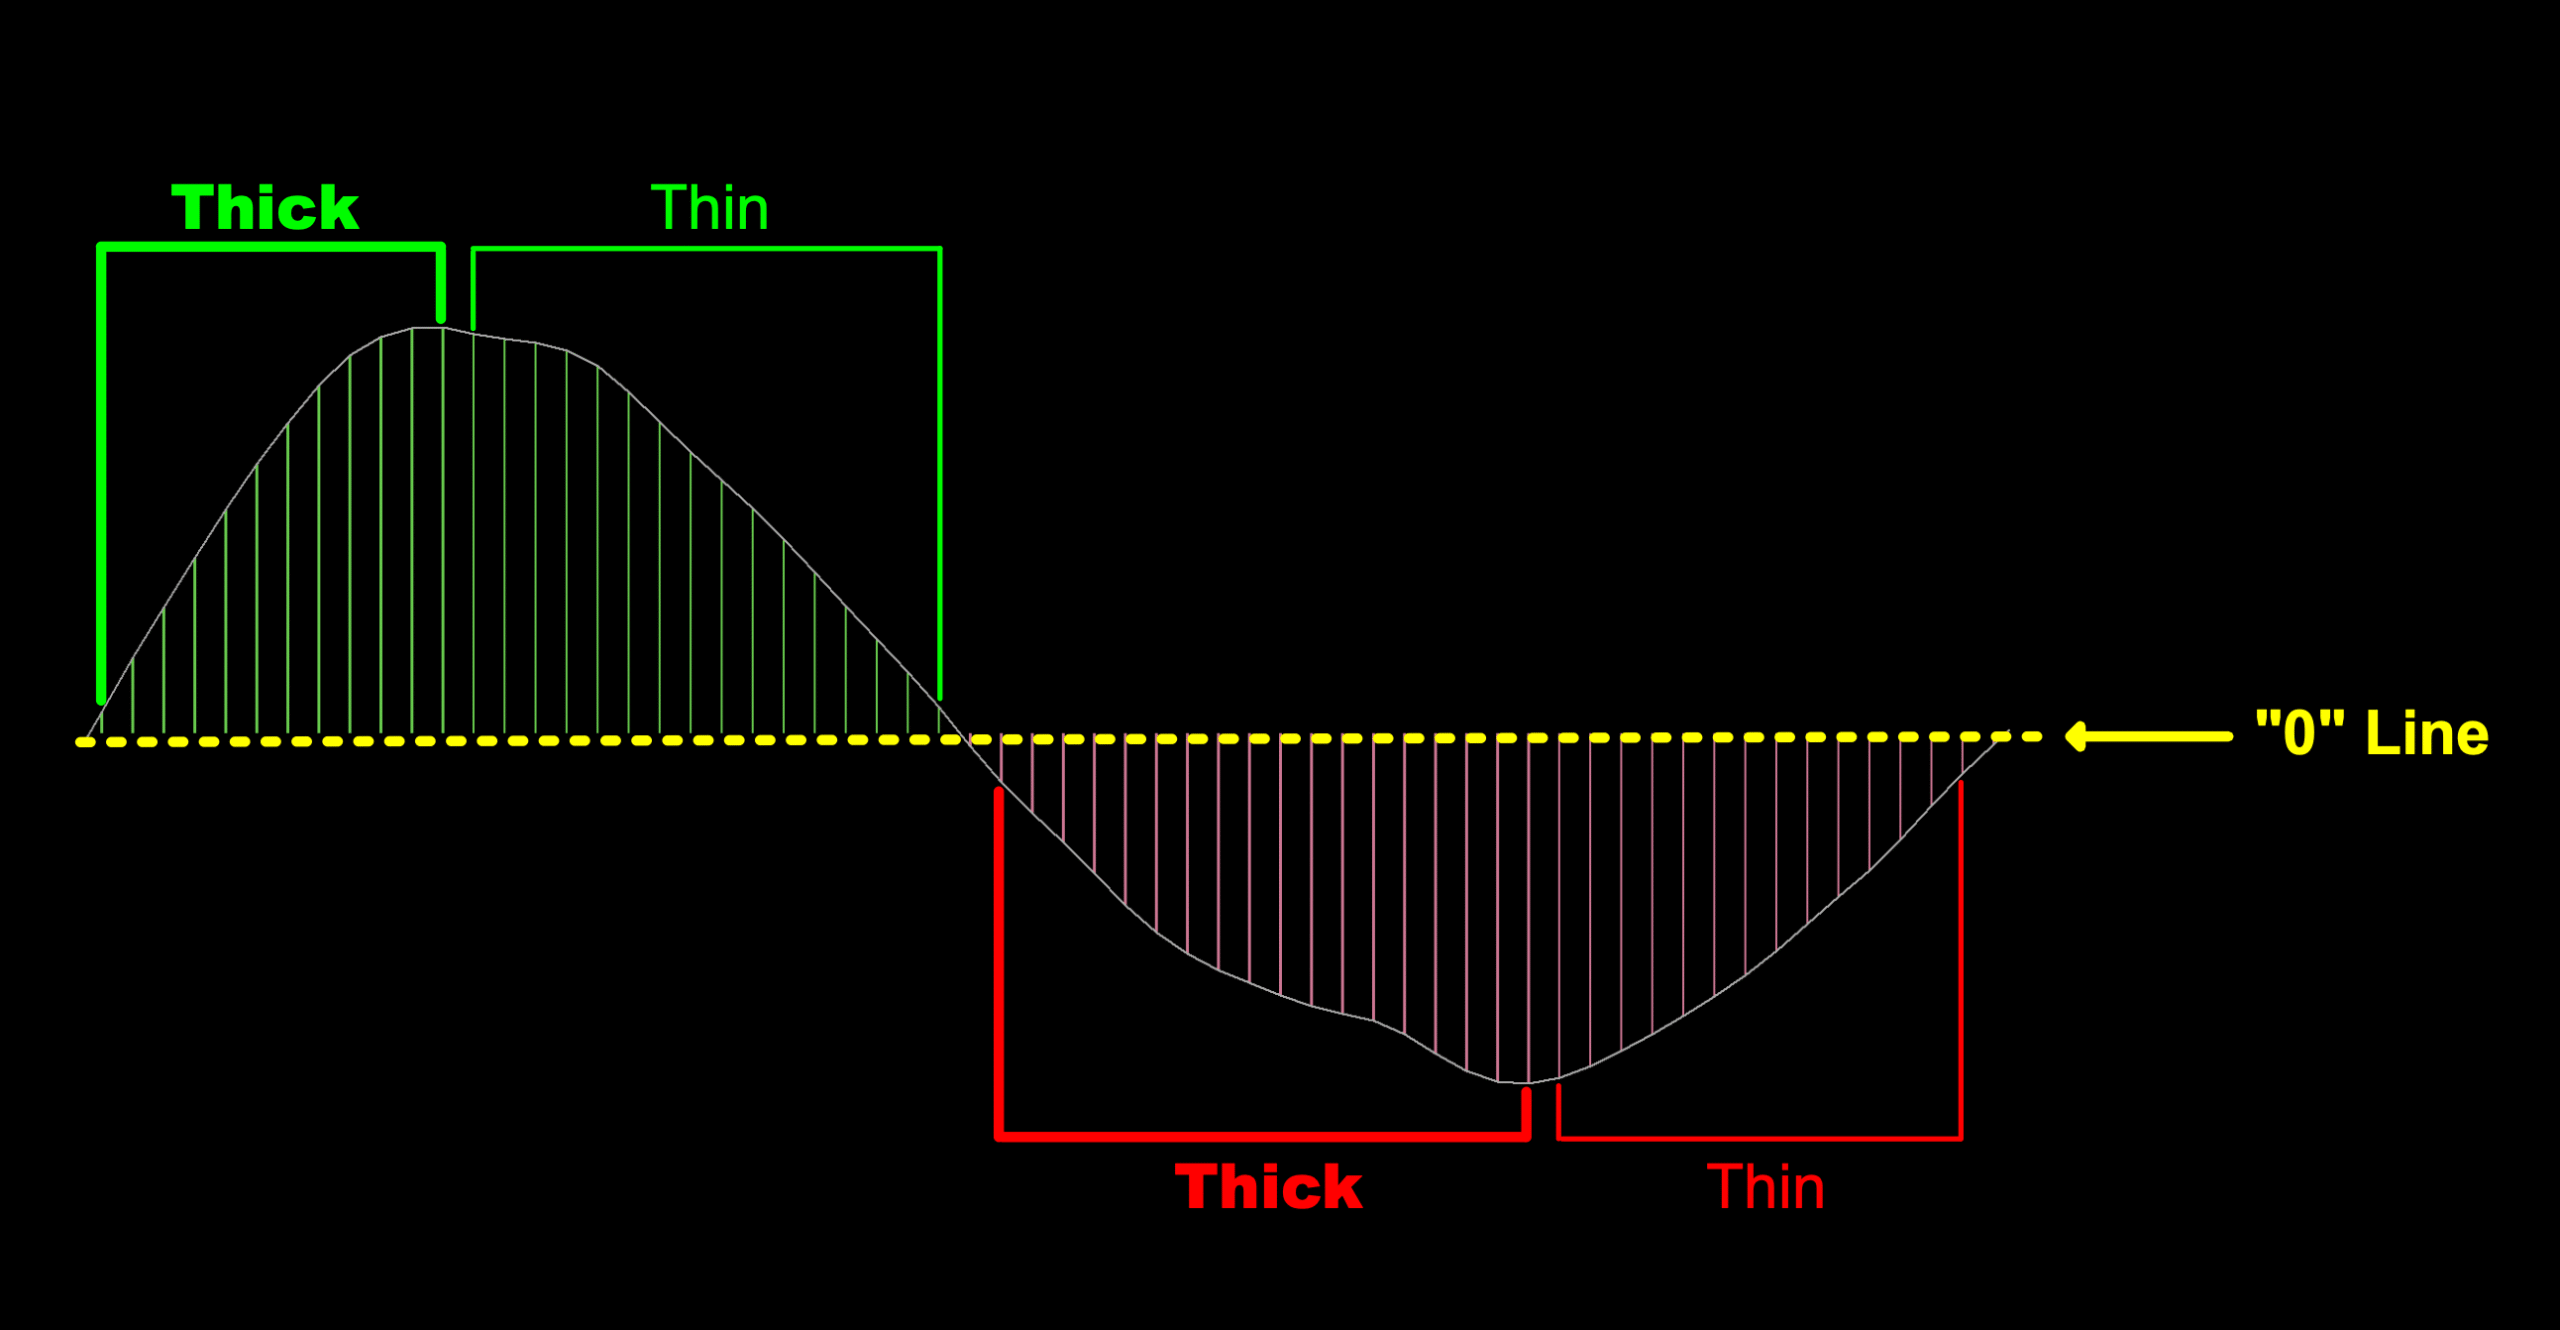
Here, you can see where the growth part of the wave has thicker lines and the declining portion of the wave has thinner lines. This is to indicate whether the amplitude is increasing or decreasing. It is misleading and unnecessary. Unless you are looking for turning points in the market (we are trend traders, not reversal traders), it serves zero purpose. Ignore it.
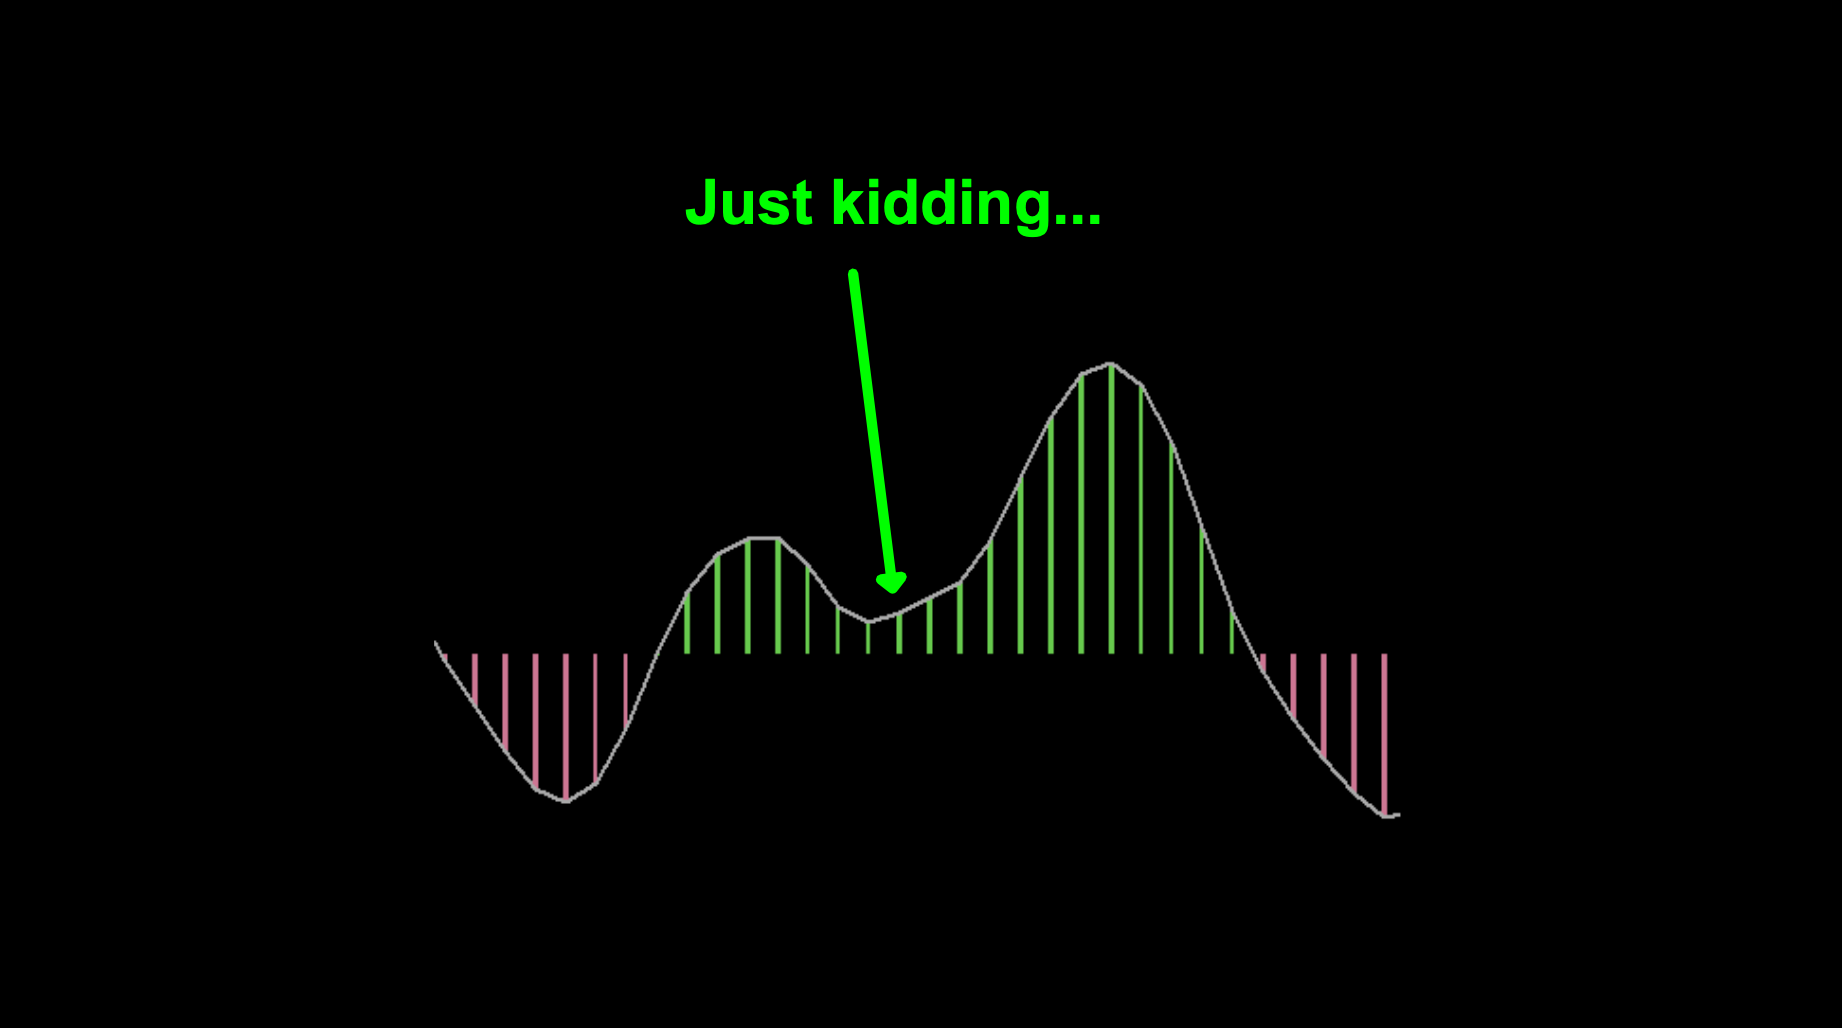
This is a perfect example where following amplitude and line thickness might get you into some trouble. Again. Ignore them. In fact, you should set your color scheme to the following to remove any temptations.
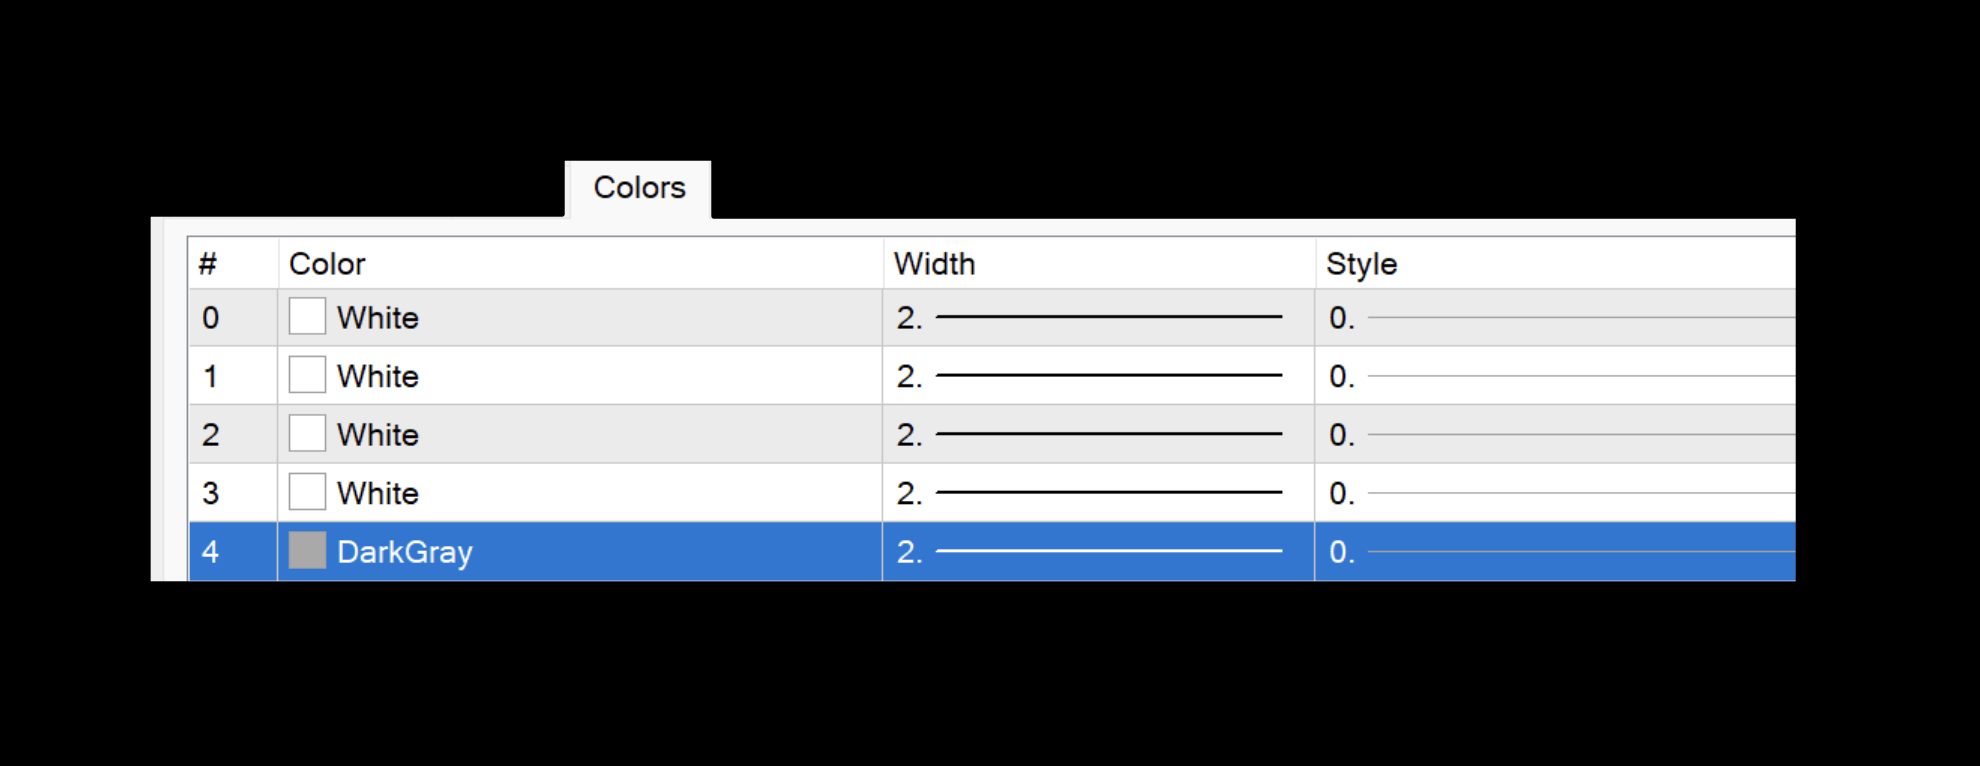
And you’ll get this…
Or, even easier…
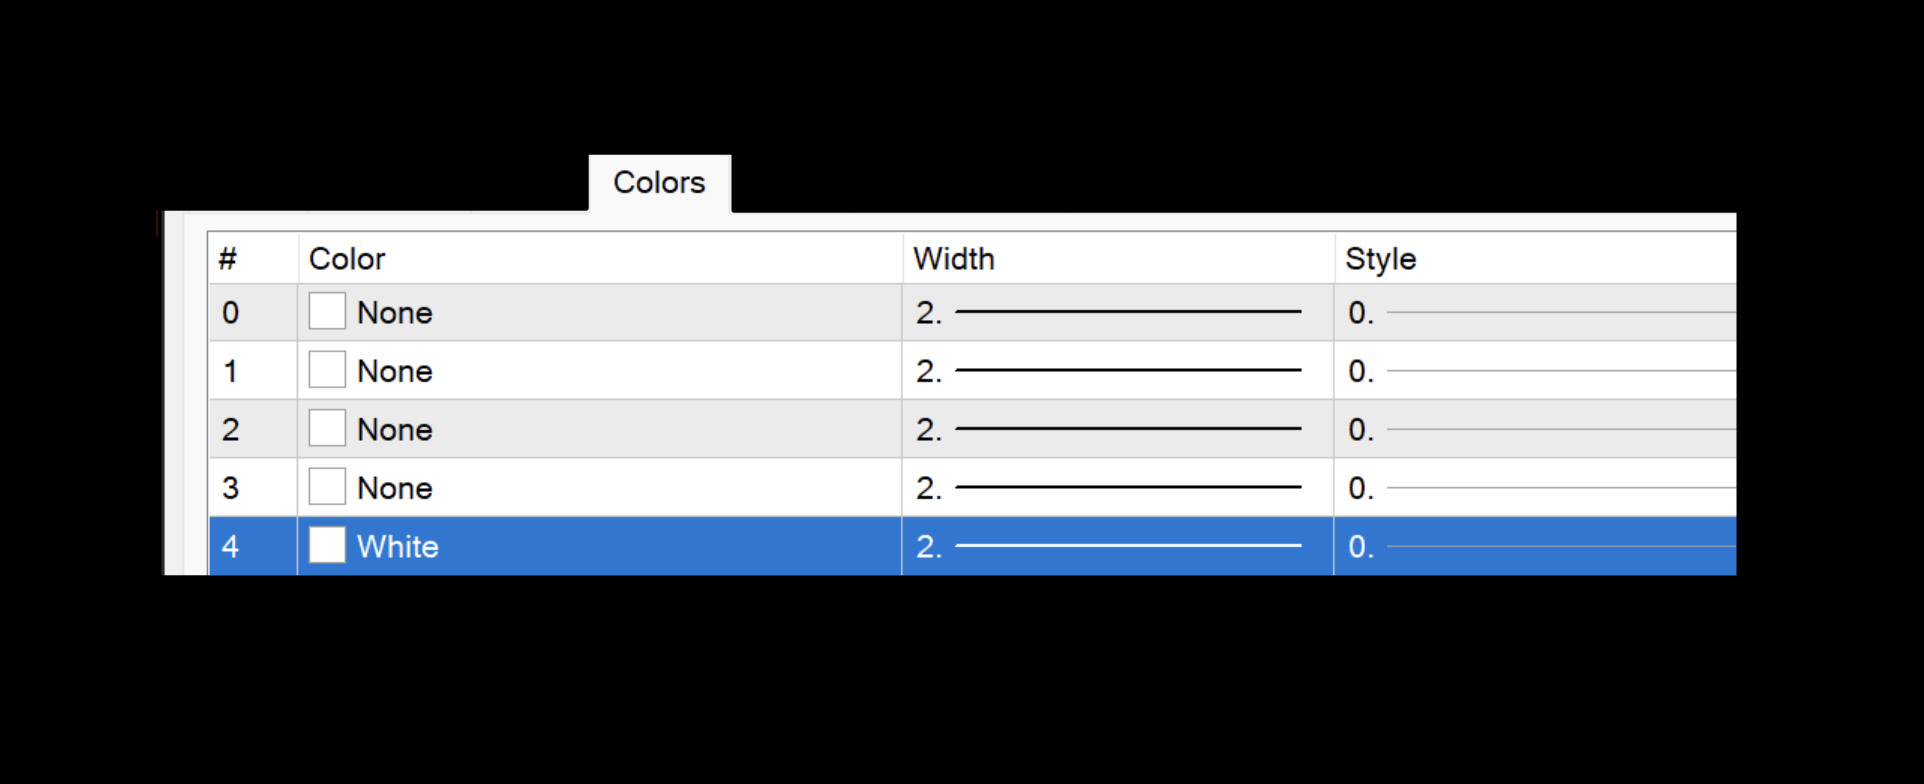
And you end up with this…
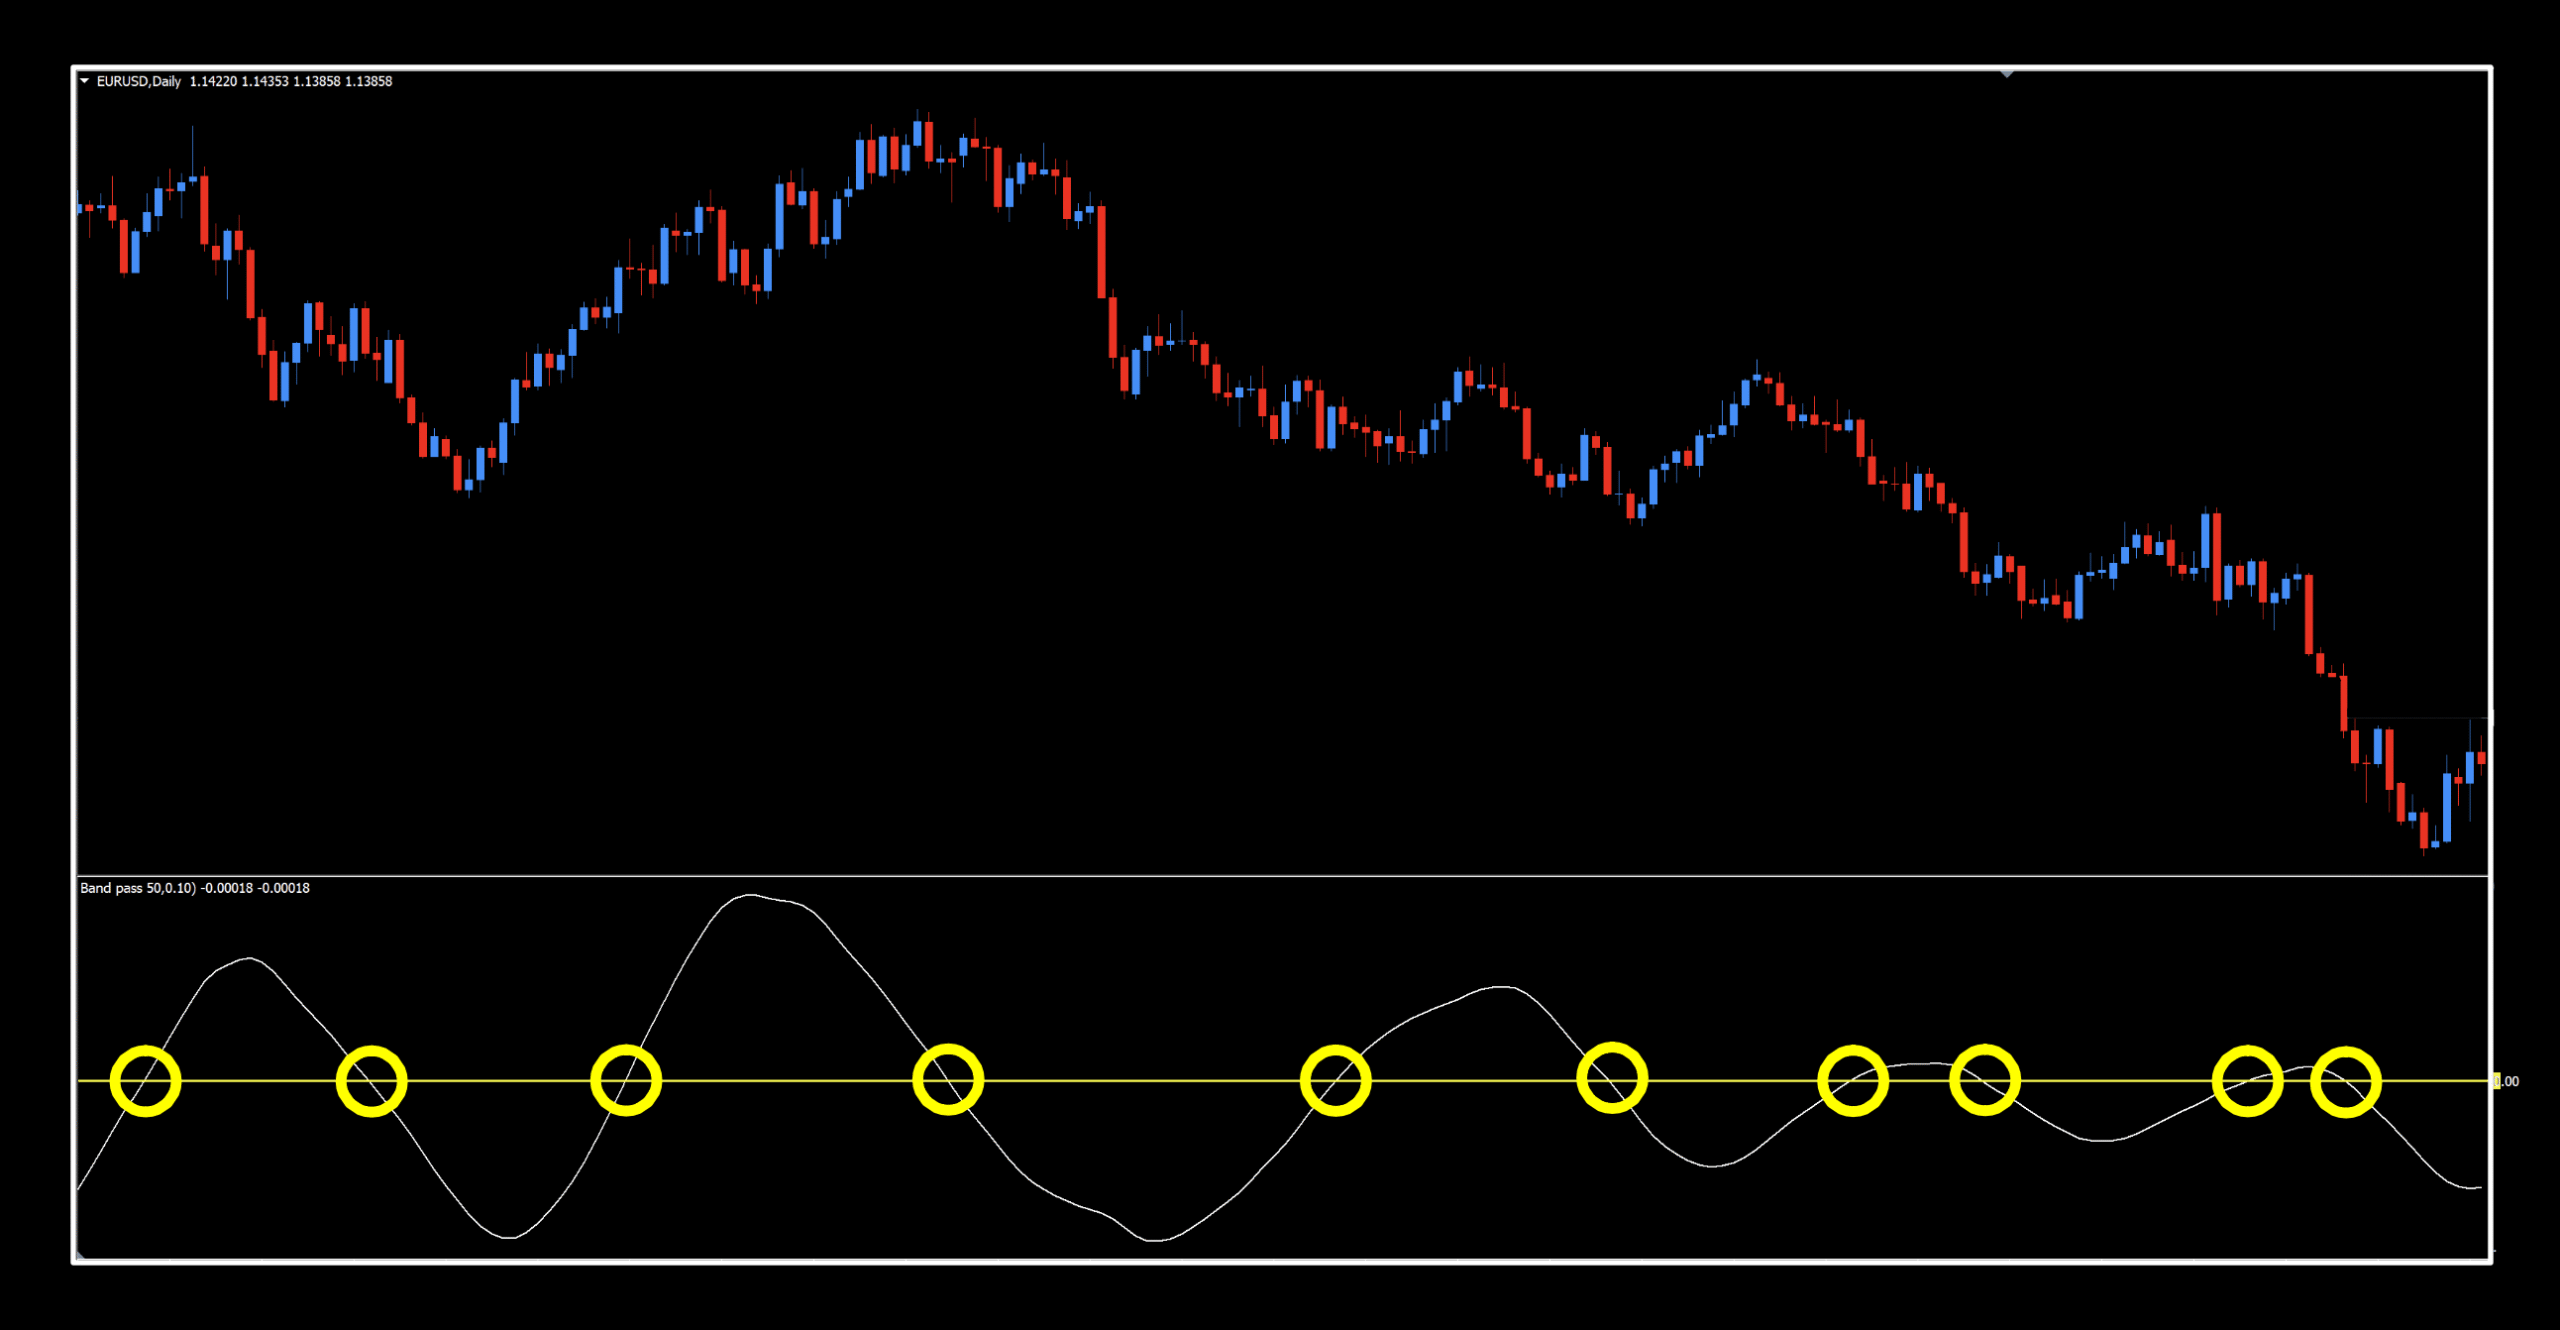
A true zero cross representation.
On a final note, if you’re partial to colors, then by all means…try this!
Alrighty, that’s enough of that. Let’s go see how this curvy mover and shaker did.
Go Get Some
If you’ve forgotten how we test, or want to learn what we test for, check out the Cross Roads indicator study, which has all the information you need. Just click, HERE. We get into the gory details of how we came up with our testing parameters, which naturally aligns with the NNFX methodology.
Below are the results from our late night testing joyrides.
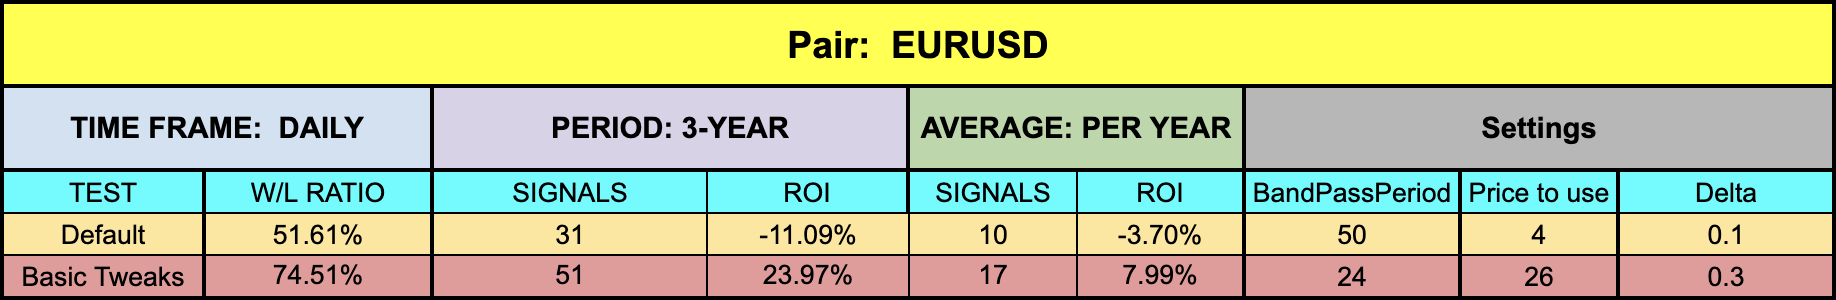
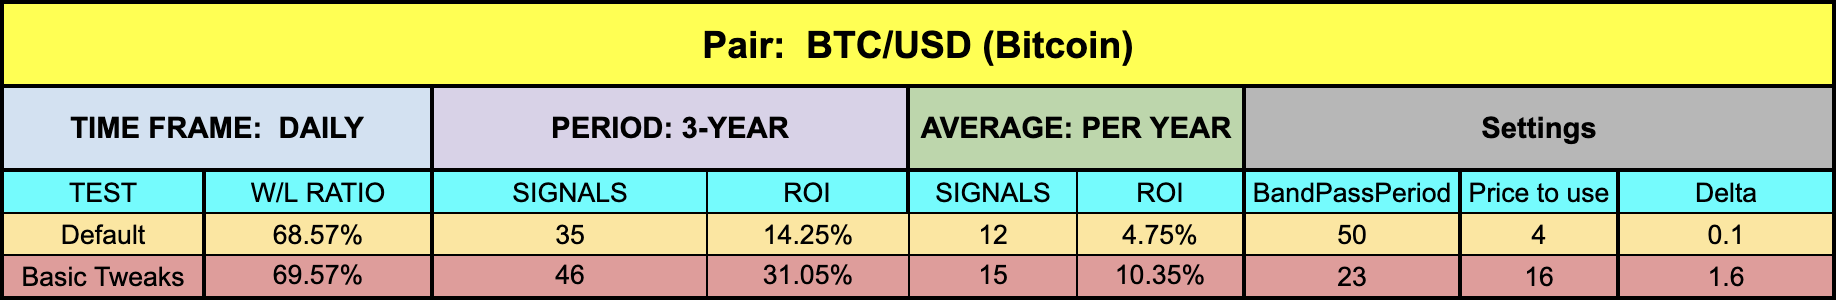
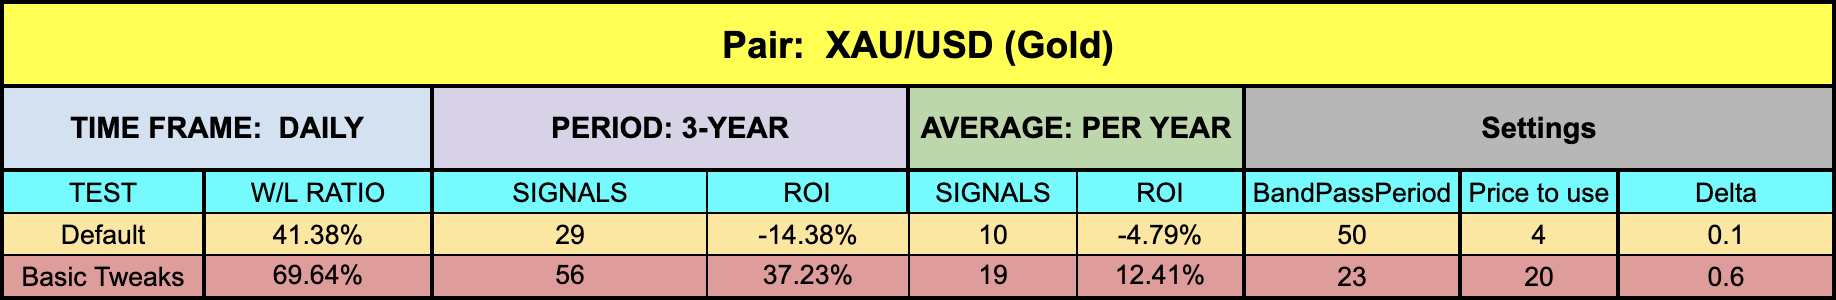
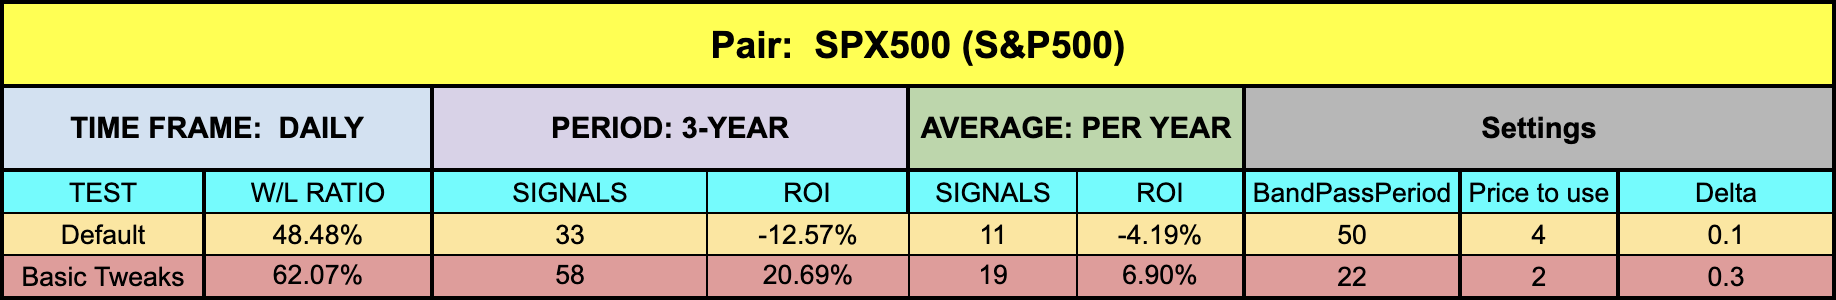
Getting It Done
Results were pretty good. And those aren’t even the best ones. In all cases, the W/L percentage increased, something we all strive for. ROIs across the board went up significantly, although the default values for BTCUSD weren’t too bad as starting points go. With a little love, this could become your newest tool in your trader’s toolbox. Only the Shadow knows…
Resources
Now that you’ve made it to the end, you can find it in the on-line library by clicking, HERE. It’ll have the word, “NEW” in red next to the name to help you find it. And for the love of all that is good and gooder, be sure to subscribe to the Stonehill Forex YouTube channel for the technical analysis videos, among the other helpful mini movies. And, to fast track your way to trading the correct way, sign up for the Advanced NNFX Course HERE.
Our only goal is to make you a better trader.
*Our published testing results are based on money management strategies employed by the NNFX system and depend on varying external factors, which may be different between individuals and their specific broker conditions. No guarantee, trading recommendations, or other market suggestions are implied. Your results and subsequent trading activities are solely your own responsibility.
BTW — Any information communicated by Stonehill Forex Limited is solely for educational purposes. The information contained within the courses and on the website neither constitutes investment advice nor a general recommendation on investments. It is not intended to be and should not be interpreted as investment advice or a general recommendation on investment. Any person who places trades, orders or makes other types of trades and investments etc. is responsible for their own investment decisions and does so at their own risk. It is recommended that any person taking investment decisions consults with an independent financial advisor. Stonehill Forex Limited training courses and blogs are for educational purposes only, not a financial advisory service, and does not give financial advice or make general recommendations on investment.