Revisit
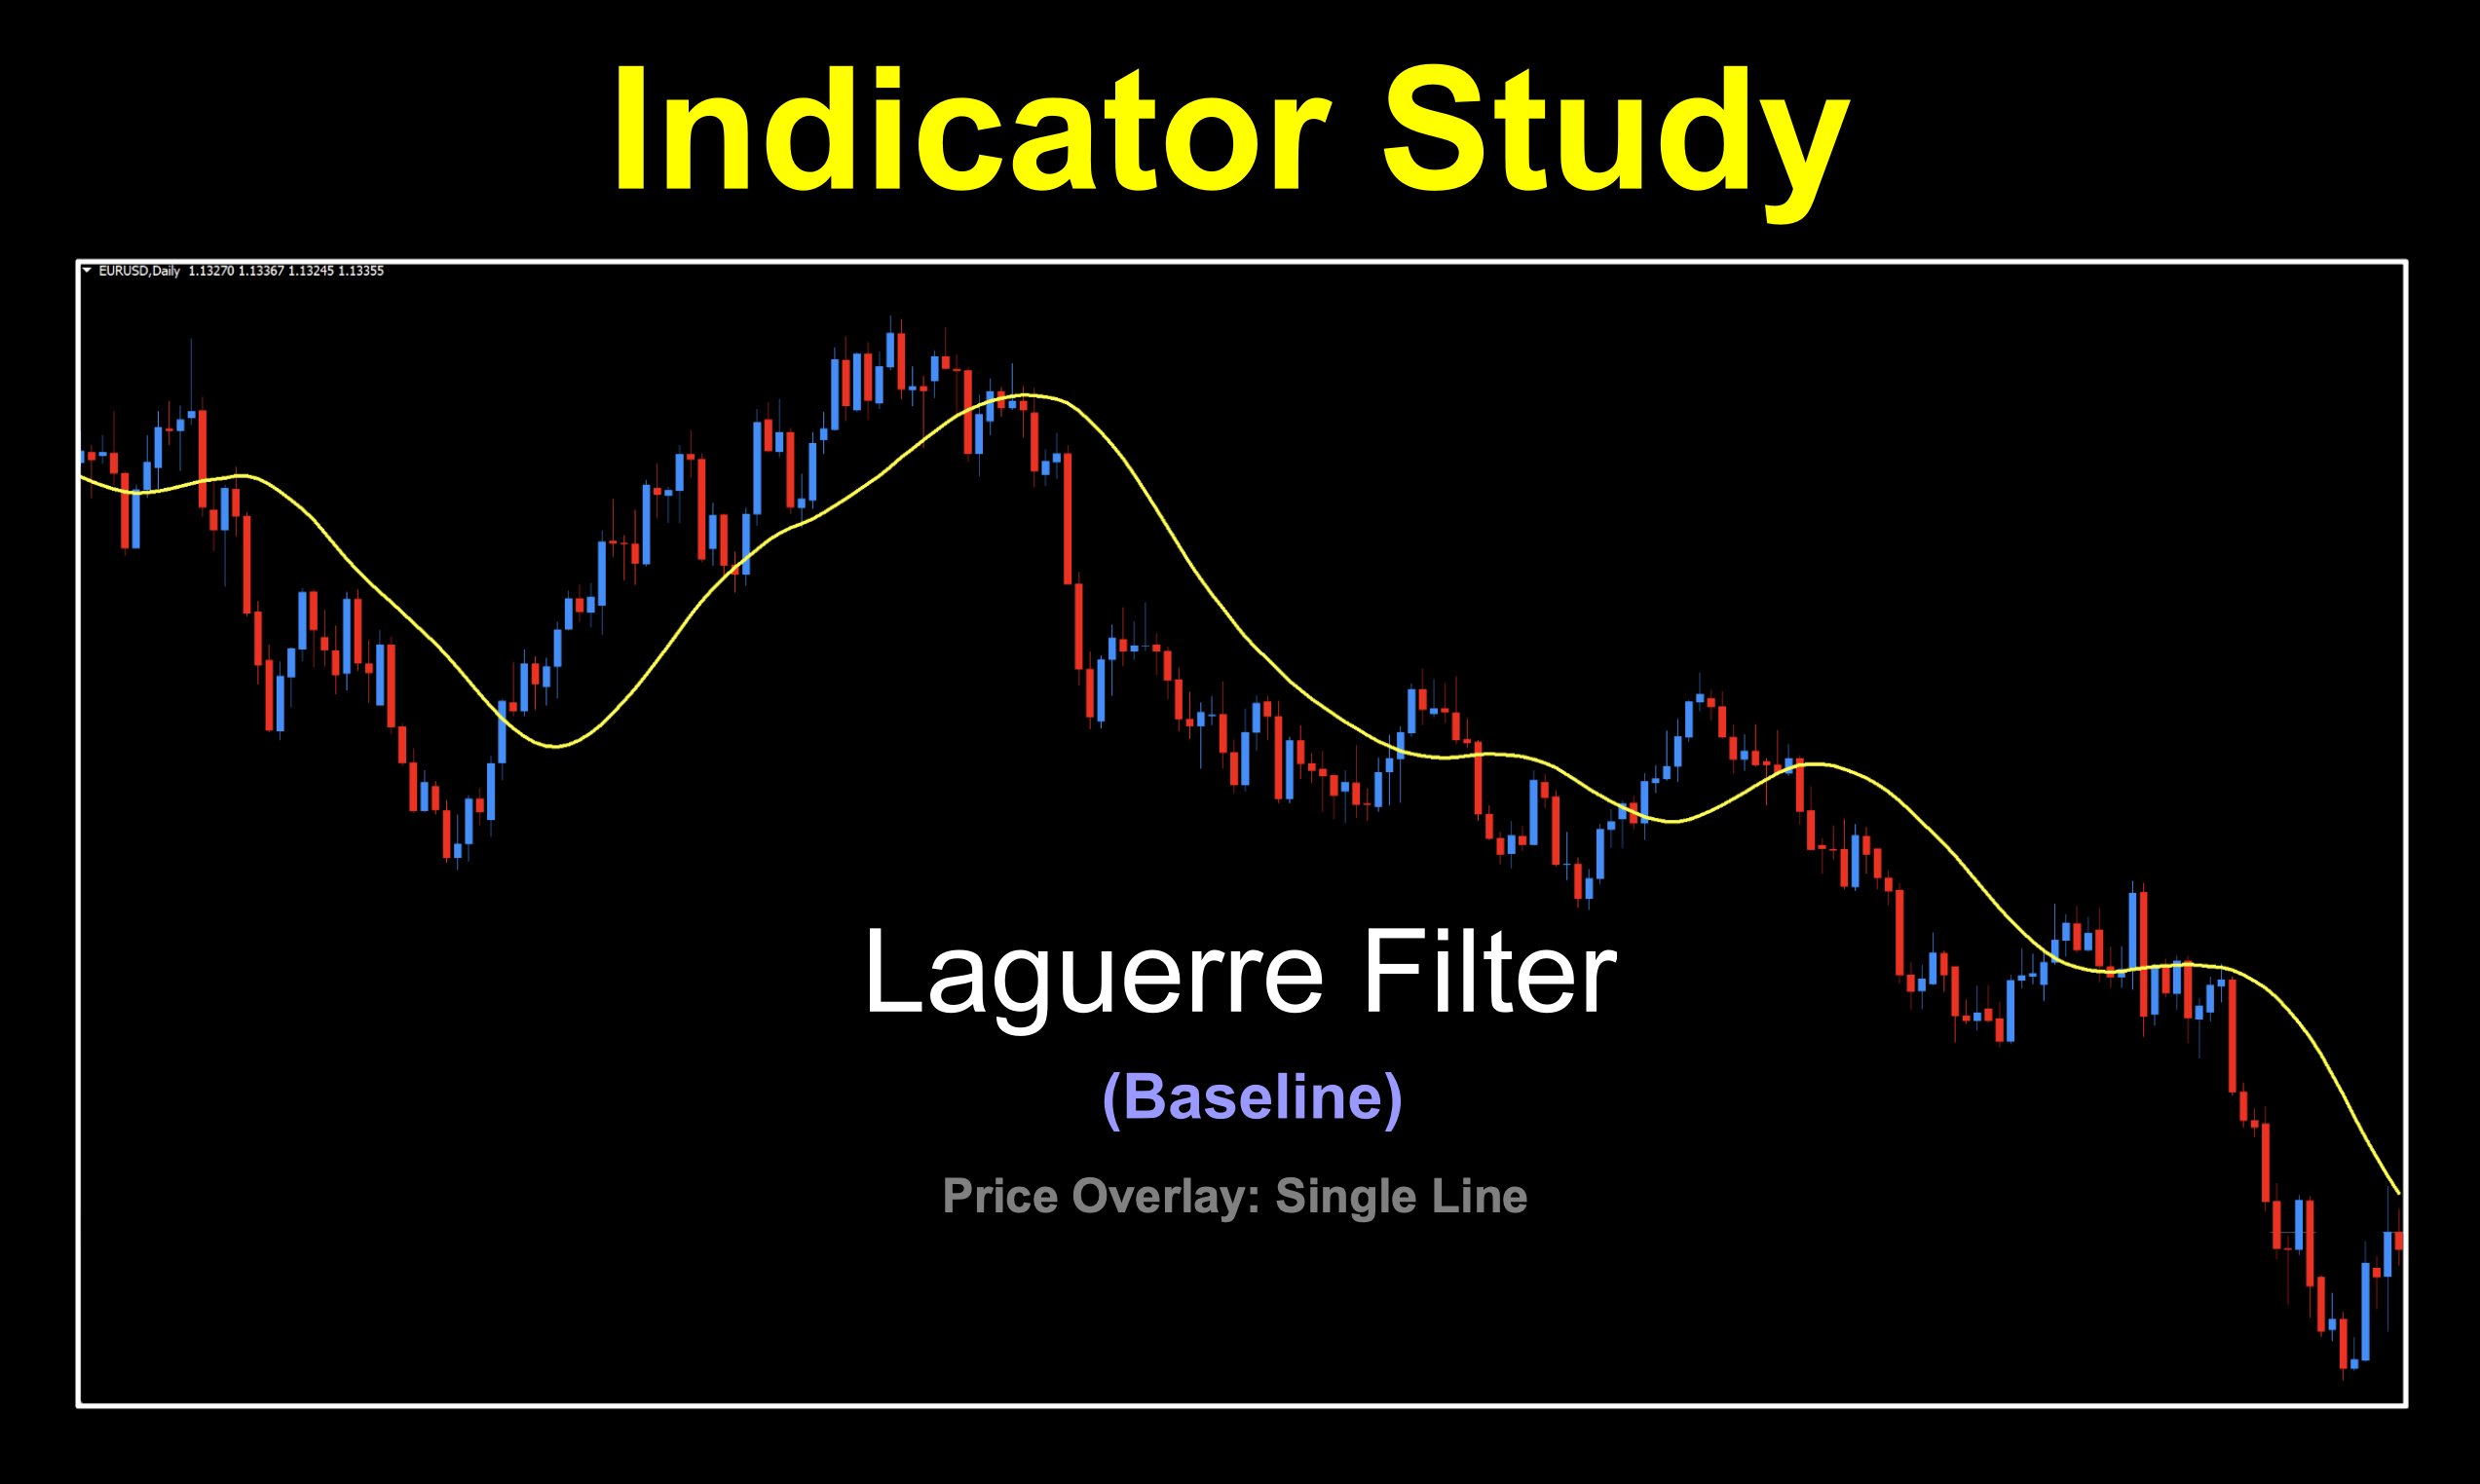
Every so often we find an indicator that seems familiar, but not. We did profile an indicator about two years ago called “Laguerre” which was a below chart midline cross confirmation indicator. What piqued our interest was the similarity in the components, but this one is a baseline and has some internal differences.
Maybe?
Before we get into things, and before I forget, I wonder would happen if we combine the two the same chart. It would be like Pete…and RePete! Sorry, lame humor. But seriously, let’s see what’s up with that later in the blog
Respect Time
We won’t get into the nitty-gritty detail on this one as much as we did in the first Laguerre, since there would be some overlap, but we’ll mention enough to get you headed in the right direction.
Get Control
So, what is it? Well, the Laguerre filter is based on a smoothing function derived from something called “Laguerre polynomials” and provides a method to control the balance between smoothness and lag. This offers a smoother alternative to simple moving average. Our indicator was coded into existence in 2006.
Poly What?
Laguerre polynomials are used in quantum mechanics. It serves to provide solutions to differential equations at the atomic level. While that’s all very intriguing, it provides us trading folk a way to analyze smoothed periods of price data and identify trends without the lag associated with traditional moving averages. This filter offer a more responsive and adaptive approach to smoothing, making them useful for capturing meaningful price movements and filtering out short-term noise. Bada bing. Bada boom.
Alphabet Soup

That’s Smooth
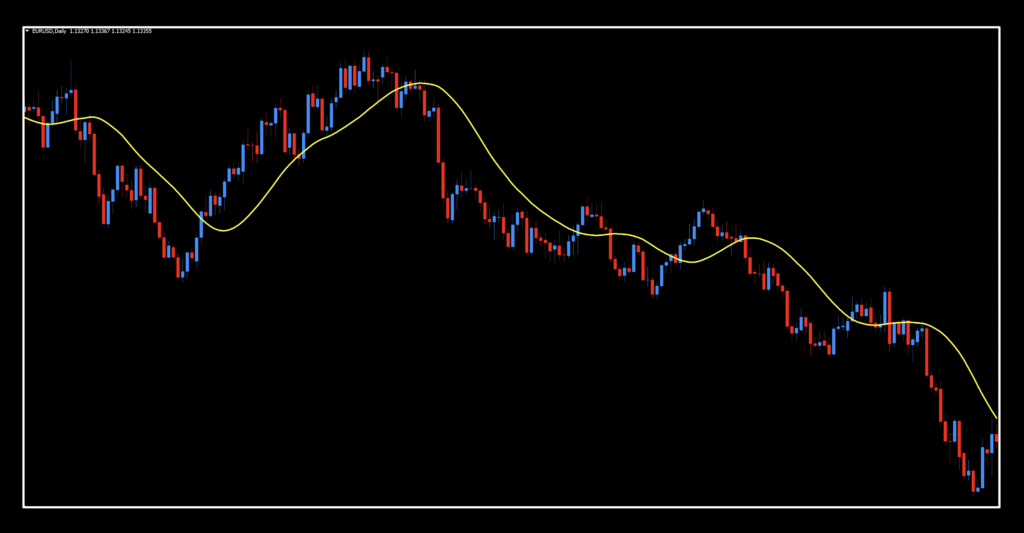
Below is a screenshot of the default settings on a naked chart. We’ve thickened up the signal line, but that is one smooth baseline. Pretty sexy, no?
Settings
In this baseline indicator, we’ve got two variables we can all have loads of fun with.

Gamma: This setting is the coefficient for calculating the level of the indicator. The higher the value, the smoother the line will be and lower the value, the more reactive the signal line. The default setting is 0.7.
Price_Type: The price data set used in the calculations. They include Close, Open, High, Low, Median, Typical, and Weighted Price. The default set is the Close price.
Daily Maintenance
Remember, once you’re ready to perform daily maintenance on your trades during the last 20–30 minutes of the trading day (1700 New York time), you’ll be presented with one of four options.
- Opening a trade.
- Closing a trade
- Maintaining a trade; i.e.
- Moving a stop loss level.
- Exiting a trade.
- Taking a pass (nothing to do).
Binary Choices
The great thing about what we do is that making decisions is pretty straight forward. It is, or it isn’t. Especially when a baseline is involved. We’ve received questions on anticipating baseline movement. Don’t do that. Just don’t. You’ll thank us later. Say it with me. It is…or it isn’t.
Long: When price crosses above the signal line.
Short: When price crosses below the signal line.
The O’s Have It
Let’s see how this smooth criminal looks right out of the box.

Barring a couple of areas where signals get a bit dodgy, it reads pretty well for longer trend identification. Remember, the default setting provides a pretty smooth line, so tightening it up may keep you out of some wonky trades. And, that’s up to you to find out!
Deuce
We mentioned it might be interesting to see how both Laguerre indicators lined up together. We’ve put them both on the chart (default settings). Your mission, should you decide to accept, is to determine if they make a winning pair. Maybe drop us a comment in the accompanying technical video? It might make for a fascinating conversation.

Let’s Go See
If you want to familiarize yourself or refresh your memory with regard to testing protocol, click HERE which takes you to the Cross Roads indicator study. We get into the nuts and bolts of how we came up with our testing parameters, which properly aligns with the NNFX methodology.
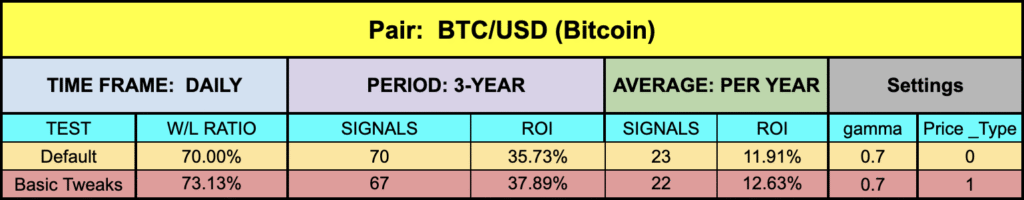
Below are the results from our computerized jaunt through the charts.


Foundational Function
While baseline results are not going to be the same as confirmation results because they measure things differently, it’s good to see that we were able to demonstrate much better results than what the default values could muster. W/L ratios went up in all instances, and each had a healthy number of trades. All in all, not too shabby. I’d buy that for a dollar. But you don’t have to.
Resources
It’s free. We promise. You just need to go get it from the library. When you’ve got yourself all set up in front of your charts, get it, HERE. It’ll have the word, “NEW” in red next to the name to help you find it. Also, be sure to subscribe to the Stonehill Forex YouTube channel for the technical analysis videos. Sign up for the Advanced NNFX Course HERE.
Our only goal is to make you a better trader.
*Our published testing results are based on money management strategies employed by the NNFX system and depend on varying external factors, which may be different between individuals and their specific broker conditions. No guarantee, trading recommendations, or other market suggestions are implied. Your results and subsequent trading activities are solely your own responsibility.
BTW — Any information communicated by Stonehill Forex Limited is solely for educational purposes. The information contained within the courses and on the website neither constitutes investment advice nor a general recommendation on investments. It is not intended to be and should not be interpreted as investment advice or a general recommendation on investment. Any person who places trades, orders or makes other types of trades and investments etc. is responsible for their own investment decisions and does so at their own risk. It is recommended that any person taking investment decisions consults with an independent financial advisor. Stonehill Forex Limited training courses and blogs are for educational purposes only, not a financial advisory service, and does not give financial advice or make general recommendations on investment.