Reverse Course
Everybody’s always talking about moving forward. Look to the future, keep on truck’in, full speed ahead, and so forth. What if someone turned that beat around and looked at it from a different angle. It just might make for an interesting view.
We Know a Guy
We know him, and many of you do too. Not personally, of course, but we’d love to share some quality time over an espresso or two. This profile comes courtesy from one of our faves; Mr. John Ehlers. Just when we thought we wouldn’t find any more of his gems, this confirmation indicator kind of popped up and said, “hello”.
Whatchoo Look’in At
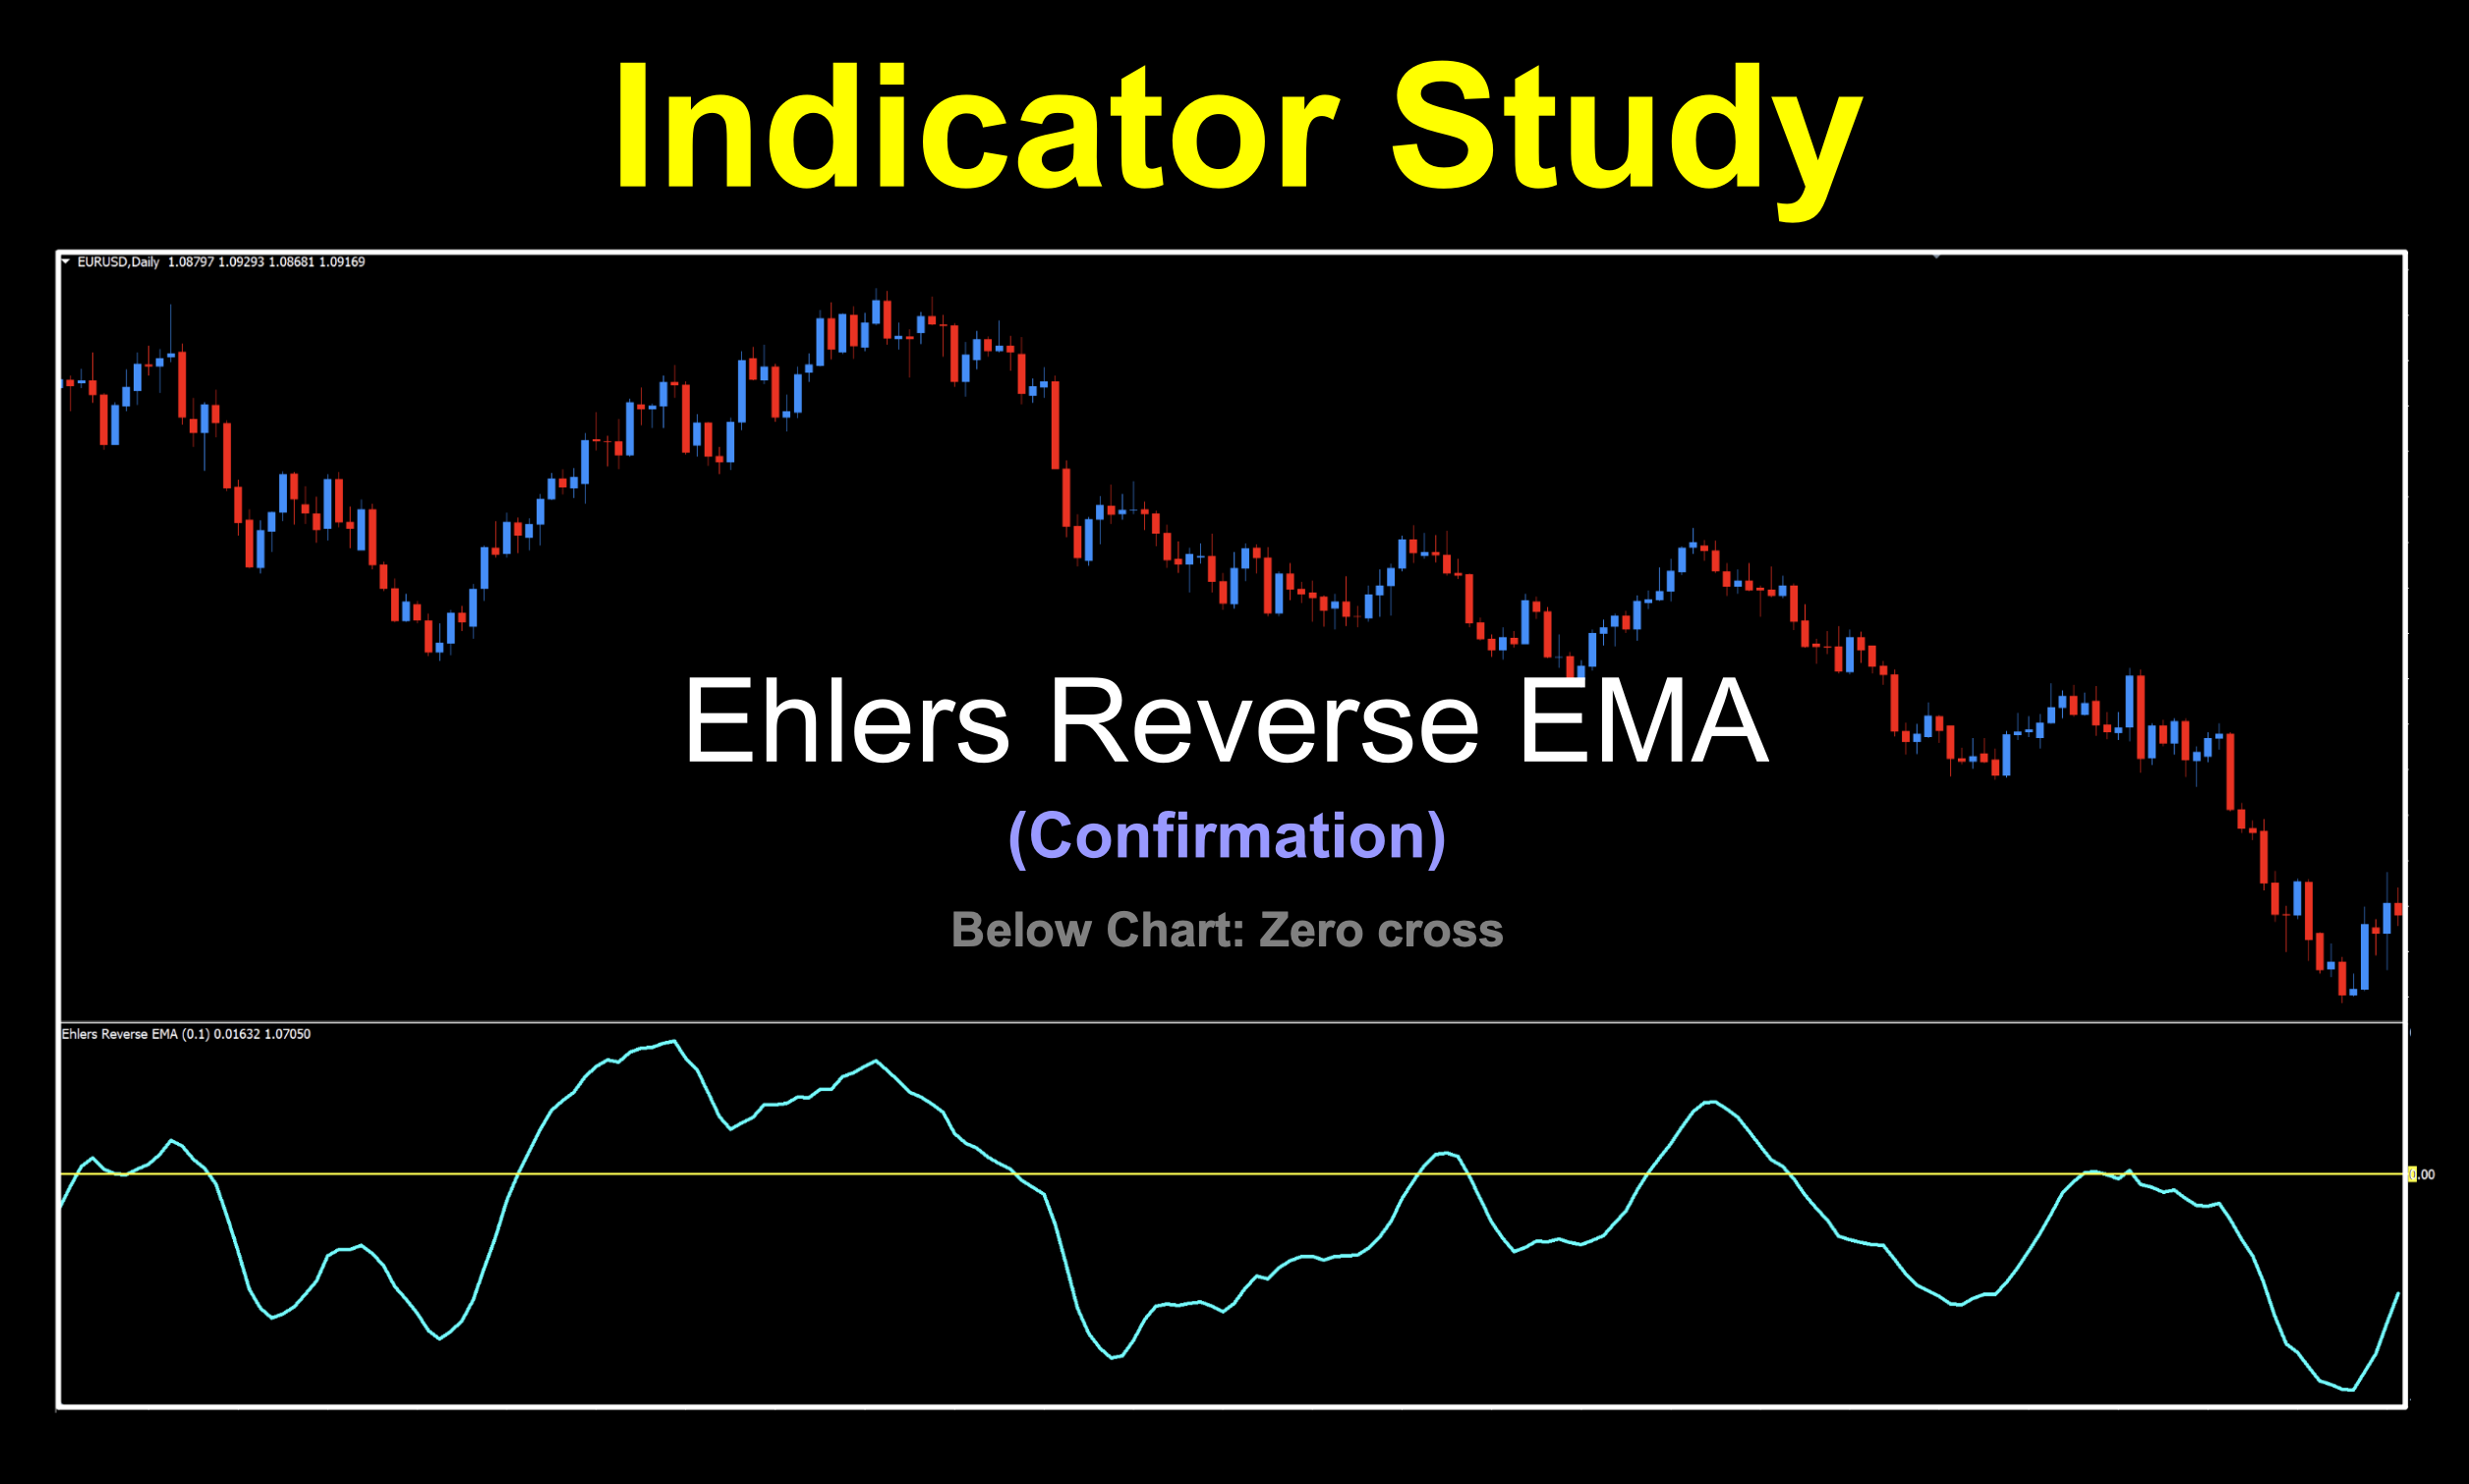
We’re looking at the Ehlers Reverse EMA that was recently published in the September 2017 Stocks and Commodities article titled “The Reverse EMA Indicator”. Now, sit back and take in the rest of the story.
Back That Thing Up
Reverse EMA (Exponential Moving Average) is a modification of the regular EMA. The premise is that an EMA affects specific market data frequencies. Reversing it attempts to remove the lag by including signal processing techniques such as Z-transform. Mr. Ehlers described this indicator as having “unique flexibility in that it can display trend or cycle information by varying th alpha parameter, and do this with very low lag.” Alrighty then…
It’s All About That Image
Above, is the stock image with a couple of minor tweaks. We thickened up the signal line and changed the zero line to yellow. From this initial view, we can see that this would fit nicely into the slower confirmation category, or C1, for your tool box.
Settings
This indicator only has two settings, and really just use one of them on a daily basis.
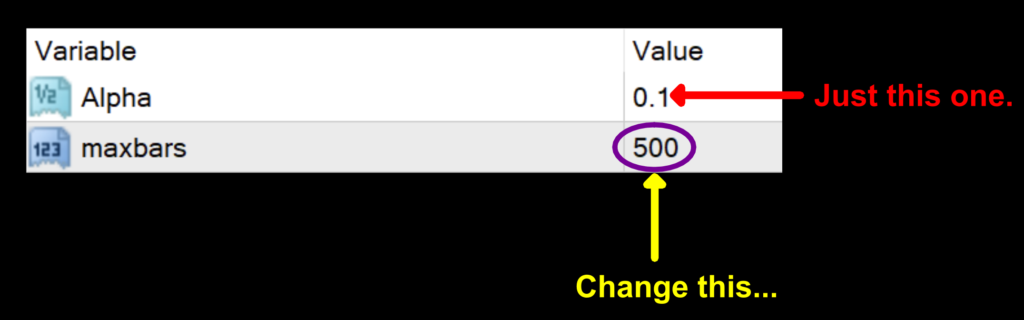
Alpha: The variable used in the internal calculations. The default value is 0.1 and the usable range is between 0 and 1.
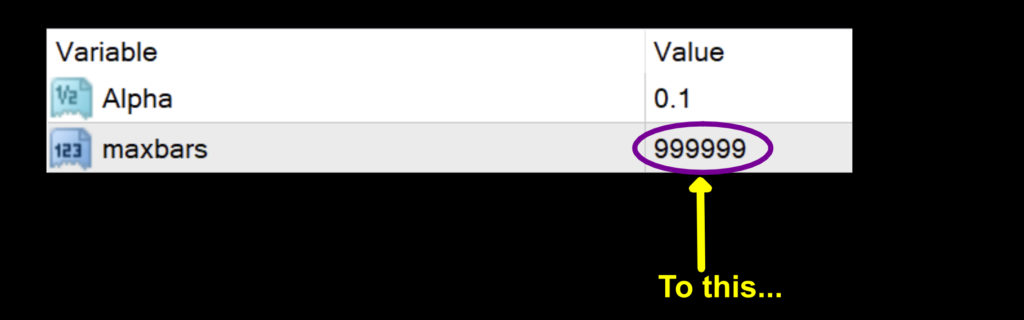
maxbars: This is the number of historical data periods the signal line will be printed to. The default value is 500, but just change this to “999999” to prevent any weird coding (and subsequent display) errors if back testing.
Daily Maintenance
Remember, once you’re ready to perform daily maintenance on your trades during the last 20–30 minutes of the trading day (1700 New York time), you’ll be presented with one of four options.
- Opening a trade.
- Closing a trade
- Maintaining a trade; i.e.
- Moving a stop loss level.
- Exiting a trade.
- Taking a pass (nothing to do).
Long: When the signal line crosses above zero.
Short: When the signal line crosses below zero.
Indicator Indication
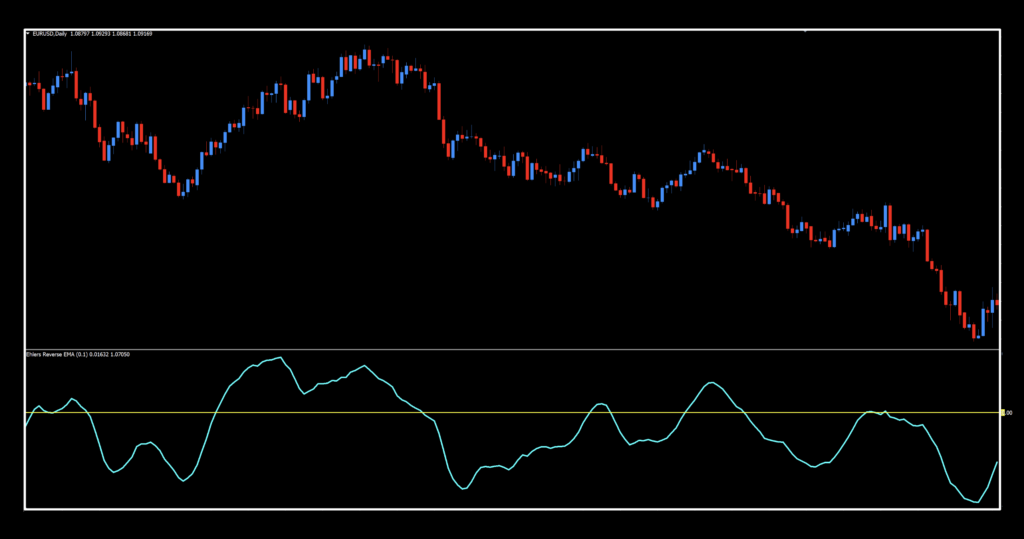
We plotted out the signals on the default value, but don’t skip onto the results just yet. We’ve got an added value benefit we’re going to discuss momentarily.
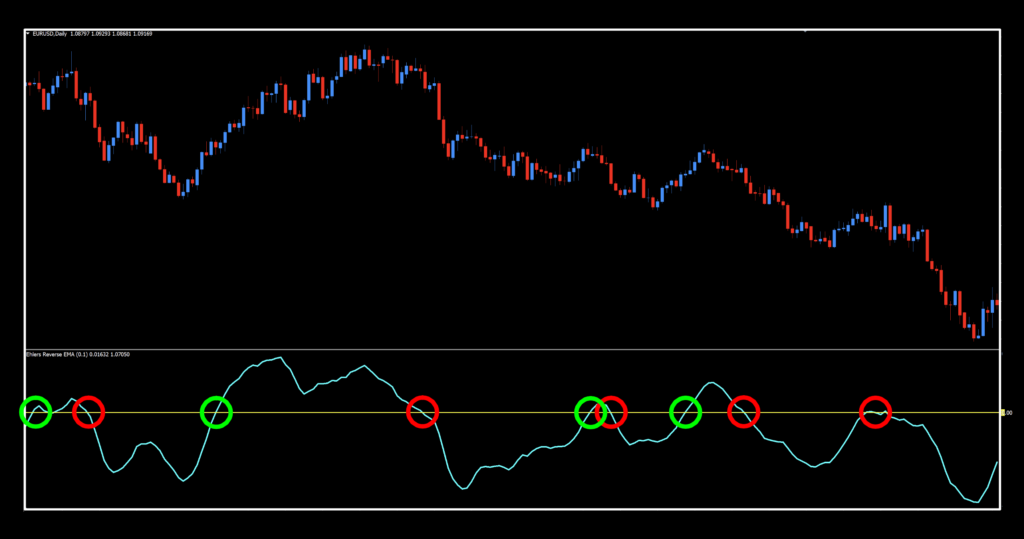
As noted earlier, this indicator makes for a nice C1. Over arching trends are included to keep you in longer and perhaps pulling more profit out of the market. Good stuff.
What if…
Okay, so we’ve got the reverse EMA. What if we were to plot a regular EMA on top of it? Kind of like an indicator sandwich. Well, it just so happens that we have the ability to do that with the MetaTrader platform. Totally bussin. Check this out…
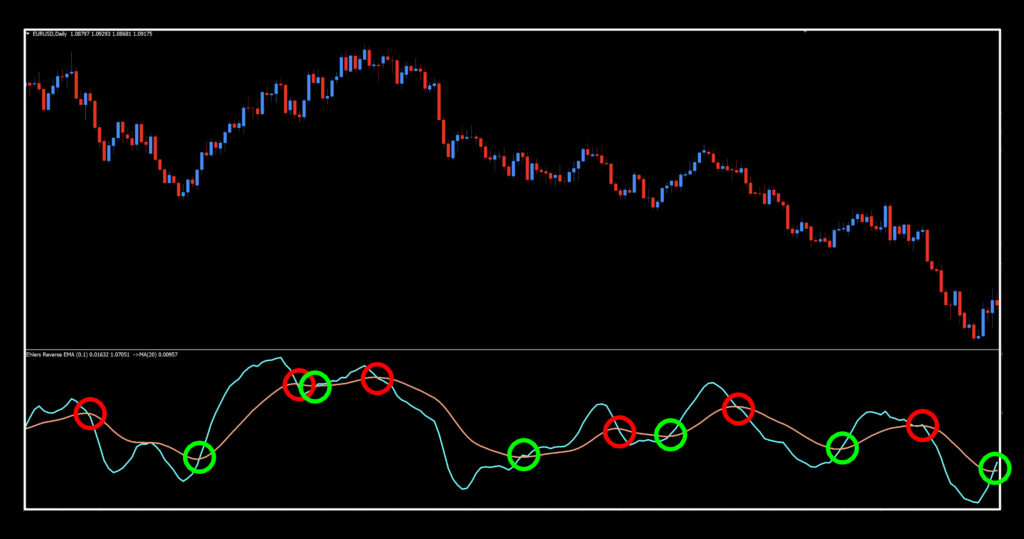
Okay, so what’s going on here? We kept the reverse EMA signal line (blue), overlaid an EMA(20) which is the reddish signal line, and removed the zero line. Now, it’s a below price, two lines cross.
I Spy With My Little Round Eye
What was the first thing you noticed? What we noticed is that it created a faster reacting signal than just the reverse EMA alone. Perhaps we might be able to use this combination as a C2 indicator. Food for thought, right? We do come up with some pretty neat stuff from time to time.
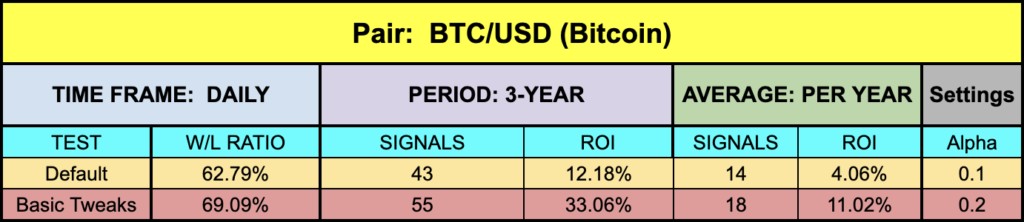
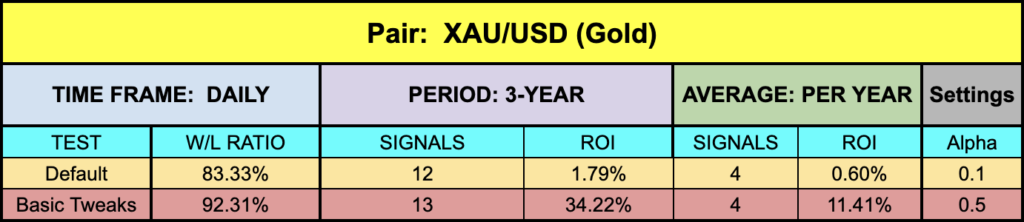
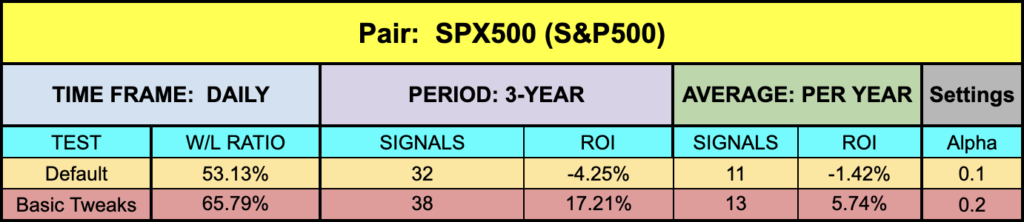
Indicator Testing: A New Look — Please Read
After receiving worldwide correspondence over the years and careful consideration, VP, and we here at Stonehill Forex decided to changed our testing protocol. Please read through the information below so you know how we will be testing from this point forward.
-
- Testing Time Frame: Daily.
- Testing span: Three (3) years.
- Price data: OPEN of period.
- Results: NNFX trade methodology (not the “quick” indicator testing methodology originally described in VP’s podcast from 2018).
- Based on the following criteria for all tested pairs:
- Beginning account balance — $100,000.
- Price data is from a live account.
- Risk profile — 2%.
- Leverage: 20:1.
- Two “half” trades per signal.
- Stop Loss/Take Profit levels are per NNFX:
- EUR/USD: SL = ATR x 1.50
- BTC/USD: SL = ATR x 1.25
- XAU/USD: SL = ATR x 1.25
- SPX500: SL = ATR x 1.50
- Continuation trades: Not included.
- Reported metrics:
- Signals: Total (long/short).
- Win/Loss %: Excluding “chalk” trades.***
- ROI%: Per NNFX.
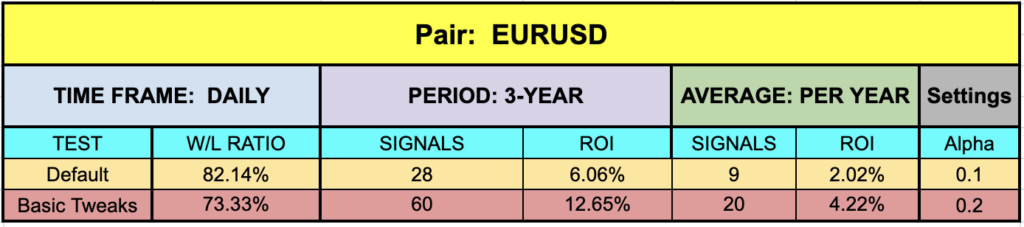
- Benchmark results: Default settings.
- Basic tweaks will suggest results, which try to avoid “curve fitting” or “over fitting”. You can read more about this in the Leman Trend indicator blog HERE.
*** Chalk trades are those trades where an exit (opposite signal) was given prior to price reaching either the take profit or stop loss level.
Lemon Twist
As we glance over the results, they’re actually not too bad. Some solid values and good win/loss ratios…so this one definitely has some promise. We haven’t run any back testing using it in conjunction with the “normal” EMA, but it might prove to be an interesting experiment. If anybody does try it, drop us an email so we can check it out.
Resources
Ehler’s latest to our collection can be found in the Stonehill Forex library for free. A “NEW ” notation next to the most recently profiled indicator will help you locate it. Give it a try and see how it does for you. It can be downloaded, HERE. Also, be sure to subscribe to the Stonehill Forex YouTube channel for the technical analysis videos. Sign up for the Advanced NNFX Course HERE.
Our only goal is to make you a better trader.
*Our published testing results are based on money management strategies employed by the NNFX system and depend on varying external factors, which may be different between individuals and their specific broker conditions. No guarantee, trading recommendations, or other market suggestions are implied. Your results and subsequent trading activities are solely your own responsibility.
BTW — Any information communicated by Stonehill Forex Limited is solely for educational purposes. The information contained within the courses and on the website neither constitutes investment advice nor a general recommendation on investments. It is not intended to be and should not be interpreted as investment advice or a general recommendation on investment. Any person who places trades, orders or makes other types of trades and investments etc. is responsible for their own investment decisions and does so at their own risk. It is recommended that any person taking investment decisions consults with an independent financial advisor. Stonehill Forex Limited training courses and blogs are for educational purposes only, not a financial advisory service, and does not give financial advice or make general recommendations on investment.