Frampton Comes Alive
Wandering minds rule. It demonstrates that we tend to think out of the box. Of course, if you “squirrel” too often, you may lose track of what you were doing and that can open up a whole can of “wait, what”? That being the case, every time we came across this name, we immediately thought of this guy.

On a Roll
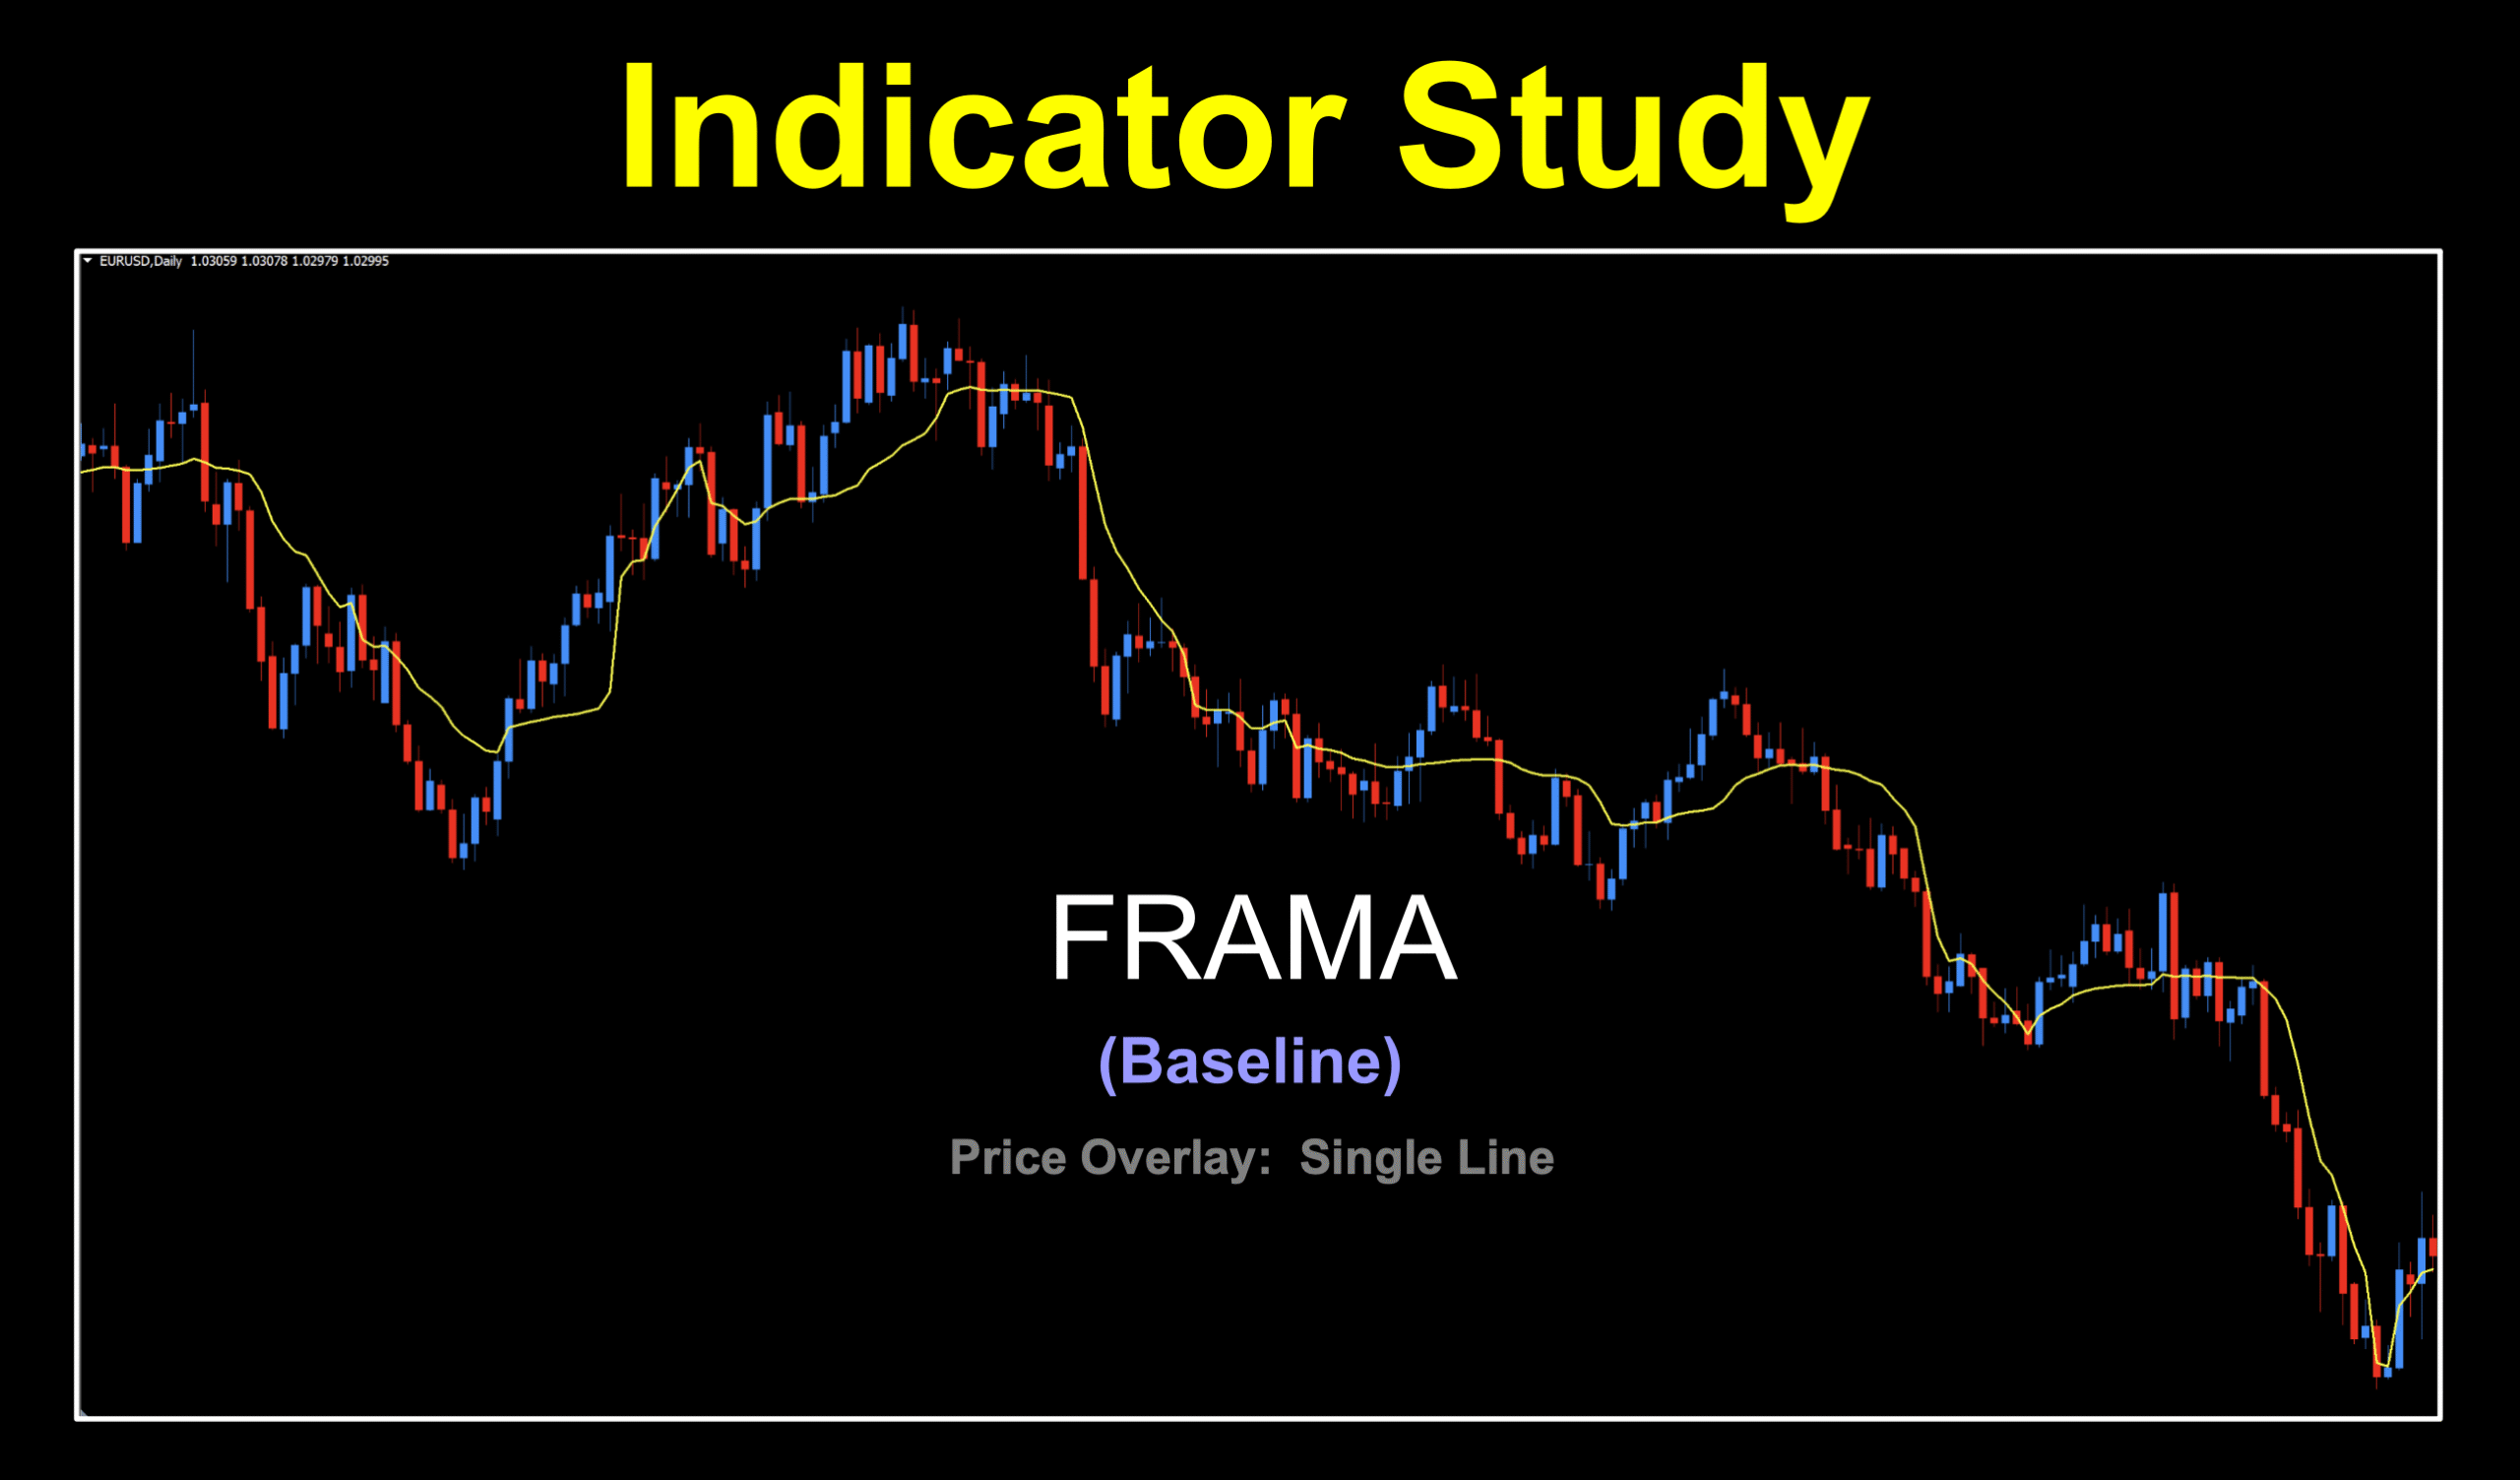
However, I doubt there’s much of a correlation between a 70s rocker and trading. In fact, we’re on a different kind of roll, fearing another special tool from a well known guy we all admire and love. The guy I’m referring to is from our main man, John Ehlers. It’s called FRAMA, or Fractal Adaptive Moving Average.
Fractally Delicious
FRAMA was first discussed by Mr. Ehlers in his 2001 book named, “Rocket Science for Traders” which in itself is a pretty cool title. The premise of the FRAMA includes the following properties;
- It uses an EMA (Exponential Moving Average) calculation with a dynamically adjusted smoothing factor.
- The smoothing factor is based on the fractal dimensions of the price series (past prices).
- Reacts quickly to trends and slows down during consolidation.
A Different View
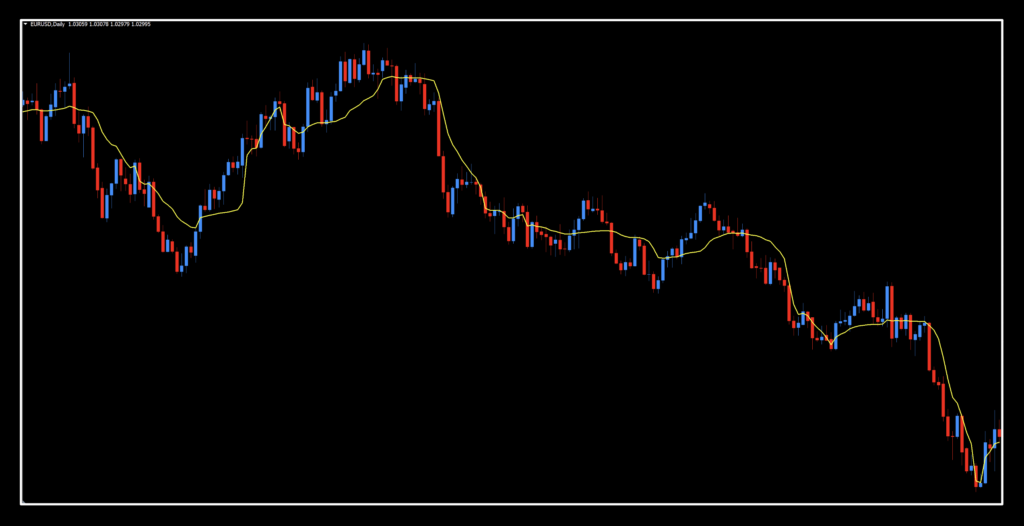
The original color is a dark blue line so naturally, we brightened up with a cheery lemon yellow.
A definite departure from the “normal” looking baseline, we can see that the default values can create a line that hugs price rather close in some areas. But we’ll roll with it for our illustrative purposes.
Math for Braniacs
FRAMAt = At X Pricet + (1 – At) X FRAMA(t-1)
Where:
FRAMAt = Current value of FRAMA
Pricet = Current Price
FRAMA(t-1) = Previous Value of FRAMA
At (exponential smoothing factor) = EXP[-4.6 X (Dt – 1)]
Where:
Dt = Current fractal dimension;
EXP = Mathematical exponent function.
But as Director Clint Eastwood says at the conclusion of a movie scene…”that’s enough of that.”
Settings
This indicator only has two settings, and we use both of them.
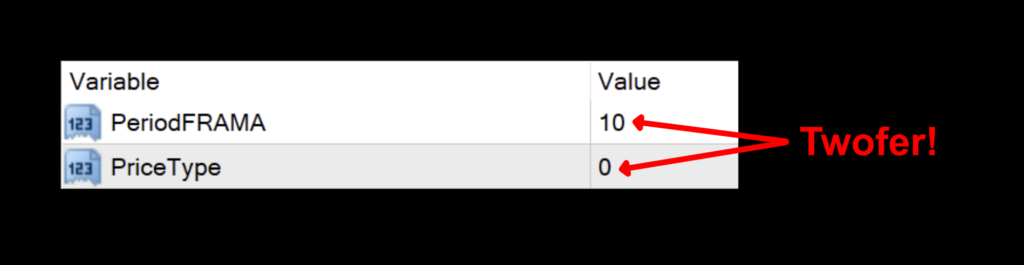
PeriodFRAMA: The number of periods used in the internal calculations. The default value is 10.
PriceType: The price data set on which the calculations are performed. The default setting is 0.
1: Close
2: Open
3: High
4: Low
5: Typical
6: Weighted
Daily Maintenance
Remember, once you’re ready to perform daily maintenance on your trades during the last 20–30 minutes of the trading day (1700 New York time), you’ll be presented with one of four options.
- Opening a trade.
- Closing a trade
- Maintaining a trade; i.e.
- Moving a stop loss level.
- Exiting a trade.
- Taking a pass (nothing to do).
How We Use It
Long: When price crosses above the signal line.
Short: When price crosses below the signal line.
Signals to Live By
In the spirit of demonstrating something useful, we’ll just double the period to 20 (from 10) to better illustrate the signals.
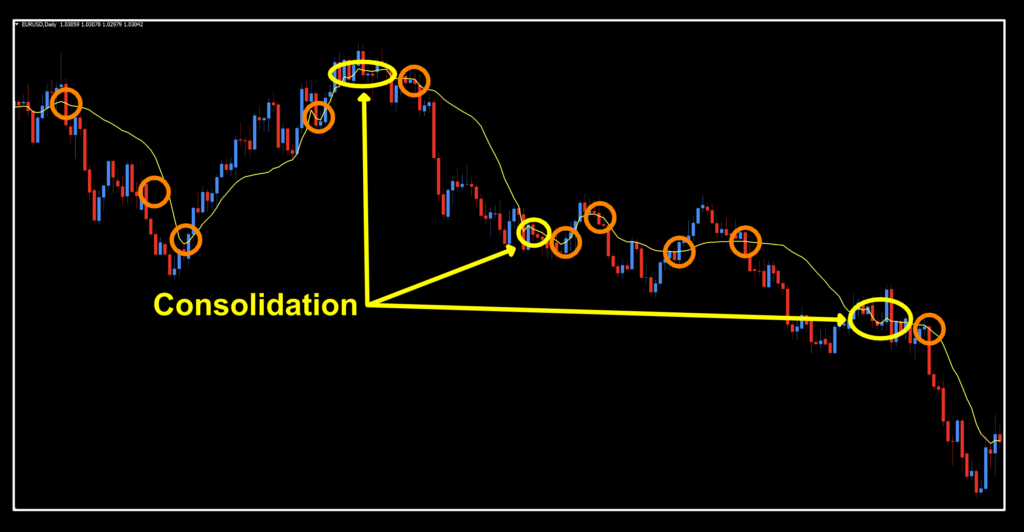
Notice that when price loses volatility and begins to flatten out, the indicator reacts accordingly and remains close to price action. This is the magic at work by telling you that there is no trend. For testing, we’ll be using the default settings to see how the indicator does in it’s “natural” state before optimizing.
Indicator Testing: A New Look — Please Read
After receiving worldwide correspondence over the years and careful consideration, VP, and we here at Stonehill Forex decided to changed our testing protocol. Please read through the information below so you know how we will be testing from this point forward.
-
- Testing Time Frame: Daily.
- Testing span: Three (3) years.
- Price data: OPEN of period.
- Results: NNFX trade methodology (not the “quick” indicator testing methodology originally described in VP’s podcast from 2018).
- Based on the following criteria for all tested pairs:
- Beginning account balance — $100,000.
- Price data is from a live account.
- Risk profile — 2%.
- Leverage: 20:1.
- Two “half” trades per signal.
- Stop Loss/Take Profit levels are per NNFX:
- EUR/USD: SL = ATR x 1.50
- BTC/USD: SL = ATR x 1.25
- XAU/USD: SL = ATR x 1.25
- SPX500: SL = ATR x 1.50
- Continuation trades: Not included.
- Reported metrics:
- Signals: Total (long/short).
- Win/Loss %: Excluding “chalk” trades.***
- ROI%: Per NNFX.
- Benchmark results: Default settings.
- Basic tweaks will suggest results, which try to avoid “curve fitting” or “over fitting”. You can read more about this in the Leman Trend indicator blog HERE.
*** Chalk trades are those trades where an exit (opposite signal) was given prior to price reaching either the take profit or stop loss level.The Main Event
Below are the results from our updated testing protocol.
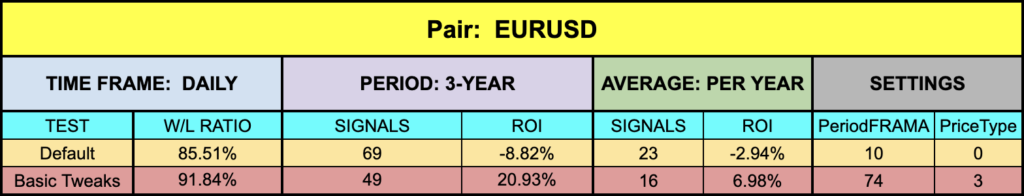
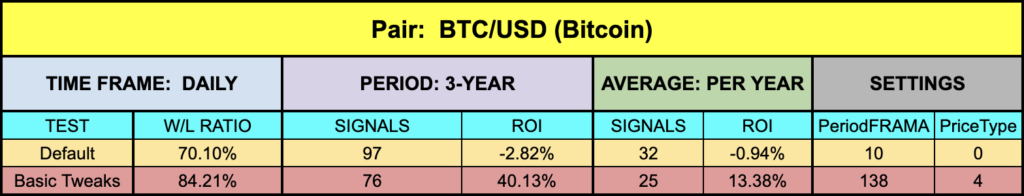
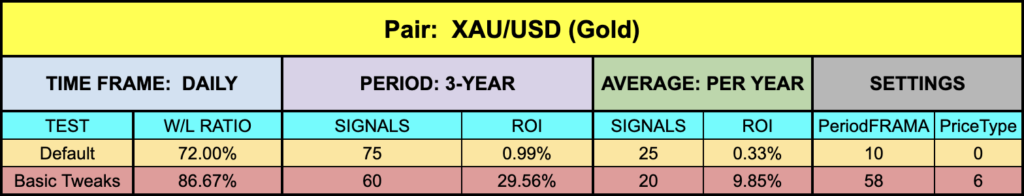
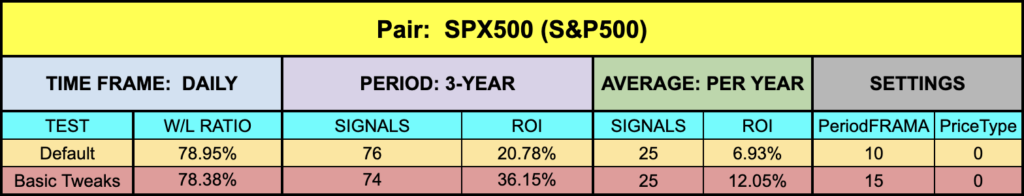
First Things First
Looking at the metrics, we want you to remember a few things. First, the results are over three years, not just one year, so there is considerably more market “flex” which affects the results. Second, this is only one part of your algorithm. Third, this is a baseline, which is “handled” differently than a confirmation or volume indicator. That being the case, a trade based on a particular signal could have resulted in varying degrees of success or failure because we don’t generally use baselines as exit indicators.
Translation
Do not base your expectation solely on the numbers we present. Individual results can and will vary…and they can definitely be much better than we post. We’re just bringing you indicators that are not part of the mainstream crowd.
Resources
This indicator can be found in the Stonehill Forex library for free. Going forward, we will note“ NEW ” next to the most recently profiled indicator to help you locate it. We don’t post many baselines, so give this oddball a try and see how it does for you by getting it HERE. Also, be sure to subscribe to the Stonehill Forex YouTube channel for the technical analysis videos. Sign up for the Advanced NNFX Course HERE.
Our only goal is to make you a better trader.
*Our published testing results are based on money management strategies employed by the NNFX system and depend on varying external factors, which may be different between individuals and their specific broker conditions. No guarantee, trading recommendations, or other market suggestions are implied. Your results and subsequent trading activities are solely your own responsibility.
BTW — Any information communicated by Stonehill Forex Limited is solely for educational purposes. The information contained within the courses and on the website neither constitutes investment advice nor a general recommendation on investments. It is not intended to be and should not be interpreted as investment advice or a general recommendation on investment. Any person who places trades, orders or makes other types of trades and investments etc. is responsible for their own investment decisions and does so at their own risk. It is recommended that any person taking investment decisions consults with an independent financial advisor. Stonehill Forex Limited training courses and blogs are for educational purposes only, not a financial advisory service, and does not give financial advice or make general recommendations on investment.