Second Generation
Indicators, on occasion, go through some degree of evolution. Not many, but there are some which created such a stir when developed that over the years, insightful folks found a way to make them more responsive, more accurate, and even more flexible with regard to internal variables.
A Modest Start
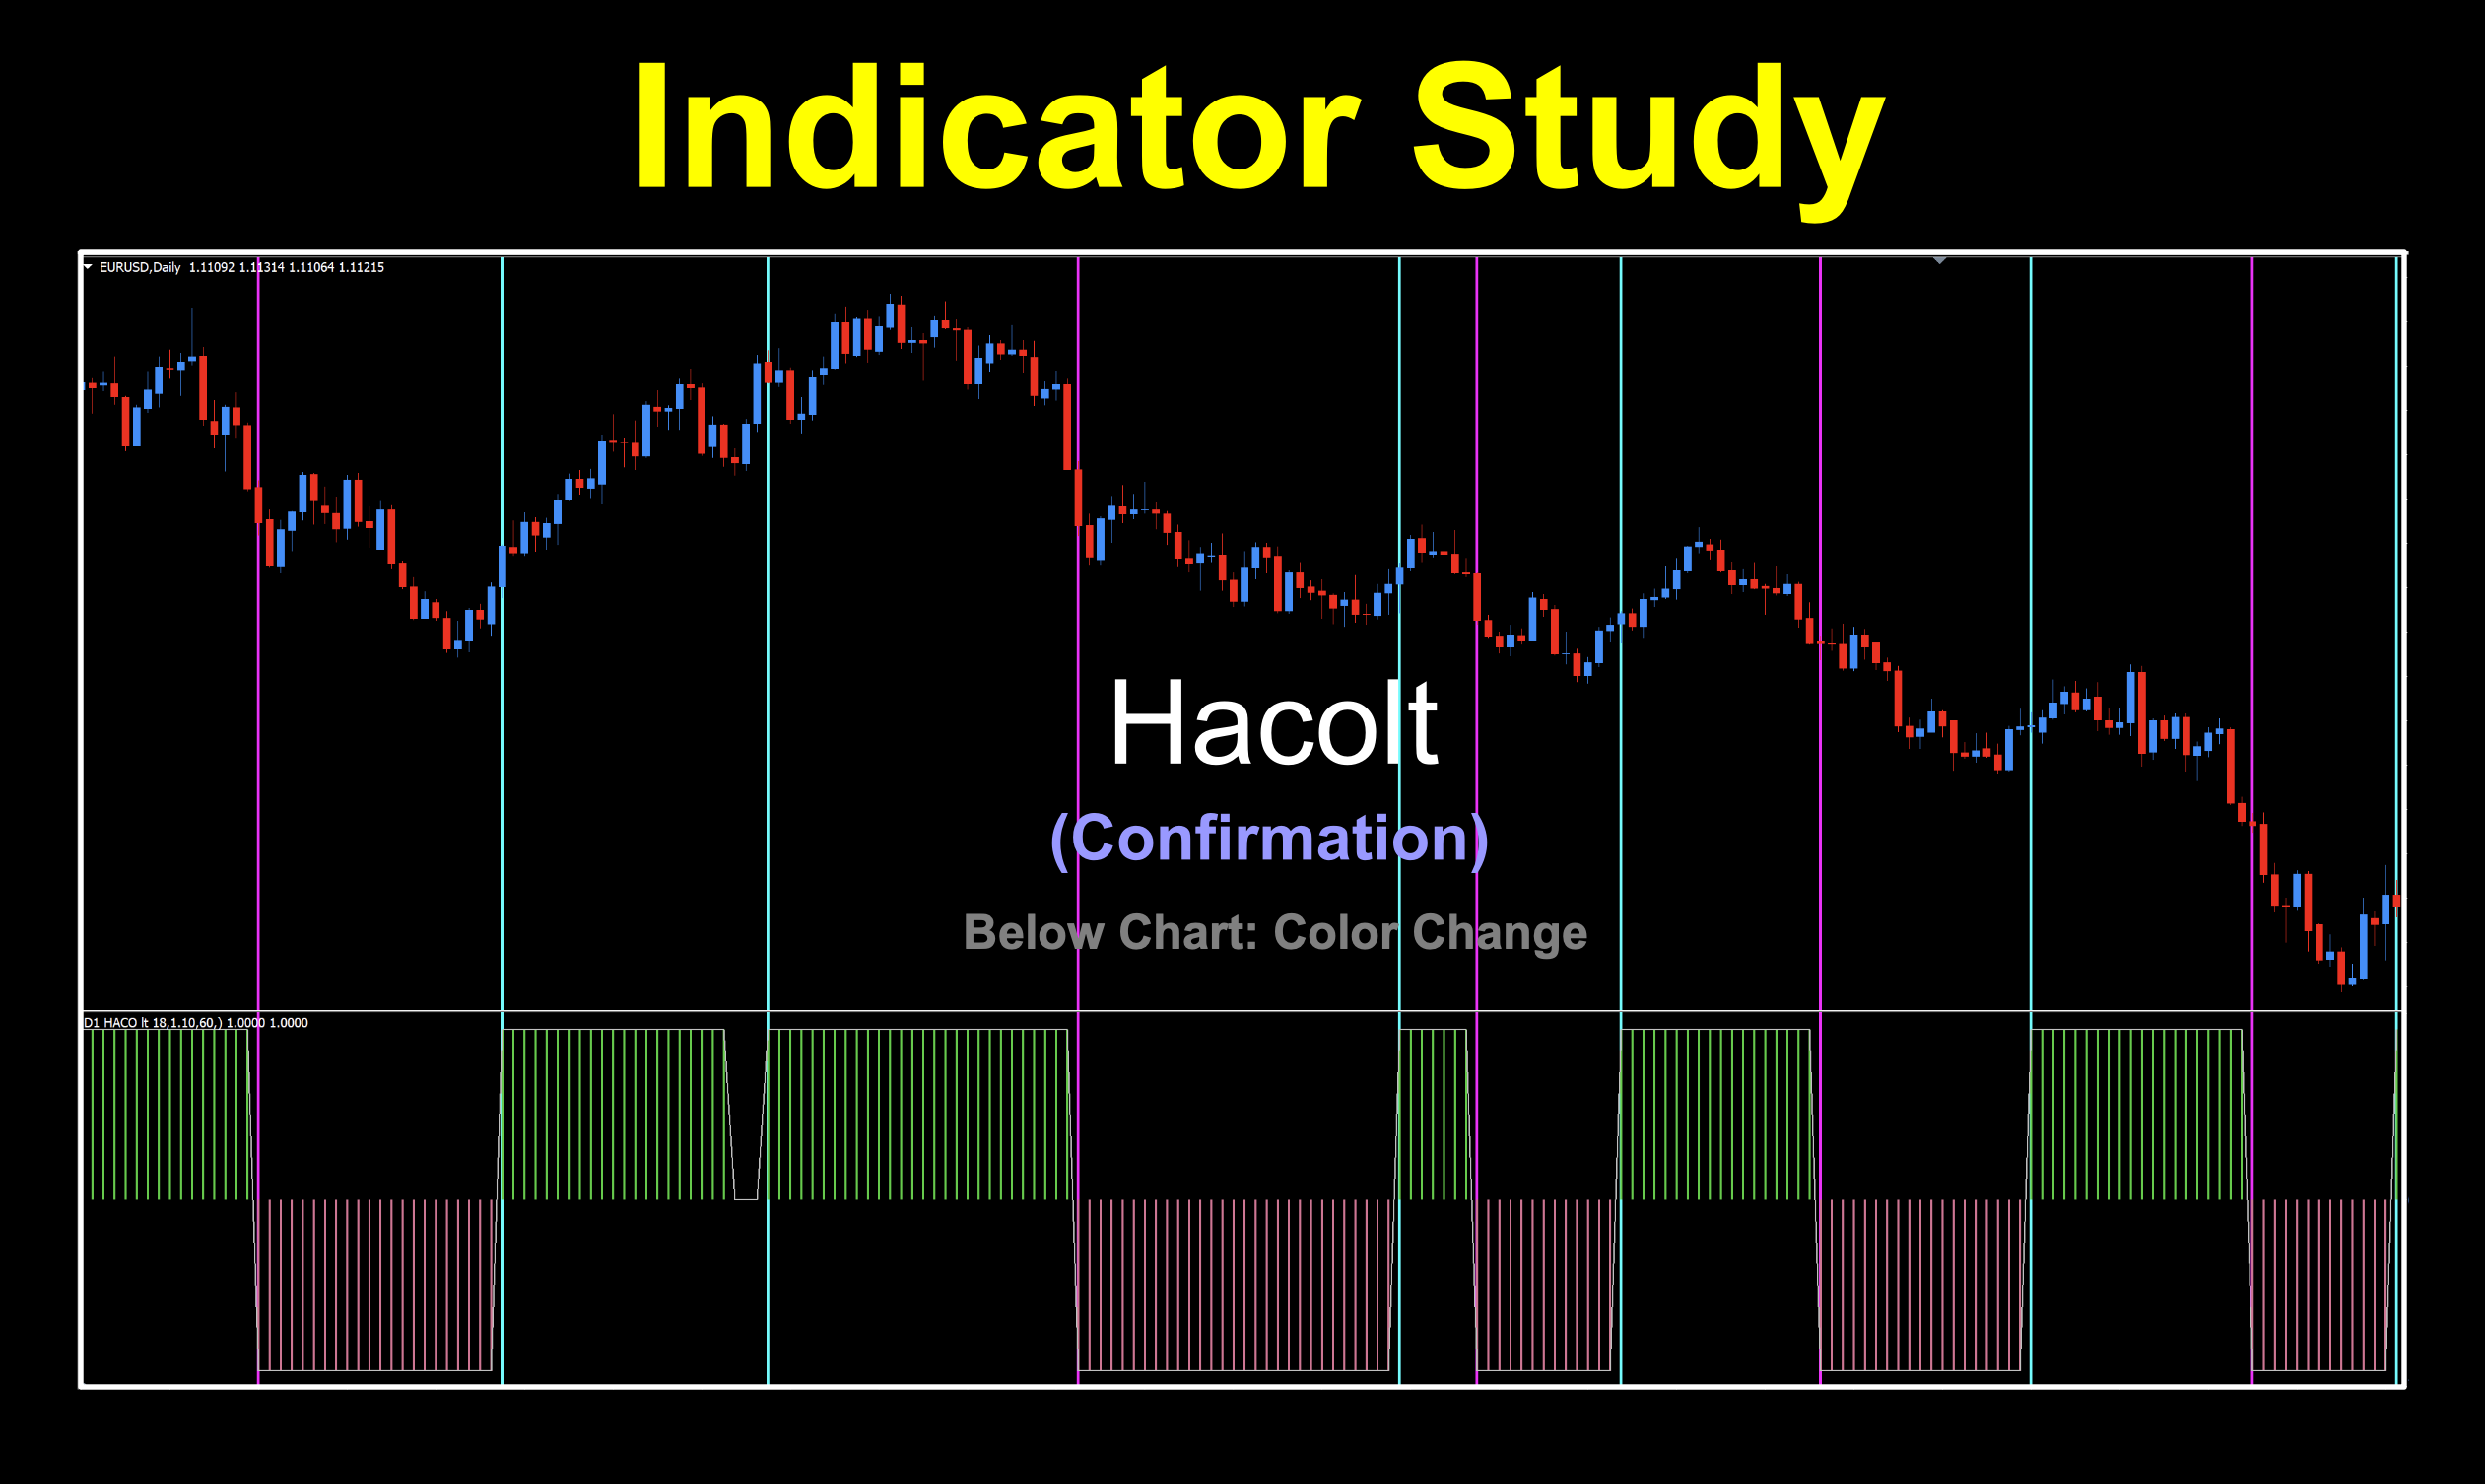
This is one of those instances. We’ve got something called the Hacolt which stands for Heikin Ashi Candles Oscillator Long Term. It’s a second generation version, evolved from the original Heiken Ashi. It comes from an esteemed gentleman named Sylvain Vervoot who got his start back in 1979 using a Tandy TRS80 computer. Anybody who knows about the “Trash-80” understands that these were humble beginnings.
Beginnings
The Hacolt is based on Sylvain Vervoort’s previous indicator, HACO (Heikin-Ashi Candles Oscillator), which was described in his article “Trading with the Heikin-Ashi Candlestick Oscillator” for the December 2008 issue of Technical Analysis of Stocks & Commodities magazine. So, the evolved version from the original concept was further evolved for us in 2012.
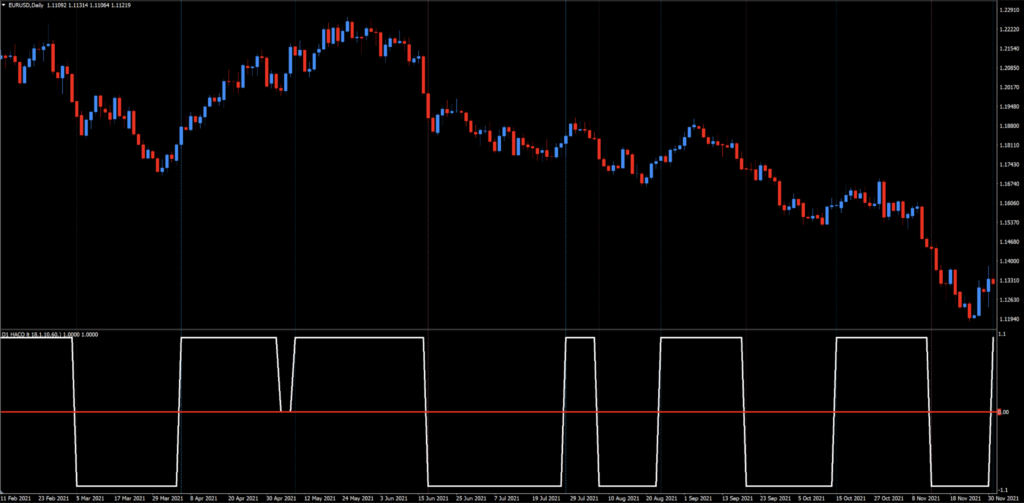
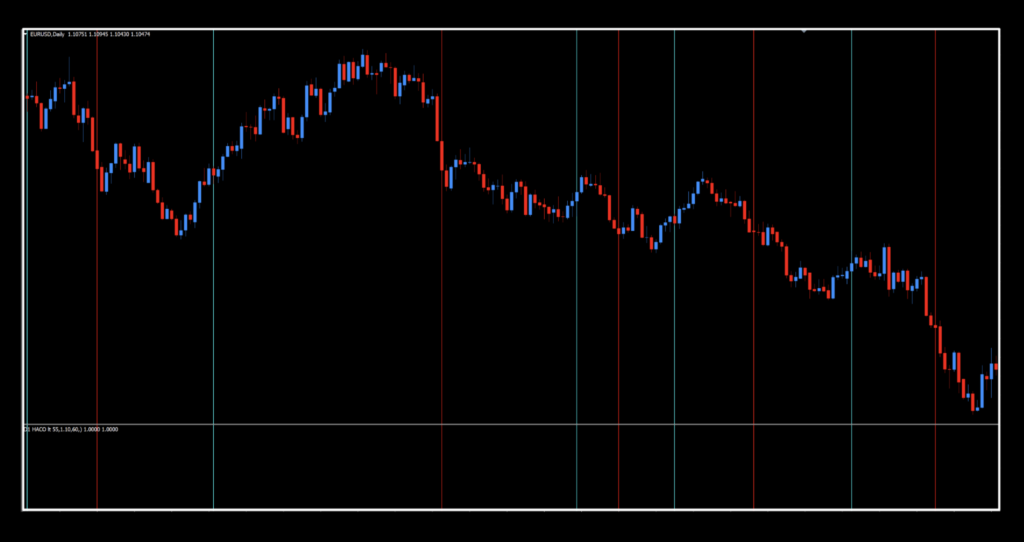
You could also remove the blinding colors and just have a simple zero cross line, as noted below, by changing the histogram colors to “none”.
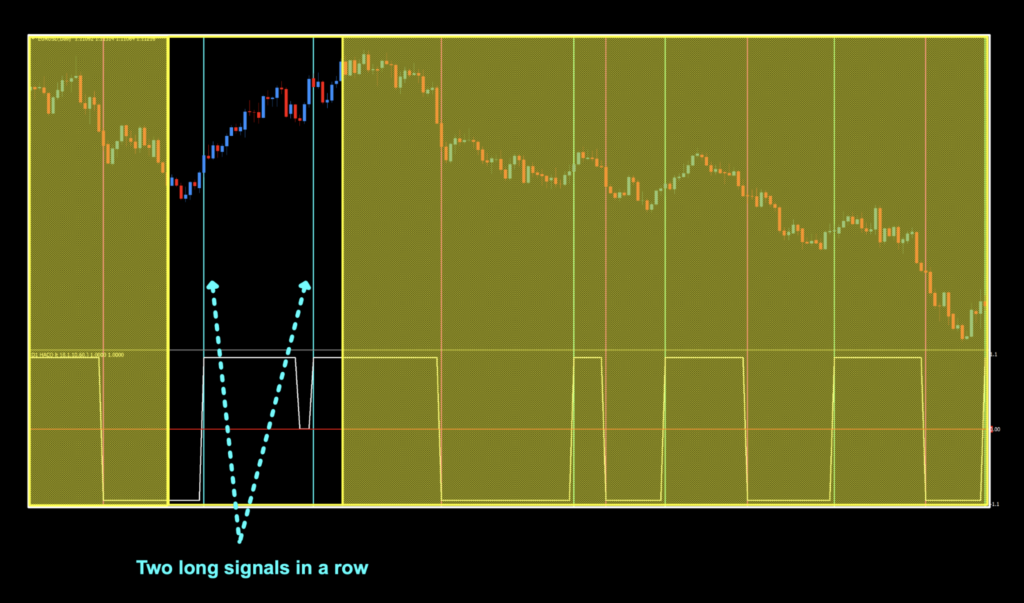
But on further examination when changing the settings, we noticed that there were “gaps” where no signal were given, as in the image below and noted in yellow.
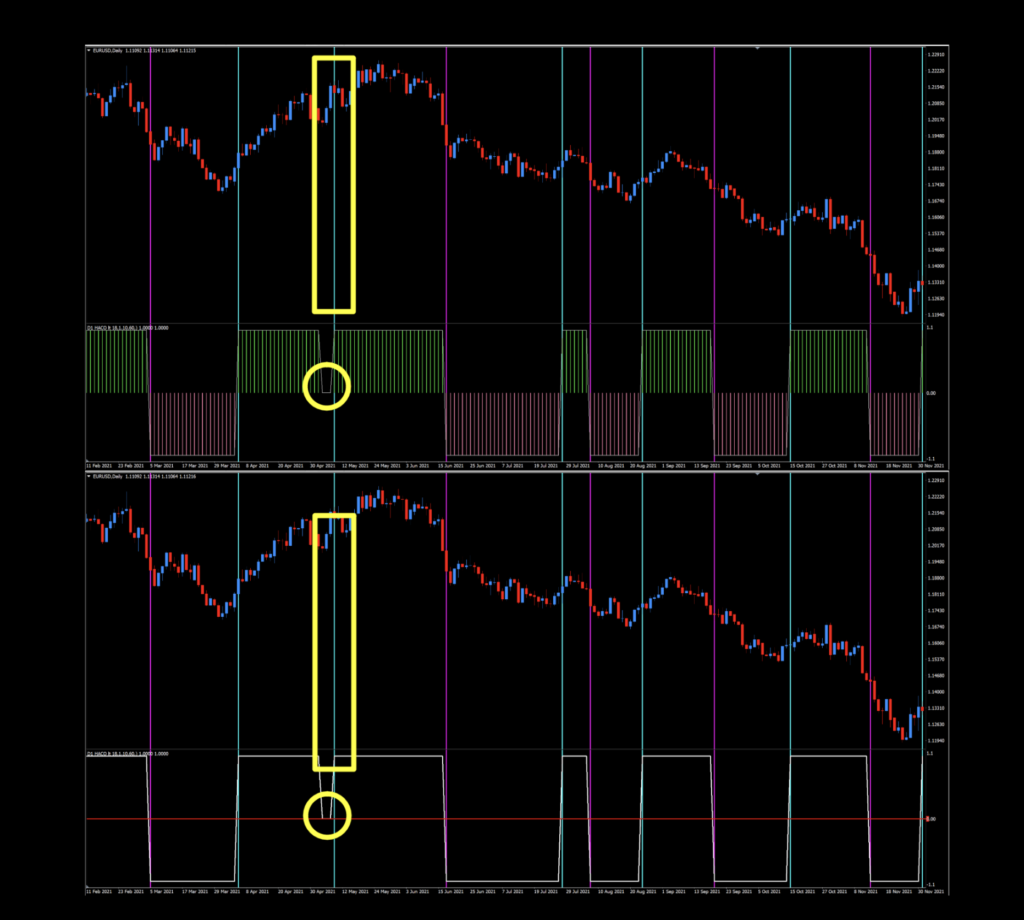
That being the case, the signals were not always equal numbers of long and short.
What’s it Mean?
What it means is that this indicator is best served as a color change, not as a zero cross…which is how we tested it.
Noice!
Another cool feature of this indicator is that it prints the signal as a vertical line for you, meaning there’s no guessing. So you can tweak this indicator to have multiple visual appearances. You can even remove everything except the alert lines which, coincidently, are the long and short signals.
Settings
There are a host of settings, some useful and some not, so we’ll go through what we think are relevant. Naturally, you may find others useful and that’s certainly your prerogative, Bobby…
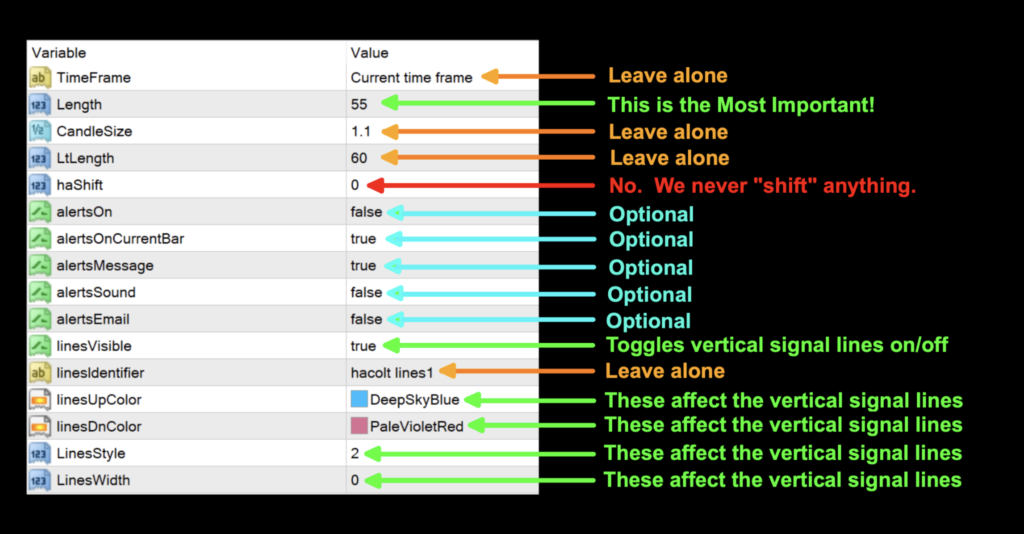
Length: The main setting of the indicator. The default setting is 55.
haShift: This shifts the signals back and forth in time by a specified number of periods. We never shift anything, so just leave this at the default value of 0.
linesVisible: This toggles the vertical signal lines on and off, depending on if you want to see them. The default value is “true”; i.e., toggled on so you’ll see them.
linesUpColor/linesDnColor: These change the color of how you want to display long and short signal.
LinesStyle: This changes the type of vertical line you want from solid to varying degrees of dots and dashes. The default value is 2 — dotted (a solid line is 0).
LinesWidth: Controls how thick the vertical signal line displays. The default value is 2.
How we use it.
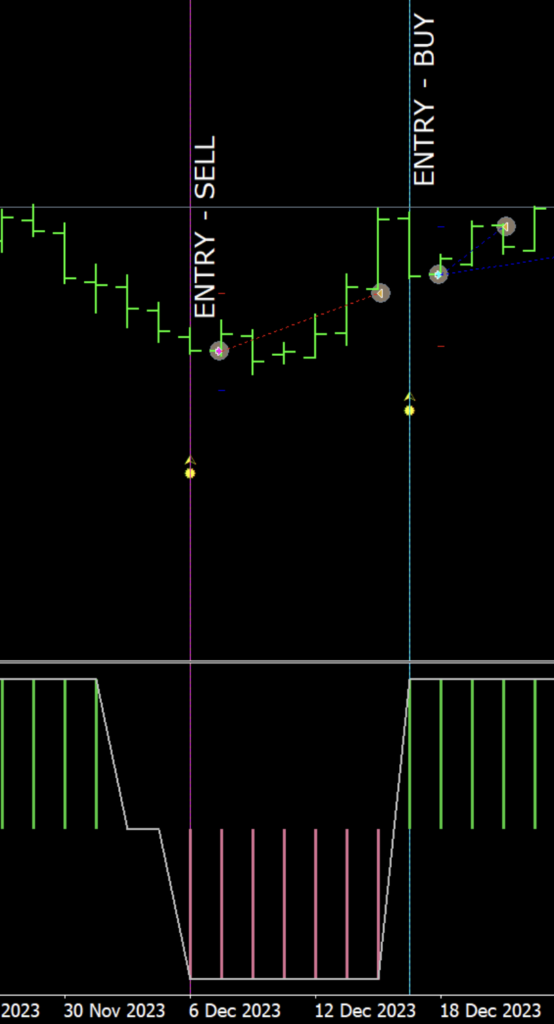
One of three actions need to happen in the last 30 minutes prior to the close of the trading day. They are; opening, maintaining, or closing, a position. This is when you make your trading decisions, and not actually wait for the close at 1700 EST, because we trade on the daily time frame.
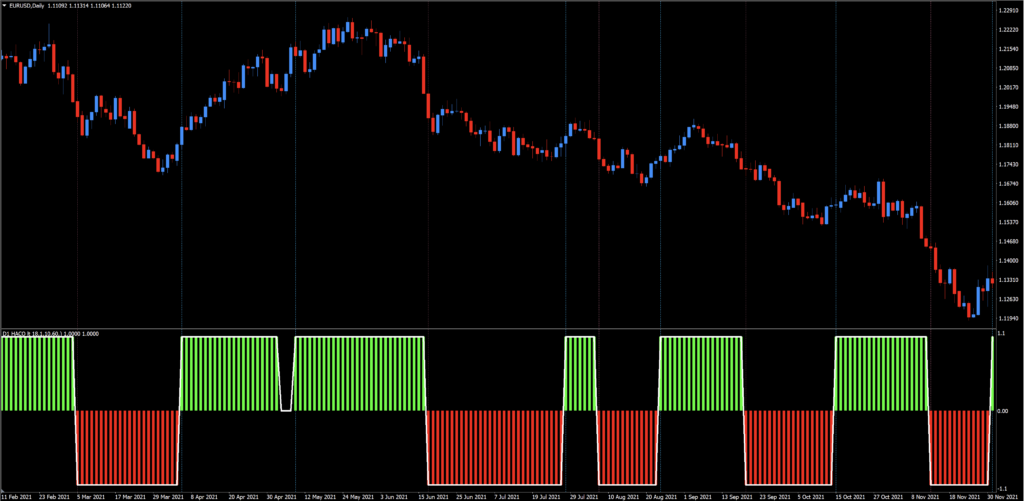
Long: When either the vertical signal line or histogram line is green. Entry is in the last 30 minutes of the trading day.
Short: When the vertical signal line or histogram line is red. Entry is in the last 30 minutes of the trading day.
Redundant
We’ll repost the image from above with our customary yellow circles, so there’s absolutely no miscommunication of where the signals are.
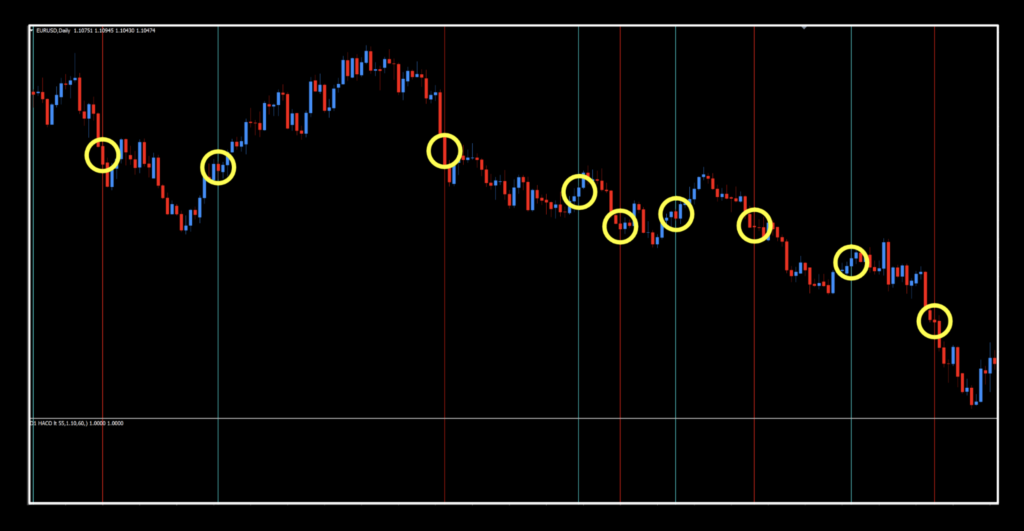
Our signals weren’t that bad on the default settings. Granted, 55 is a bit long with regard to the number of periods for consideration, so fooling with the length may improve on the results.
The Results
If you’re new to these studies, we recommend looking at some older blogs to understand how we conduct our testing.
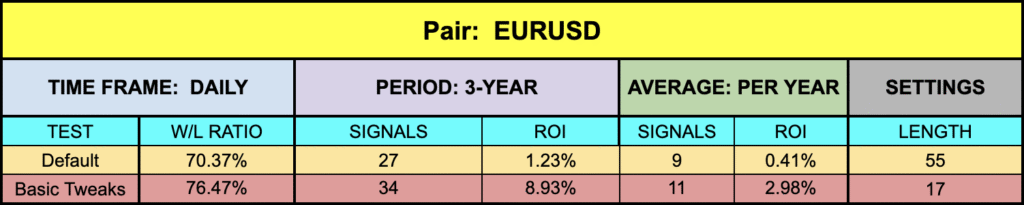
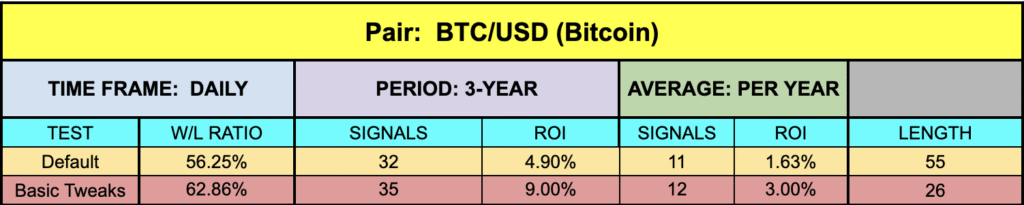
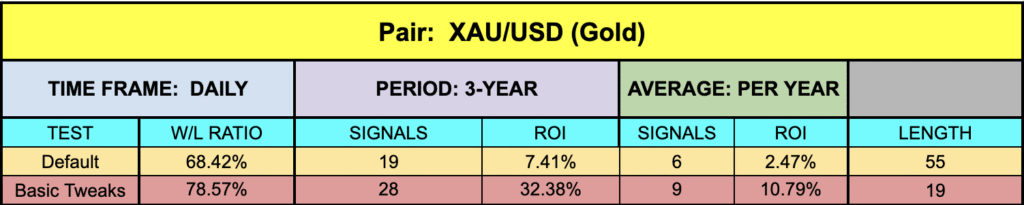
Below is the data from our testing.
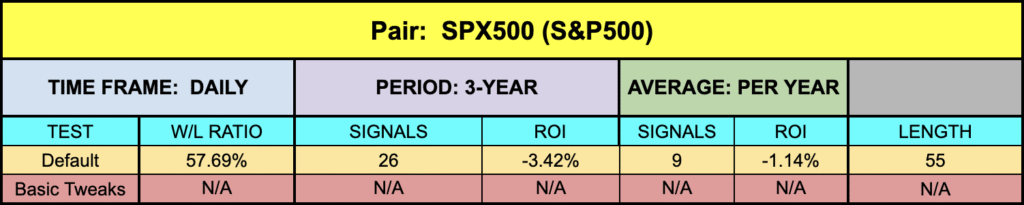
The Commentary
Overall, a smidge soft across the board, but hey, it is what it is. What makes this interesting to consider is that it’s based on the Heikin Ashi — a well established and competent indicator. Granted, market conditions can shade its potential — but that can only be determined by fooling around with it. With all the markets we look at, there’s literal gold that can be had. One note — the SPX500 did not return any profitable data and that happens. It’s totally fine and happens on occasion. Remember our analysis on the EUR/NZD from a couple of weeks ago?
Resources
You can download this indicator for free from our library, HERE. Also, be sure to subscribe to the Stonehill Forex YouTube channel for the technical analysis videos. Sign up for the Advanced NNFX Course HERE.
Our only goal is to make you a better trader.
*Our published testing results are based on money management strategies employed by the NNFX system and depend on varying external factors, which may be different between individuals and their specific broker conditions. No guarantee, trading recommendations, or other market suggestions are implied. Your results and subsequent trading activities are solely your own responsibility.
BTW — Any information communicated by Stonehill Forex Limited is solely for educational purposes. The information contained within the courses and on the website neither constitutes investment advice nor a general recommendation on investments. It is not intended to be and should not be interpreted as investment advice or a general recommendation on investment. Any person who places trades, orders or makes other types of trades and investments etc. is responsible for their own investment decisions and does so at their own risk. It is recommended that any person taking investment decisions consults with an independent financial advisor. Stonehill Forex Limited training courses and blogs are for educational purposes only, not a financial advisory service, and does not give financial advice or make general recommendations on investment.