Victim of Changes
Change is a natural phenomenon we all experience. It’s inevitable. Even in trading. Think back to when you started your journey. Your mindset, methodologies, psychology, and a host of other factors are not the same as when you started. The same thing happens on a micro level with an indicator’s reaction to price. Nothing is ever static in the market; meaning, price moves and with that, indicators too. Those are the sad wings of destiny. Roll with change, and you’ll do just fine.

Let’s go to the videotape…
What’s The Rate
We’re going to look at an oscillating indicator which is based on the Rate of Change (ROC); however, it is smoothed twice with a custom exponential moving average process. Additionally, this indicator is “normalized” which means it is then calculated as the ratio of the difference between the raw indicator value and the average divided by the standard deviation. Intoxicating stuff.
It’s in a Name

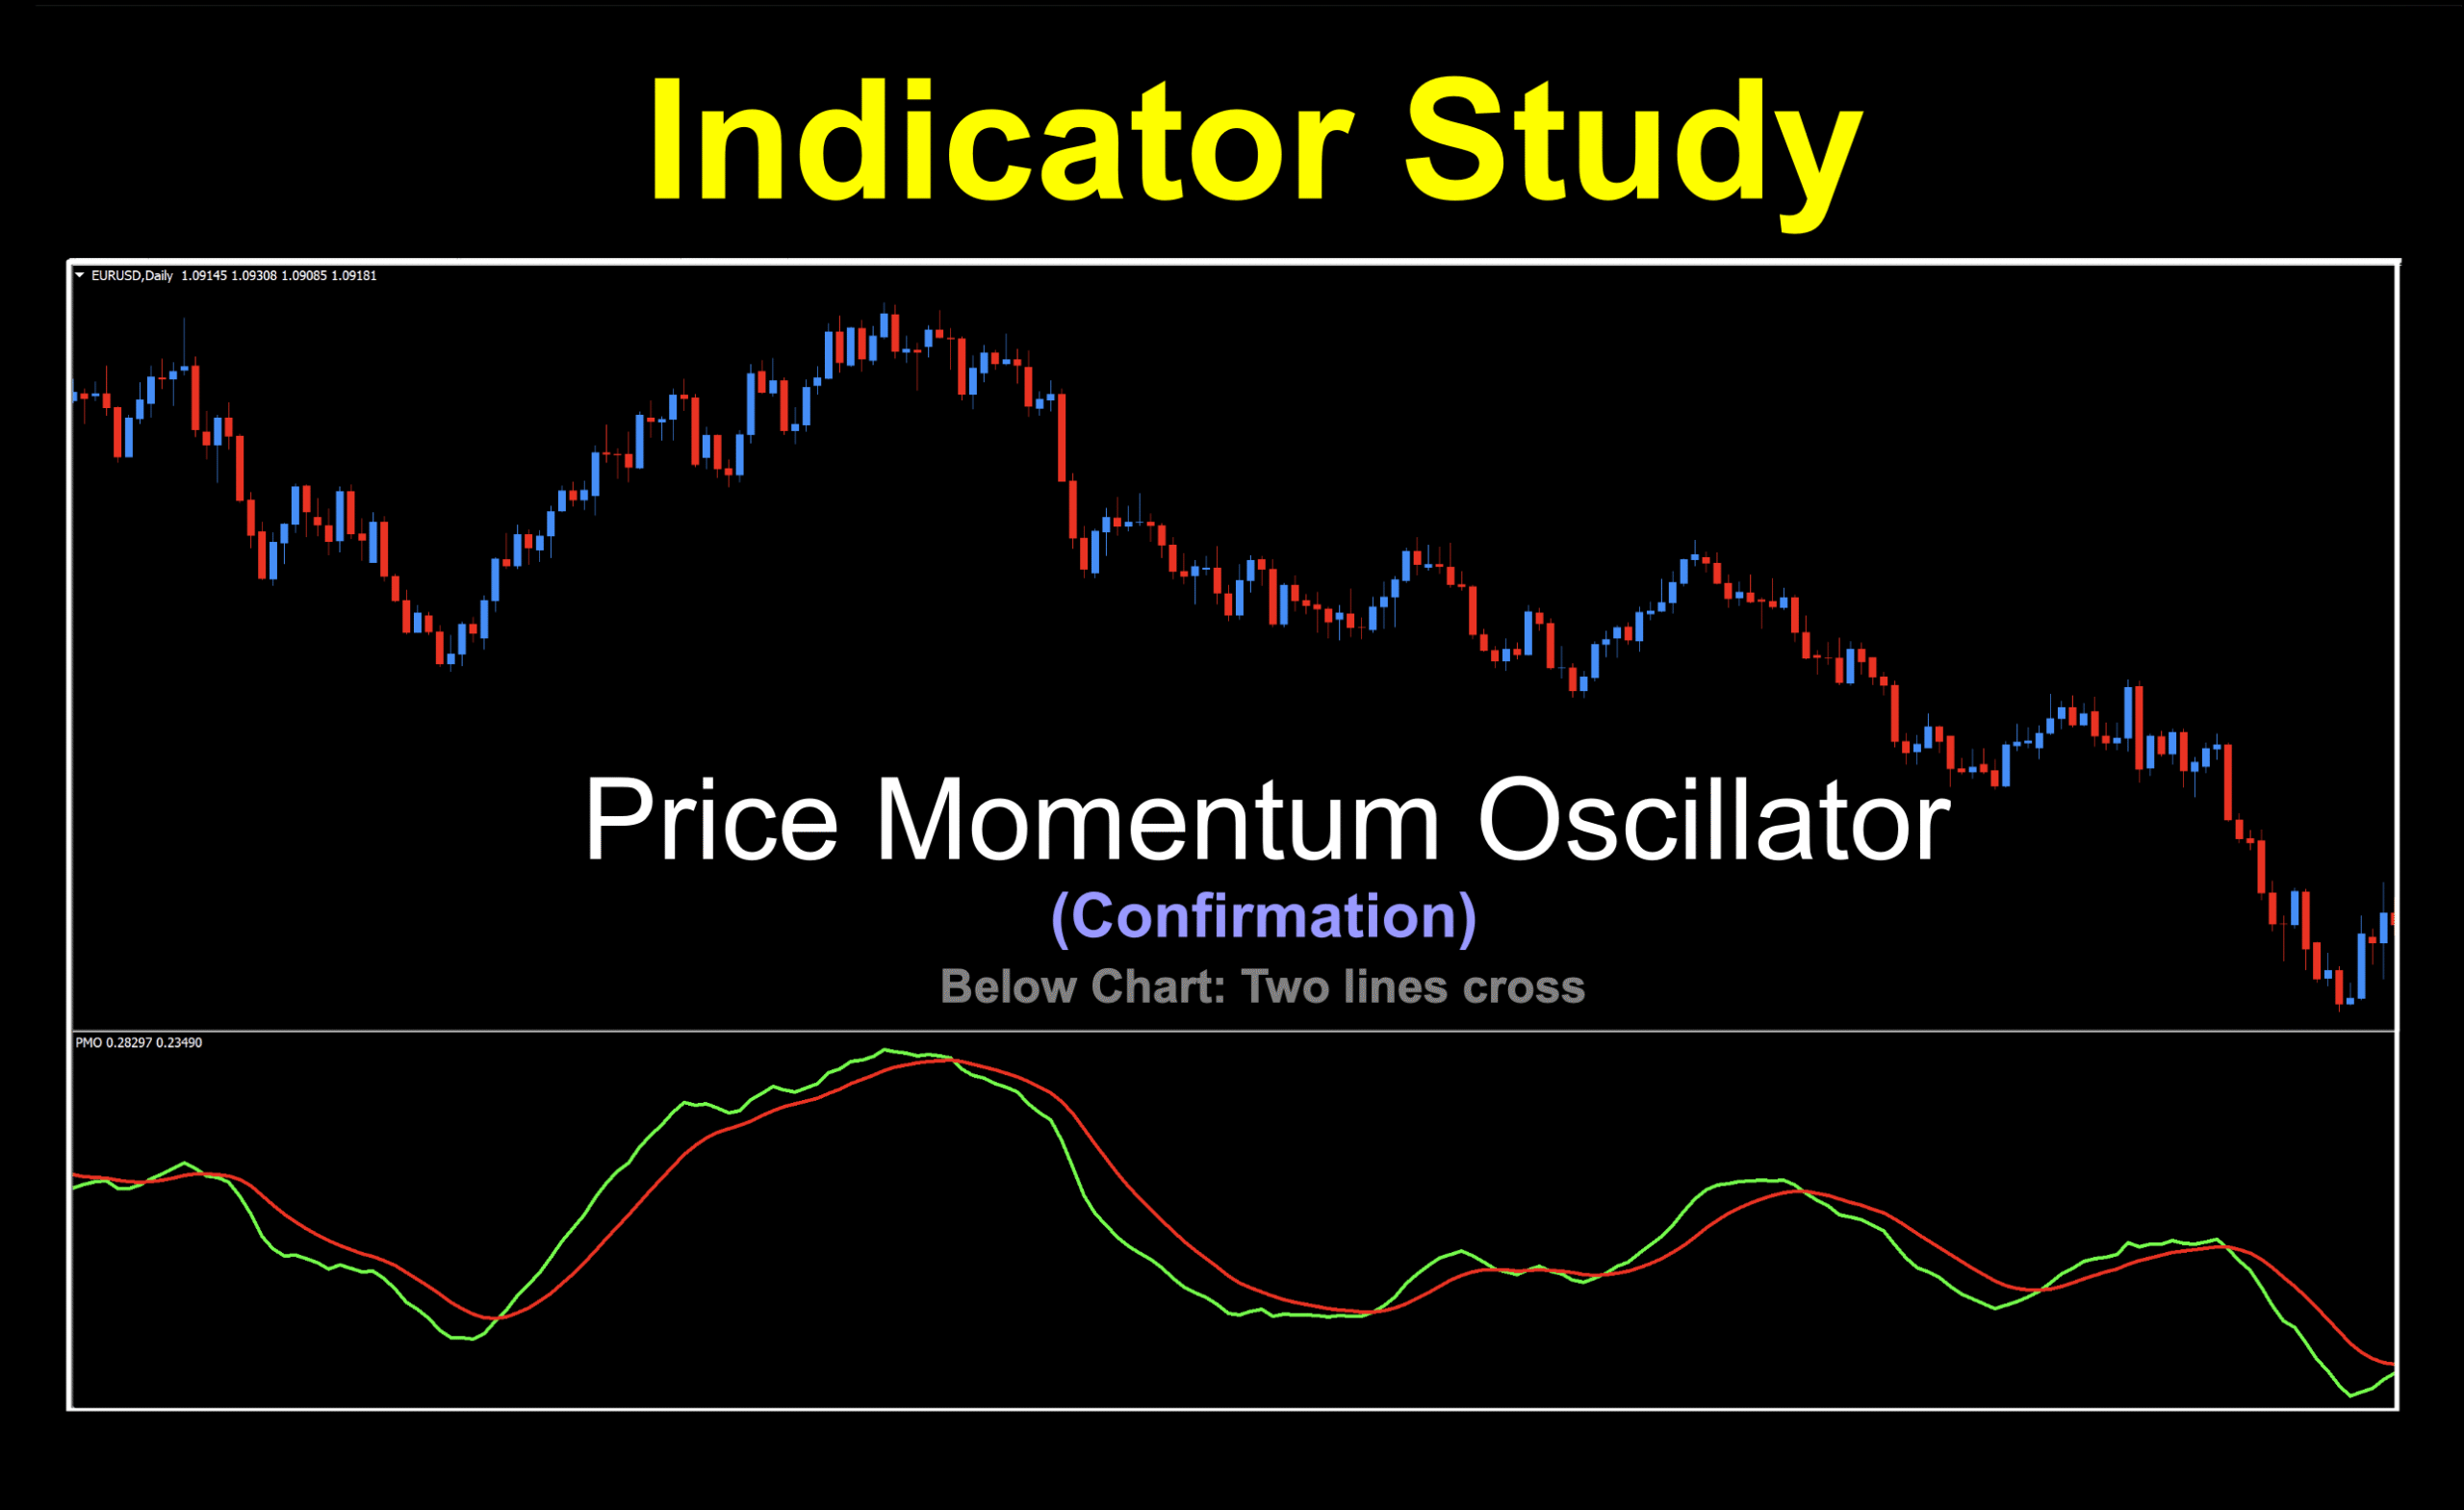
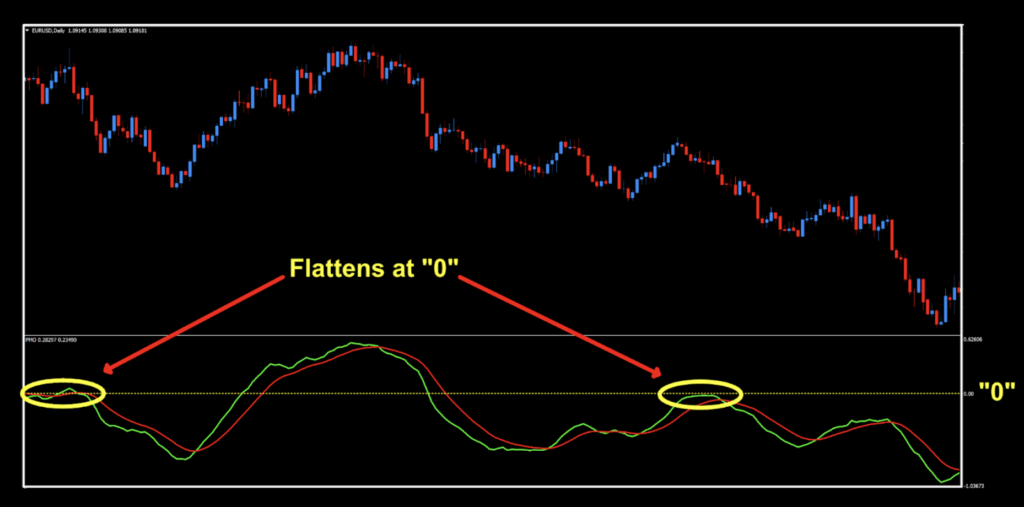
This indicator is called the Price Momentum Oscillator and was developed by Carl Swenlin and came to our world via MT4 in 2015. It oscillates across a zero line, but isn’t a zero line cross, but rather a two lines cross signal generator. This is evident because of the inherent “noise” at the zero level where the indicator flattens out, and multiple signals may exist. We’ve got a screenshot of that effect a little further down. It looks similar to the MACD, but is actually different because of the absolute value of each indicator. The MACD is based on moving average calculations, whereas the PMO is an internal ratio. ‘Nuff said.
Break Out Your Slide Rule
The calculations used to create this indicator are fairly simple.
Smoothing Multiplier = (2/Time period)
Custom Smoothing Function = {Close-Smoothing Function (previous day)} * Smoothing Multiplier+Smoothing Function (previous day)
PMO Line = 20-period Custom Smoothing of (10 * 35-period Custom Smoothing of (((Today’s Price/Yesterday’s Price) * 100) – 100))
PMO Signal Line = 10-period EMA of the PMO Line
Cross the Line
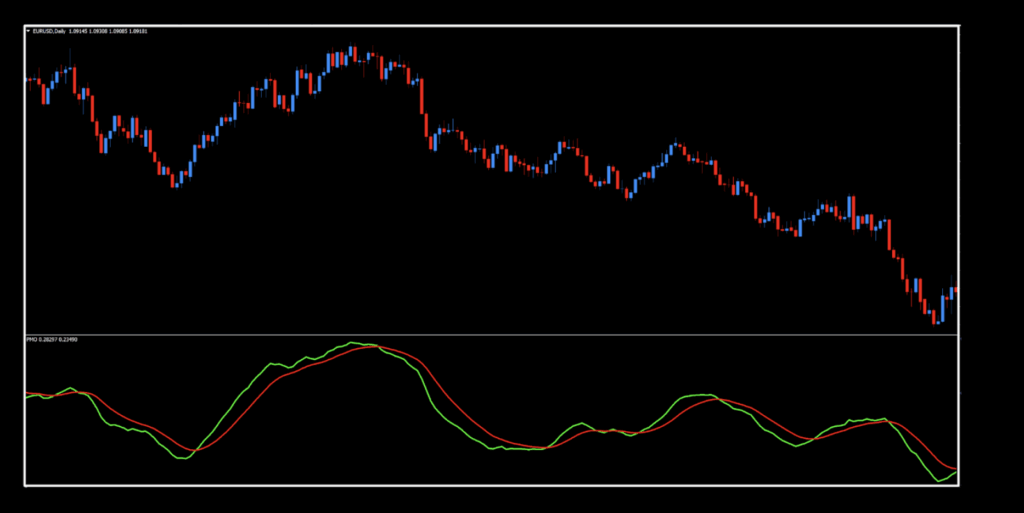
Let’s take a look at the default chart. We thicken up the lines for better visibility and of course, the candles are dispassionate white, per our usual focus effect.
Before we get into the settings, we’ll put up a screenshot of the zero line highlighted with the flattened effect, so you’ll see what we’re talking about.
Settings
There are three settings, of which you’ll use all of them, so there is pretty good control of this indicator.
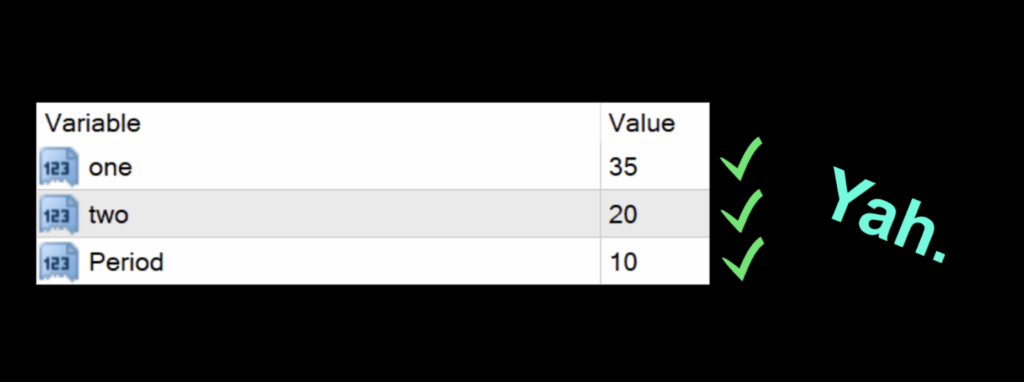
one: The length of the first exponential moving average to smooth the rate of change. The default setting is 35.
two: The length of the second exponential moving average to smooth the rate of change. The default setting is 20.
Period: The length of the exponential moving average to be used as the signal line. The default setting is 10.
Advantages
* Decent amount of flexibility in the settings department.
* Based on a Rate of Change, but better.
* Relative momentum component for better signals.
How we use it.
One of three actions need to happen in the last 30 minutes prior to the close of the trading day. They are; opening, maintaining, or closing, a position. This is when you make your trading decisions, and not actually wait for the close at 1700 EST, because we trade on the daily time frame.
Long: When the green signal line crosses above the red signal line. Entry is in the last 30 minutes of the trading day.
Short: When the red signal line crosses above the green signal line. Entry is in the last 30 minutes of the trading day.
Follow the tracks
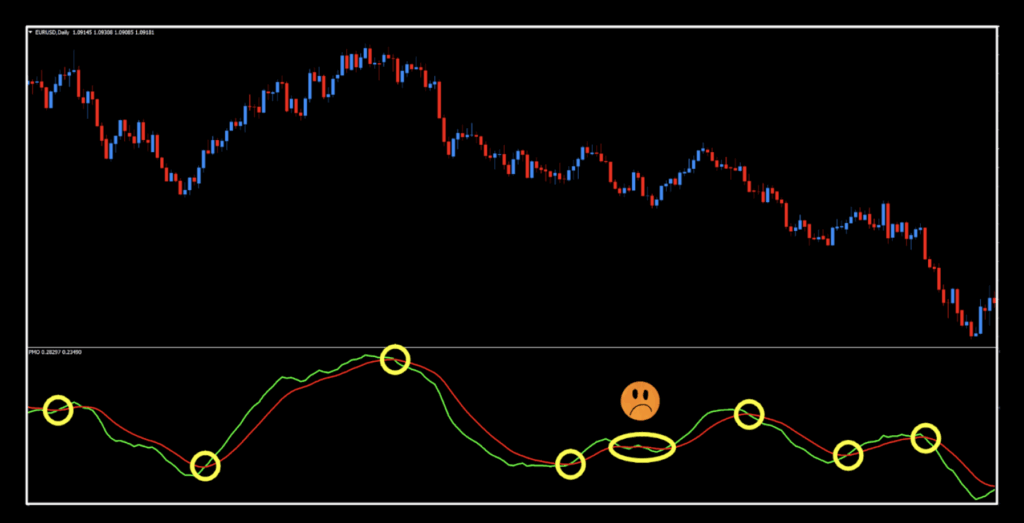
The signals are pretty good on default settings. There was one area of congestion where multiple signals occurred; however, a decent algorithm probably would have kept you from entering that faulty signal.
Stacks of Facts
If you’re new to these studies, we recommend looking at some older blogs to understand how we conduct our testing.
It’s in the Details
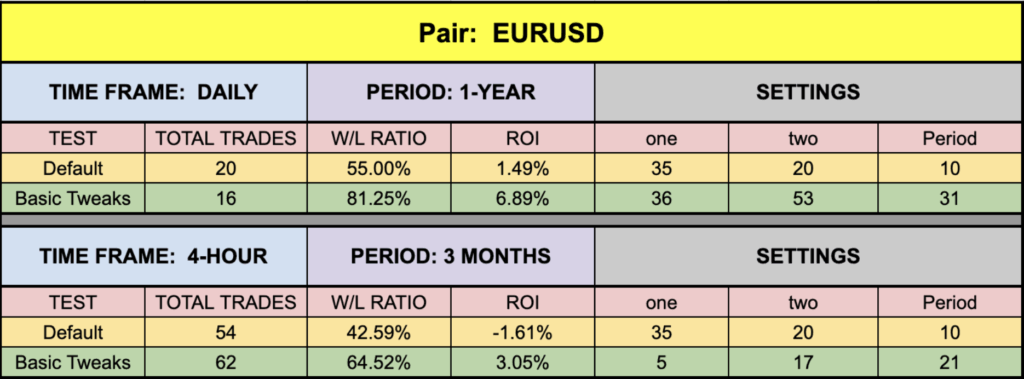
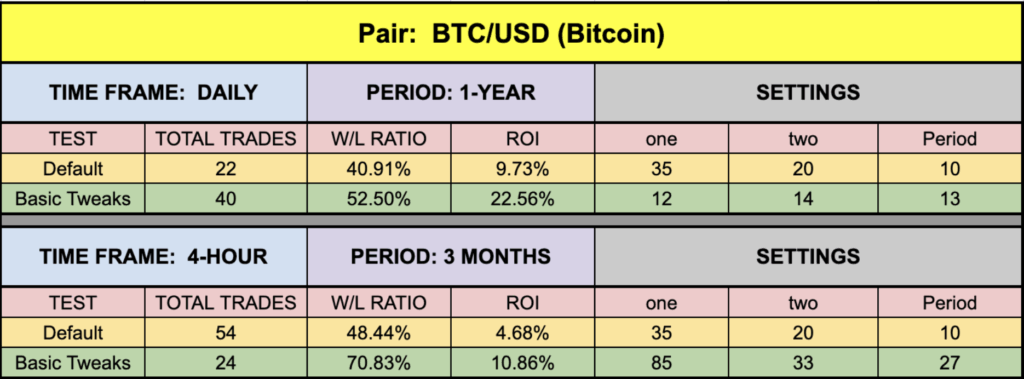
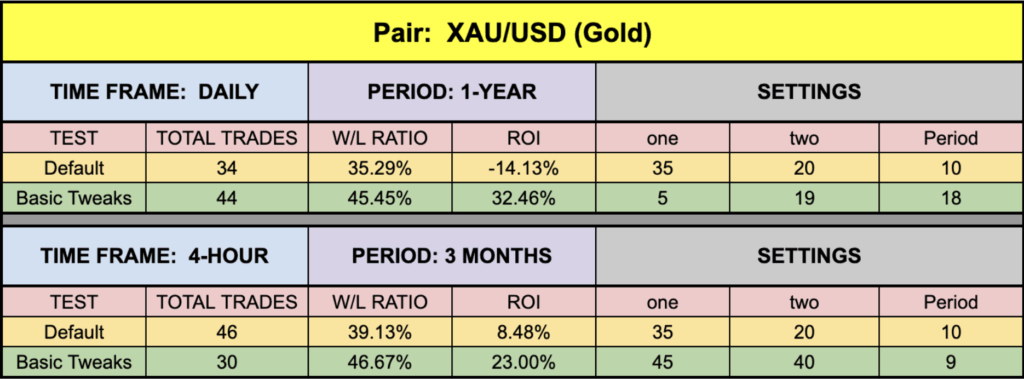
Below is the data from our testing.
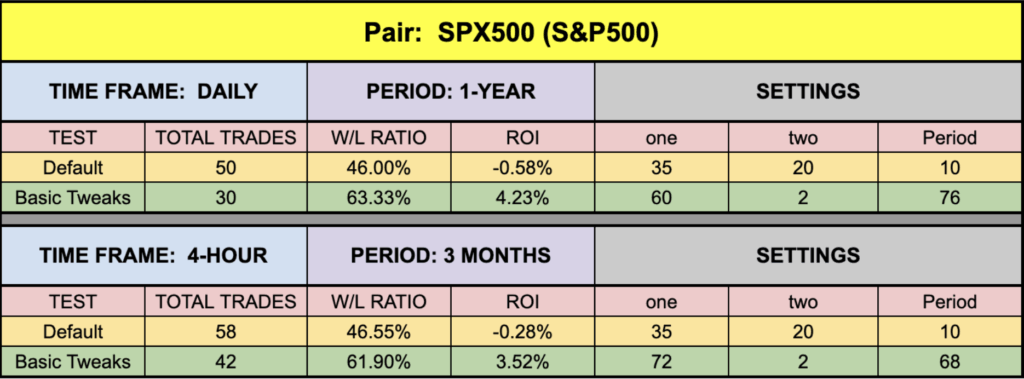
Test Results
One of the first things we noticed was that in all but one instance, the default settings returned very close to zero, or positive — a sign that the indicator is a well oiled machine. The SPX500 number was a little soft, but the EUR was a bit better on this. BTC and XAU followed through with some very handsome numbers, and they weren’t even the best ones.
Resources
You can download this indicator for free from our library, HERE. Also, be sure to subscribe to the Stonehill Forex YouTube channel for the technical analysis videos. Sign up for the Advanced NNFX Course HERE.
Our only goal is to make you a better trader.
*Our published testing results are based on money management strategies employed by the NNFX system and depend on varying external factors, which may be different between individuals and their specific broker conditions. No guarantee, trading recommendations, or other market suggestions are implied. Your results and subsequent trading activities are solely your own responsibility.
BTW — Any information communicated by Stonehill Forex Limited is solely for educational purposes. The information contained within the courses and on the website neither constitutes investment advice nor a general recommendation on investments. It is not intended to be and should not be interpreted as investment advice or a general recommendation on investment. Any person who places trades, orders or makes other types of trades and investments etc. is responsible for their own investment decisions and does so at their own risk. It is recommended that any person taking investment decisions consults with an independent financial advisor. Stonehill Forex Limited training courses and blogs are for educational purposes only, not a financial advisory service, and does not give financial advice or make general recommendations on investment.

