It’s Been Awhile
While reviewing indicators for profiling, we noticed that over five months have elapsed since our last baseline. Yes, we know that baselines are not the most attractive type of indicator with less “sexy” appeal as more interesting confirmation, volume, and exit indicators…but baselines are definitely key when it comes to developing your algorithm. This being the case, let’s dive into one together.
Nicknames
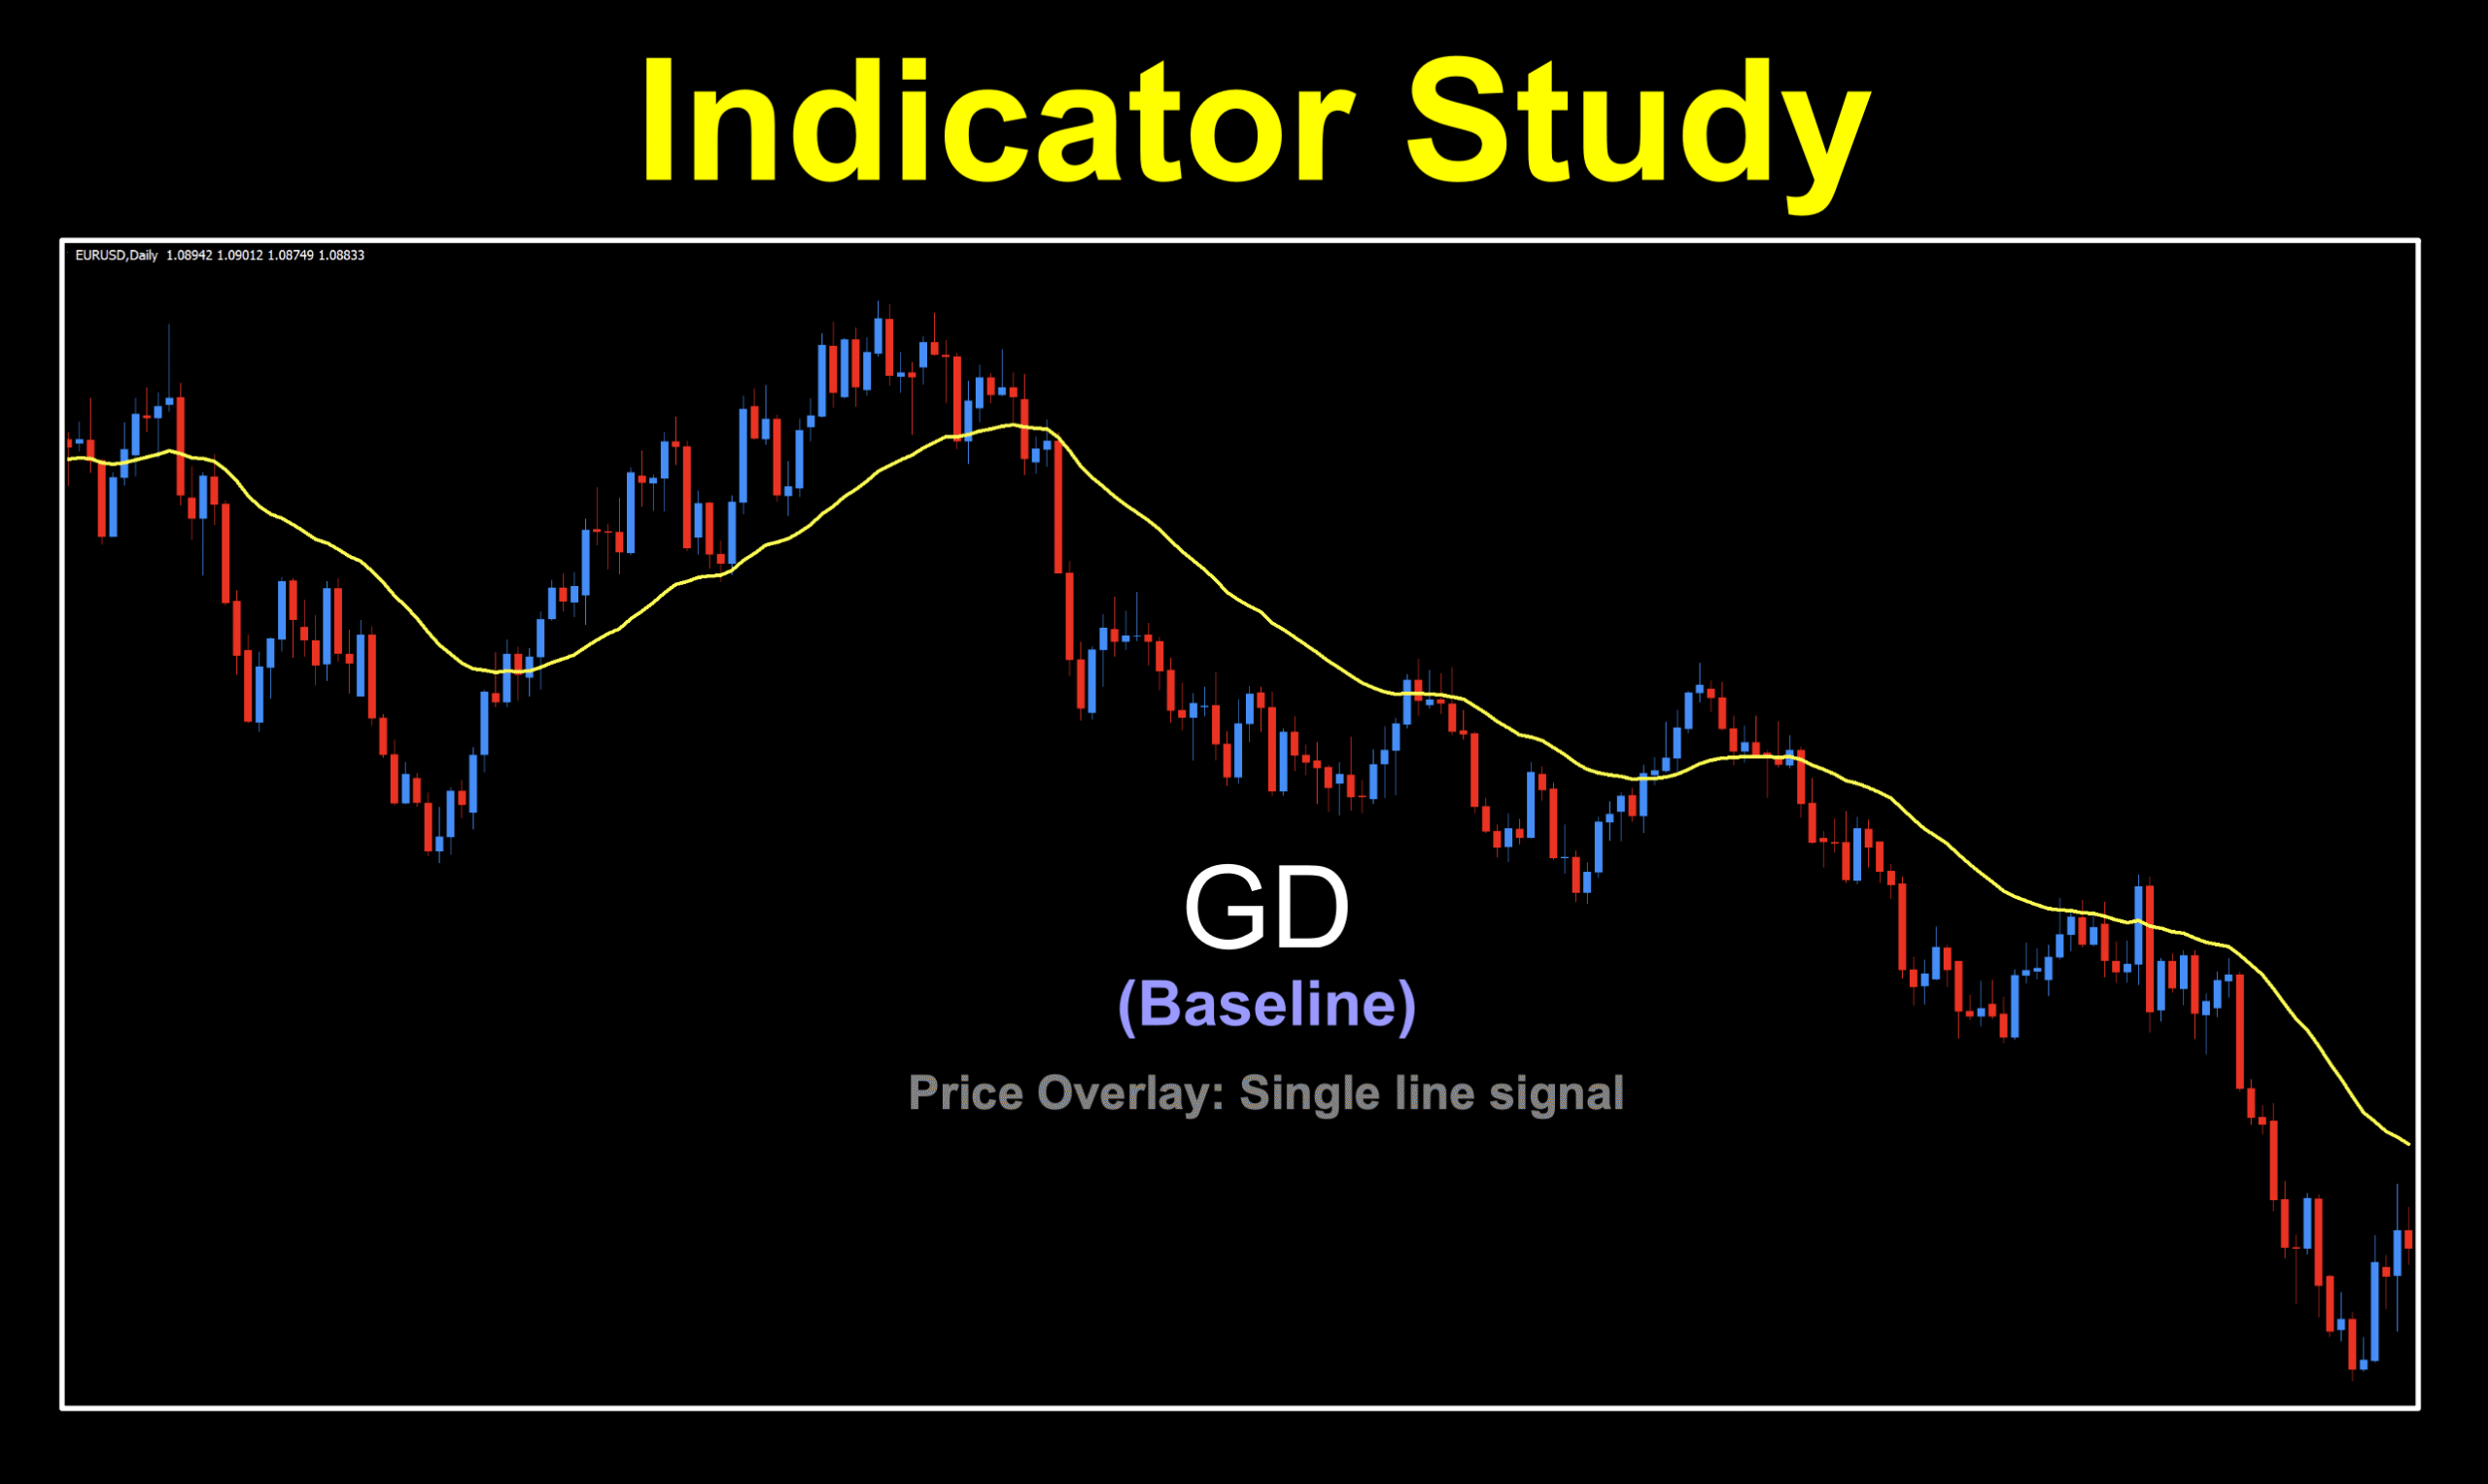
This latest baseline is called “gd”, which actually is short for Generalized DEMA…which is short for Generalized Double Exponential Moving Average. Better than just any old moving average, a DEMA type is designed to reduce lag more than other traditional moving averages. Additionally, there is a secondary filter which further smooths the results. And it’s a bit newer than the dusty old moving average, coming to us from 2014.
Smashing Math
The internal calculations are not that complicated where if you were so inclined, you could actually plot these on old school graph paper. But, why?

GD = (1.0+Volume factor) * EMA1 – Volume factor * EMA2
where…
EMA2 – EMA(EMA1, Period)
EMA1 – EMA(Applied price, Period)
Illustratus Defaultus
Not real Latin, but it sounds technical. What we’re going to do is leave everything in the default values, but just thicken up the signal line for better visibility.
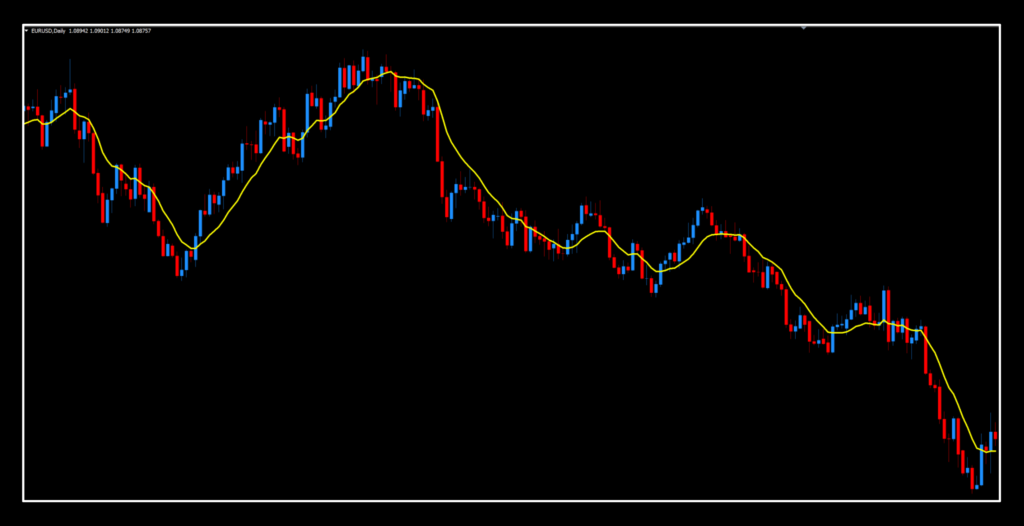 The first thing we noticed after comparing many other non-lagging baselines was that this one did better with regard to its ability NOT to hug price too closely, creating multiple signals. But still, there are areas where it does happen, especially where price flattens out. For a better view, we’re going to make a few random changes in the settings menu.
After spending all of about eight seconds changing the values with no specific numerical importance, we came away with this. It’s still a similar “shape” but it tracks better for signal identification, which we’ll look closer at shortly.
Settings
There are three variables, of which we’ll be using all of them when testing.
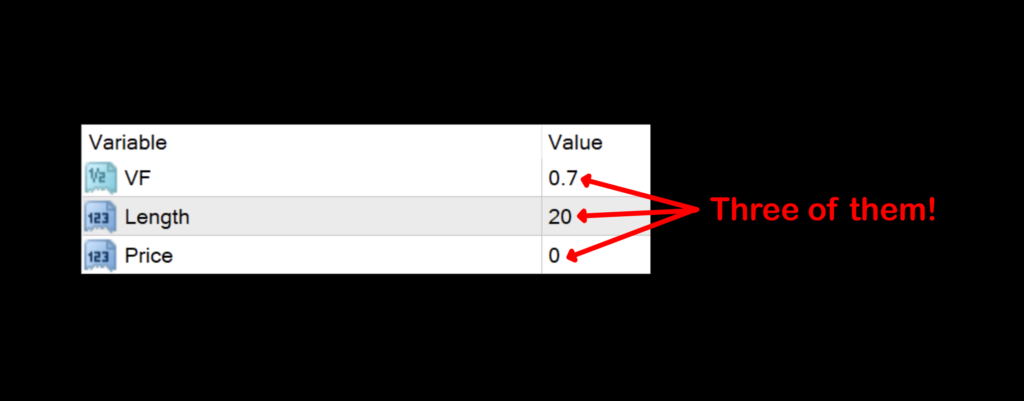
VF: The volume factor portion of the calculation. The default value is 0.7.
Length: The number of periods used for the internal calculations. The default value is 20.
Price: The specific price data set where 0 = Closed, 1 = Open, 2 = High, 3 = Low, 4 = Median, 5 = Typical, 6 = Weighted. The default value is 0 = Closed.
Fairly Clear
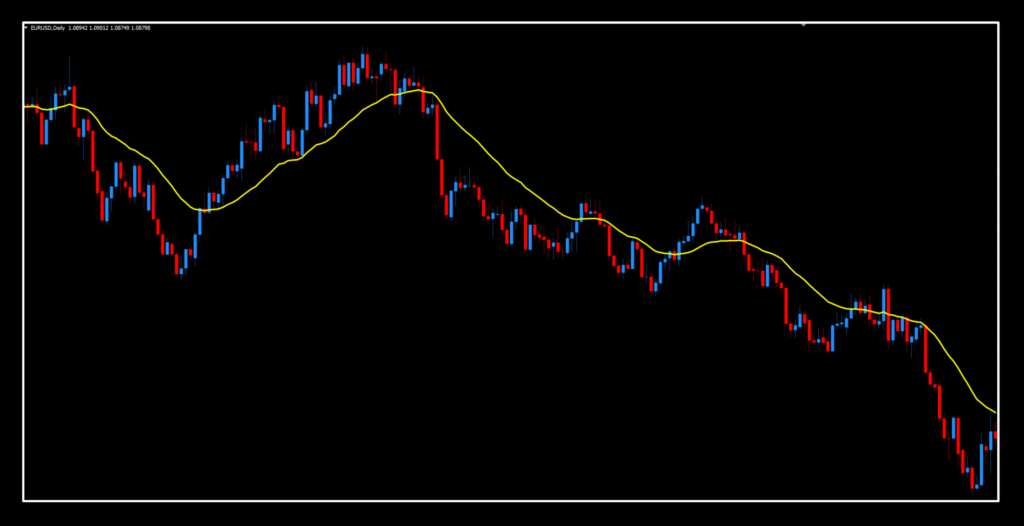
In the marked up image, recall that we made a few random changes to the variables to give us a clearer view of the signals for easier identification.
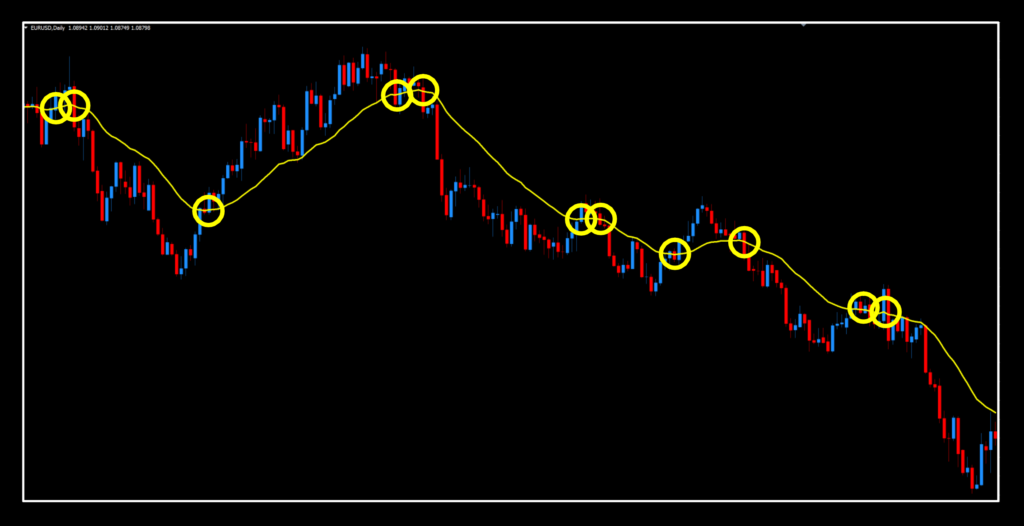
The first thing we noticed were how well this indicator performed. Even in areas where volatility was low and price went sideways, the indicator pushed through where fewer false signals appeared. The non-lagging aspect of this indicator was apparent as well, calling signals earlier than others…and we slowed this down considerably.
Percents & Numbers
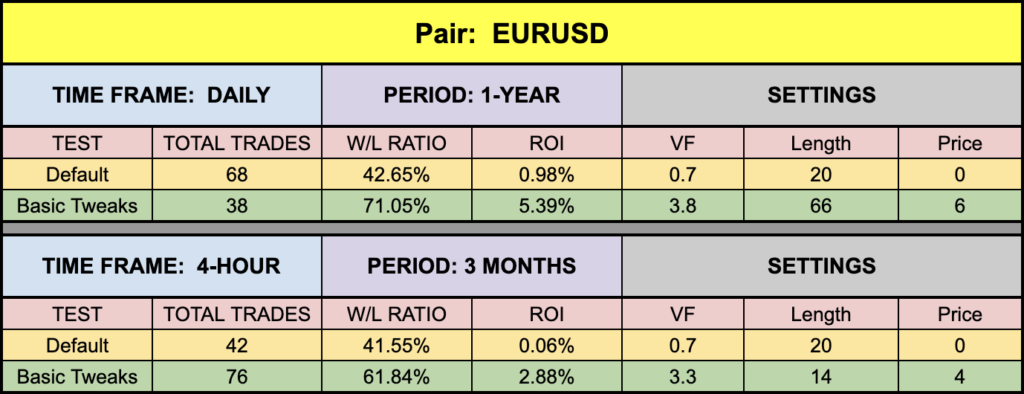

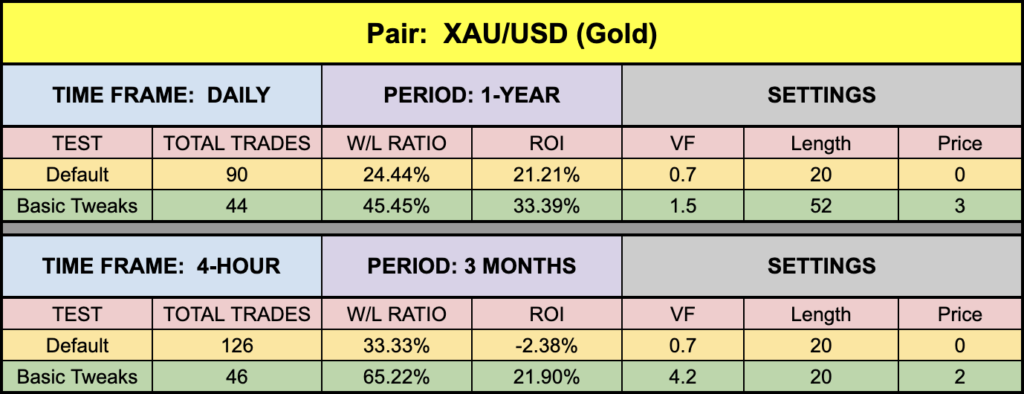
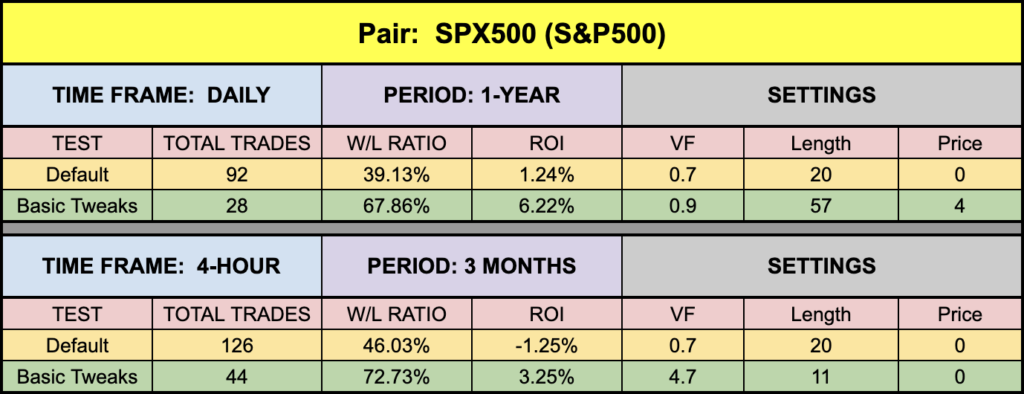
Look’in Better
A little soft on the EUR and SPX500, although the SPX500 posted better numbers than we’ve seen with other indicators in the recent past. There were better settings, but the number of trades begins to rise exponentially and becomes somewhat cumbersome. The XAU did very well, and BTC also performing well, even on the 4-hour chart.
Resources
You can download this indicator for free from our library, HERE. Also, be sure to subscribe to the Stonehill Forex YouTube channel for the technical analysis videos. Sign up for the Advanced NNFX Course HERE.
Our only goal is to make you a better trader.
*Our published testing results are based on money management strategies employed by the NNFX system and depend on varying external factors, which may be different between individuals and their specific broker conditions. No guarantee, trading recommendations, or other market suggestions are implied. Your results and subsequent trading activities are solely your own responsibility.
BTW — Any information communicated by Stonehill Forex Limited is solely for educational purposes. The information contained within the courses and on the website neither constitutes investment advice nor a general recommendation on investments. It is not intended to be and should not be interpreted as investment advice or a general recommendation on investment. Any person who places trades, orders or makes other types of trades and investments etc. is responsible for their own investment decisions and does so at their own risk. It is recommended that any person taking investment decisions consults with an independent financial advisor. Stonehill Forex Limited training courses and blogs are for educational purposes only, not a financial advisory service, and does not give financial advice or make general recommendations on investment.