Welcome to the next indicator study. This research represents an investigative look into how and why some indicators work and some don’t work as well.
New Versus Old
Finding quality volume indicators has always been a challenge for traders. More often than not, many volume indicators are modeled after the GRAB (Green, Red, and Blue) style histograms. For a more in depth explanation of GRAB indicators, check out the blog on Types of Indicators.
Love That Volume
In this indicator study, we’re going to examine the Trend Direction Force Index Indicator. Developed by psychologist and trader Alexander Elder, it was first published in his 1993 book, “Trading for a Living”. This indicator is an oscillator that swings between 1 and -1 and can be qualified as a zero cross by combining both price movement and volume. It has the added advantage of displaying a neutral zone where no significant bull or bear “force” exists, and the market has no distinct direction. This area is between -0.05 and +0.05 as noted on the indicator levels. This is a below chart, or “sub chart” indicator, which helps keep the view of your chart less cluttered.
To Exit…or Not
As a rule, we don’t use volume indicators as an exit. It is the last piece of your algorithm, and therefore; once you’ve opened a trade…take it off the chart. You don’t need anything “extra” interfering with what you see.
Love That Math
The math behind the indicator is relatively simple:
Force Index (number of periods) = [Close (current period) – Close (prior period)] x Volume
Mr. Elder suggested a default value of 13 for the number of periods; however, our indicator appears to default to 20 – which is what we will be starting our testing with.
Why Market Volume
As we’ve mentioned, Forex market volume has always sparked debate among traders. Considering that all trades do not clear through one central location, such as Futures or Stocks, and other securities…the volume you see is not true volume of the world market. Practically speaking, however, the data your broker displays is a reasonably accurate representation of what the entire market is currently experiencing and therefore sufficient for trading purposes.
Why Bother With Volume
Without volume, markets don’t have the “fuel” they need for price to trend, and instead will whip up and down without any sustained direction. Unfortunately, traders ignore market volume simply because they do not understand it.
Volume Indicator
A “volume indicator” falls into the category of indicators that serve as a final checkpoint after the baseline and confirmation indicator conditions have been met (see the blog on Hull Moving Average for a baseline indicator HERE or the non-lag MACD indicator blog for a confirmation indicator HERE) when setting up your algorithm.
Advantages
Trading volume assists the trader when confirming a trend. If trading volume increases, prices generally move in the same direction and can provide a heads-up if volume diminishes. Once volume begins to diminish, a reversal or ranging market may be in the near future. What makes this indicator so easy to use is;
* Color coded for easy signal identification
* Neutral zone indicates a sideways market
Very Good Looking
Below is a screenshot of what the indicator looks like on the daily time frame. Note that we’ve changed the color of the candles to white to remove any emotional bias so that only the indicator is prominent.
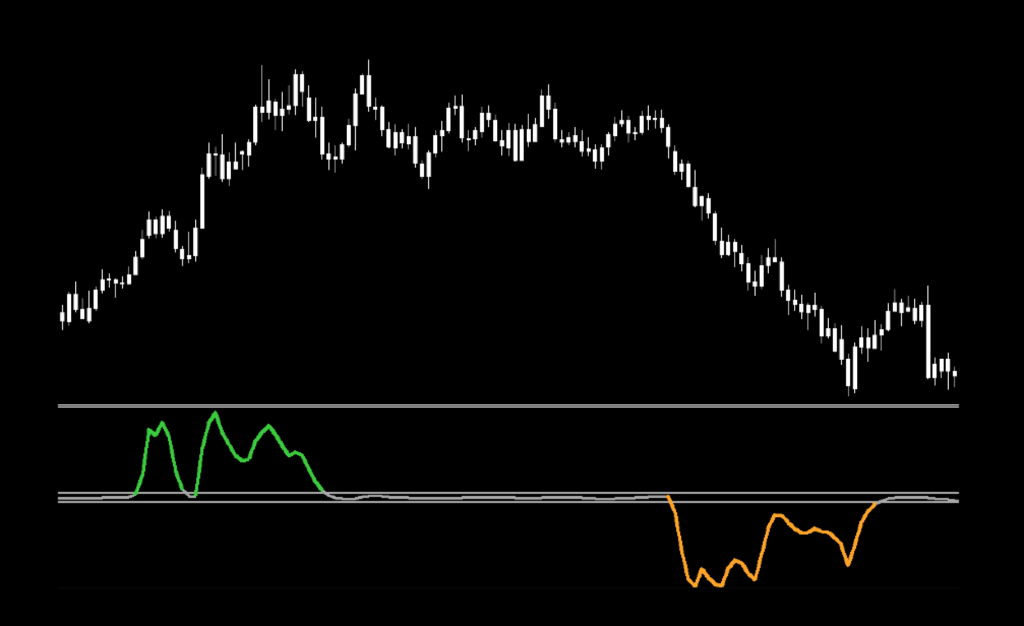
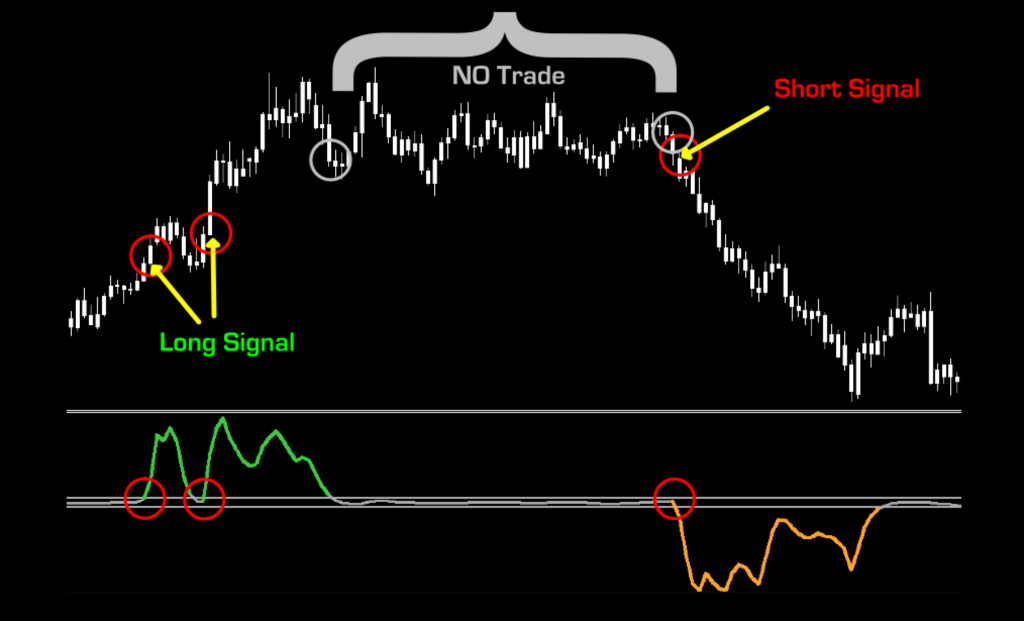
How it’s Used
There are three conditions of the indicator.
Green – market volume is trending up; long signal
Gray – market has no particular direction; no signal
Orange – market volume is trending down; short signal
See the marked up chart below.
Settings
Below, are the default settings. We’ll go through each one to describe what its function is.
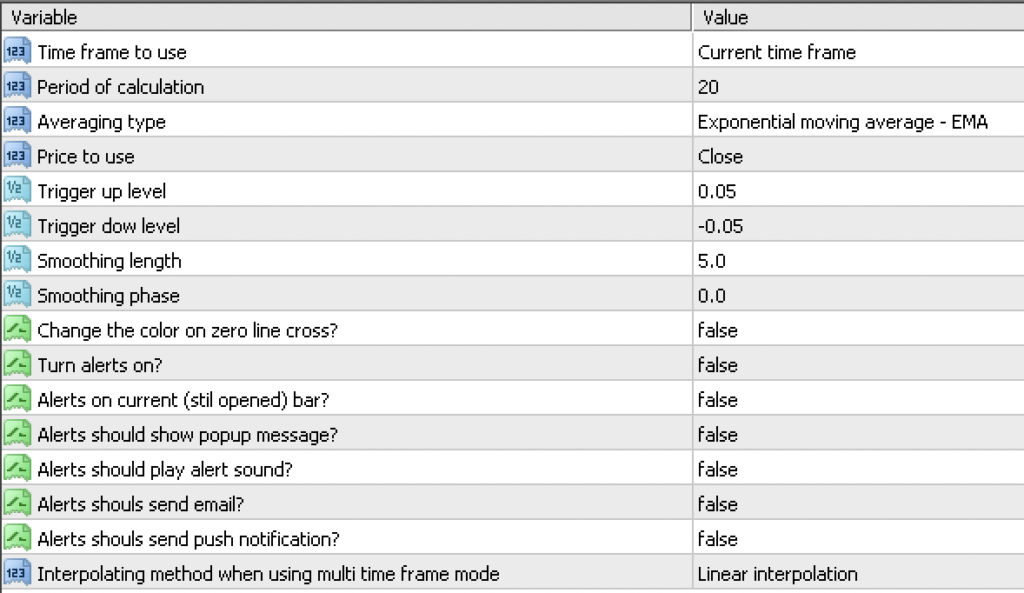
Time frame to use: Leave this on the default value. You can change it to whatever specific time frame you are using, but you’ll have to make adjustments if you flip between different time frames.
Period of calculation: Similar to the number of periods in a moving average, this specifies how many periods to use in the calculation of the indicator.
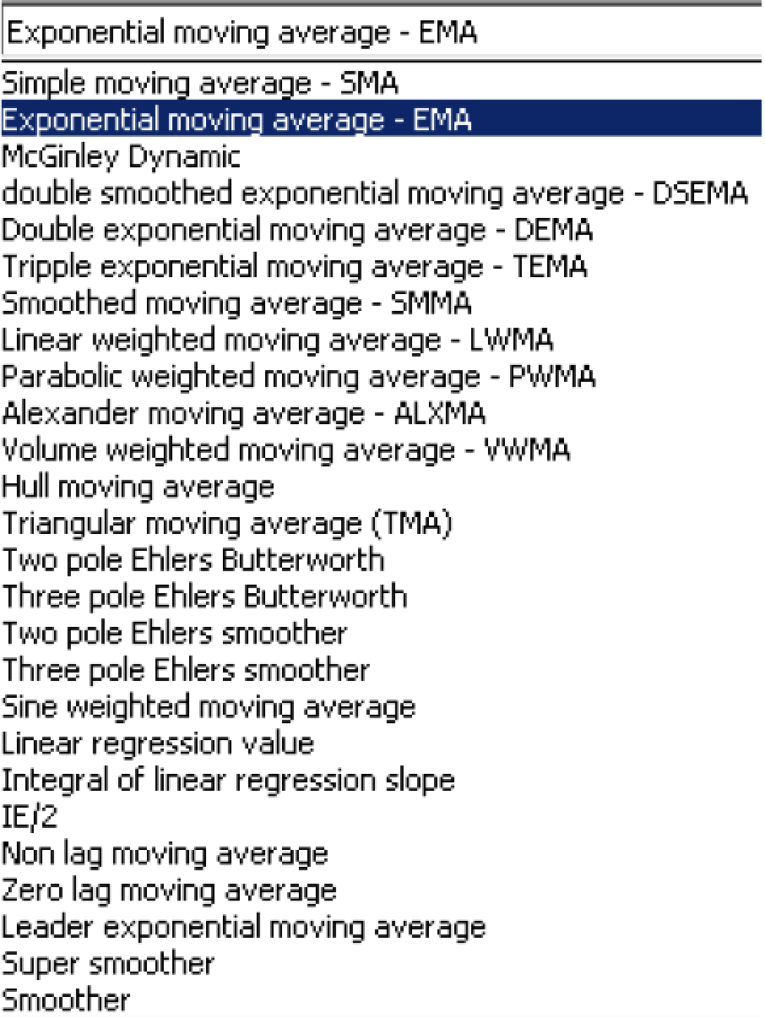
Averaging Type: Specifies the particular type of moving average, including any of the following in the list below (EMA – Exponential Moving Average is the default moving average type used).
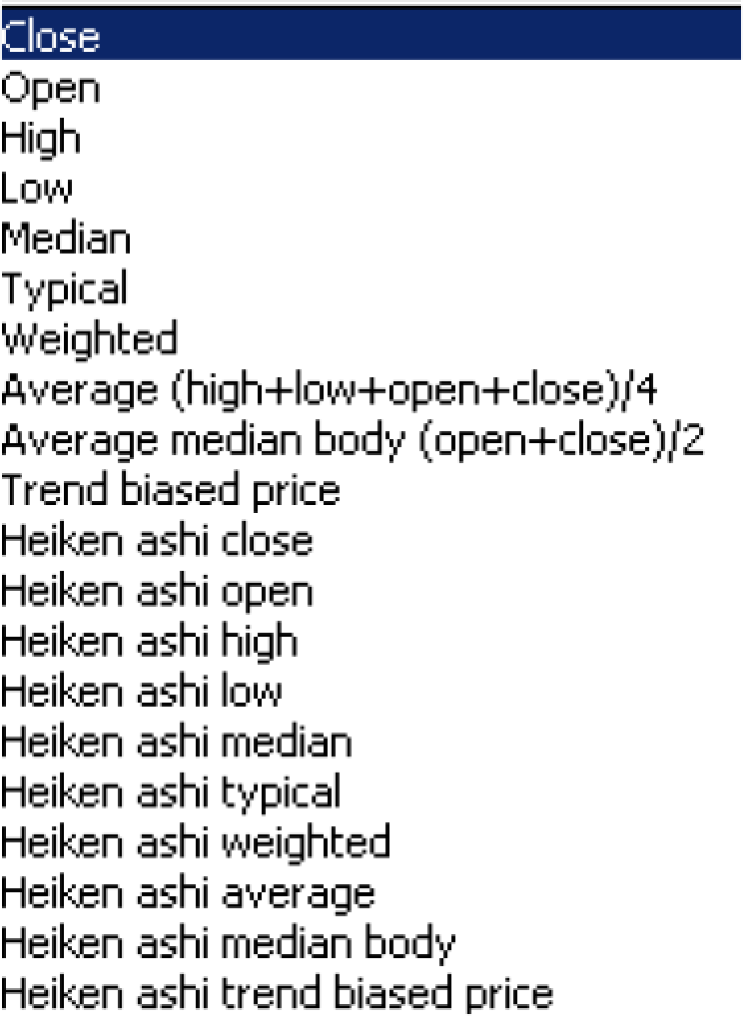
Price to Use: Specifies which data set of prices to use. The “Close” price is the default set; however, the following are available to use.
Trigger Up Level: This is the oscillator level which signals an upward trend in price, or a long signal. The default level is 0.05. Leave this on the default value.
Trigger Down Level: This is the oscillator level which signals a downward trend in price, or a short signal. The default level is -0.05. Leave this on the default value.
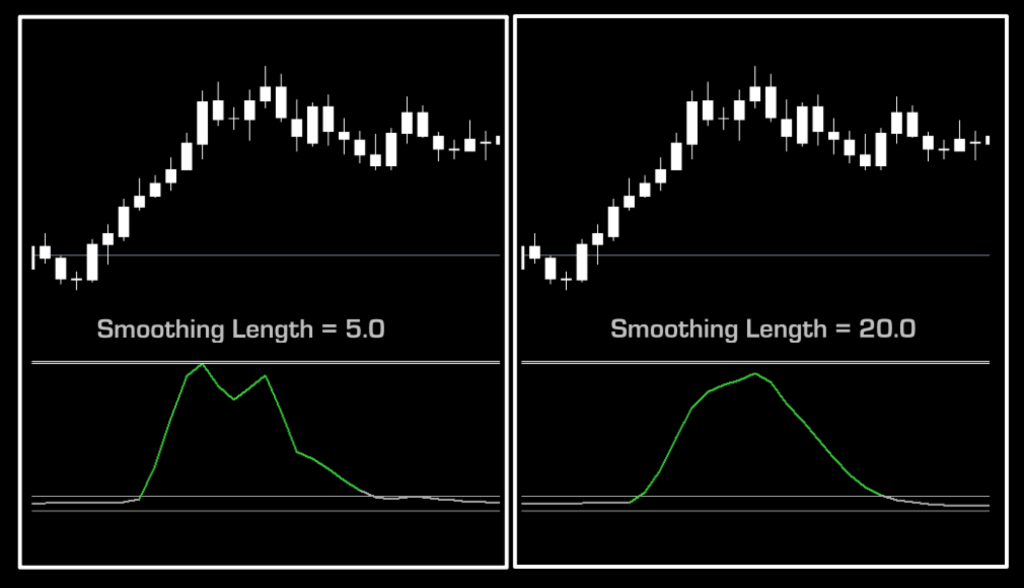
Smoothing Length: By increasing the smoothing length, the signal line is less responsive to price change and its appearance is smoothed to remove some peaks and troughs. Below is a comparison of the default value of 5.0 and an altered value of 20.0. We’ve left it on the default value for our testing purposes.
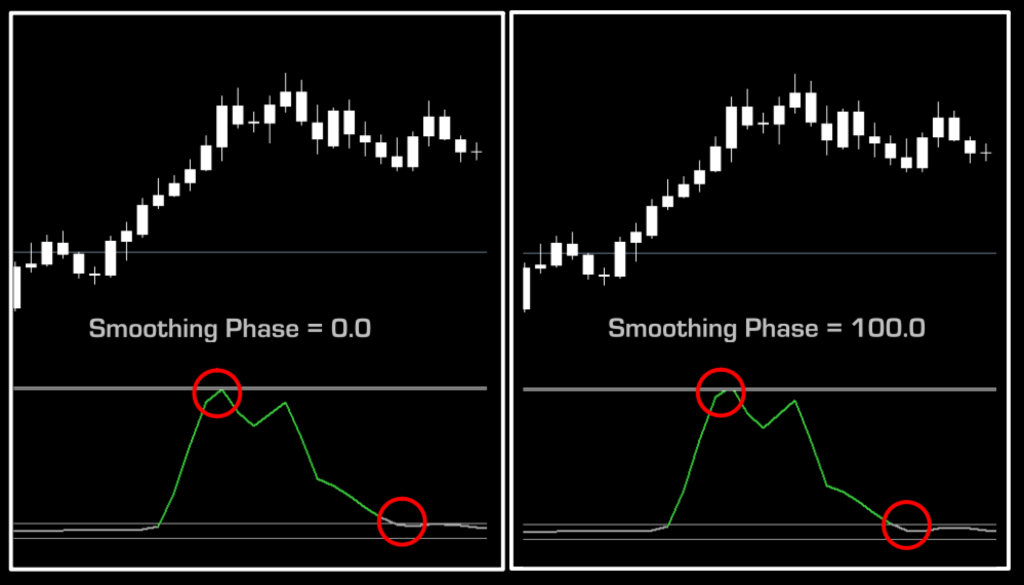
Smoothing Phase: By increasing the smoothing phase, the amplitude (height) of the curves is very slightly exaggerated. Below is a comparison of the default value of 0.0 and an altered value of 100.0. You’ll notice that there are very minor differences, and should remain on the default value.
Change the color on the zero line cross: This setting provides you the opportunity to use the zero line (instead of the 0.05/-0.05 zone) to facilitate the change in color. The default value is “false”, meaning that the color of the indicator will change when it is outside the neutral zone.
The next six settings are various notification alerts for visual, audio, email and texting. Change them as you see fit. Default values are “false”.
Interpolating method when using multi time frame mode: This setting allows the trader to view multiple timeframes at once on a single chart. The default setting is “linear interpolation”, meaning that the indicator adjusts for the specific time frame, your chart is currently displaying. The Quadratic Interpolation setting changes the data slightly by creating “curvature” when plotting data points versus “linear” which plots in a straight line. For our testing purposes, we’ve left it on the default setting.
What We Will Be Testing
Given all the different settings in this indicator (some of which really don’t make much difference), we will be testing our pairs by changing the values of the following settings:
1. Period of Calculation (Periods)
2. Averaging Type
3. Price to Use
Testing…Testing…Testing
Remember, comprehensive analysis is strongly suggested, and we advocate backwards and forward testing indicators or systems prior to trading actual funds. We propose conducting your tests on the following five pairs.
EUR/USD
AUD/NZD
EUR/GBP
AUD/CAD
CHF/JPY
If it doesn’t work on these five pairs, chances are it won’t work on other pairs. This is not an absolute, but we’ve found this rule is reliable in most cases.
We’ve added two other pairs to our testing sequence based on feedback we’ve received from our community. They are the:
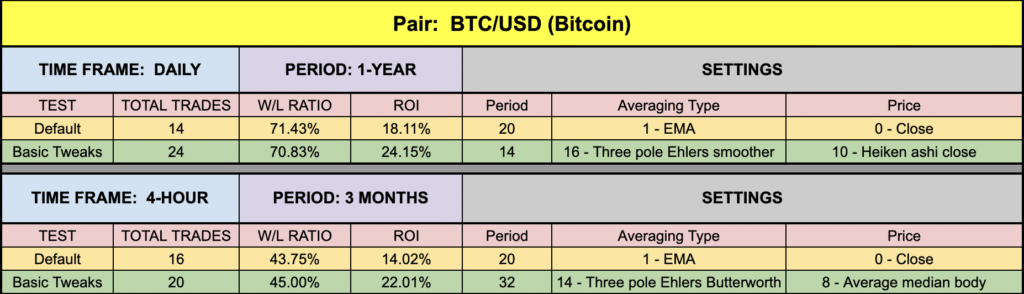
BTC/USD (Bitcoin/US Dollar)
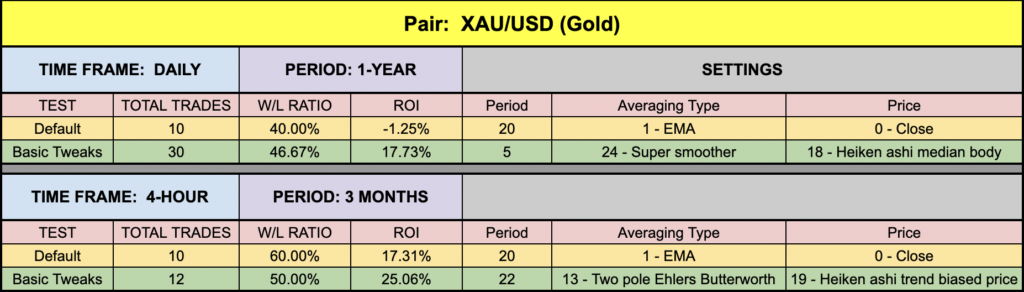
XAU/USD (Gold/US Dollar)
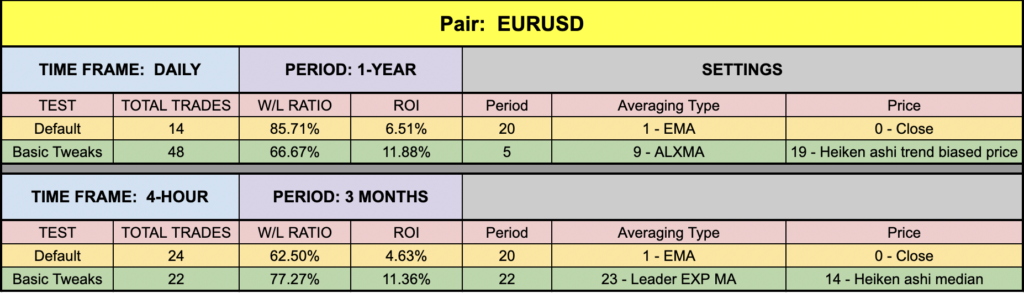
Timeframes and Results
In our initial test, we’ll run the Trend Direction Force Index Indicator on the EUR/USD, the BTC/USD and XAU/USD using the default settings across the daily and 4-hour timeframes on the MT4 strategy tester. We use the fast method of testing the indicator to get a general idea; however, you may also run the tick-by-tick data set for a more precise result (which takes considerably more time).
As No Nonsense Traders – and therefore Swing Traders, we will not examine shorter time frames in these studies. We will also run an additional test, using different values for the settings, to analyze which one may work better and examine the following results:
Total trades
Win/Loss ratio
ROI (return on investment)
There are other metrics included in the strategy tester report, which can be compared, but these three metrics provide the necessary gauge to make quick decisions as to the usefulness of a particular indicator and its settings.
Next, for comparison, we’ll explore the following;
Daily – 1 year
4-hour – 3 months
The reason exceptionally long (or short) testing periods are not included is due to changing market conditions, which might return irrelevant information. A balance of statistically significant data is necessary for accurate results.
And the Outcome…
Below are the spreadsheets listing the results from our tests.
Resources
As we did with previous indicator studies, we’ve made the Trend Direction Force Index indicator available for download on our site from the indicator library, if for whatever reason you don’t have it on your platform. We will keep adding better indicators with each study for your use, at no charge. When you’re ready to get it, click HERE.
More to Come
There’s a lot more to come. If you haven’t signed up on our contacts page or subscribed to the YouTube channel, please consider doing so to receive notifications as we continue to publish helpful, relevant, and informative Forex related material to support your quest to becoming a better trader.
And now, you may be aware of an older indicator that is now more efficient. There are newer ones which we will explore in future blogs and videos. Stay tuned!
Our only goal is to make you a better trader.
BTW – Any information communicated by Stonehill Forex Limited is solely for educational purposes. The information contained within the courses and on the website neither constitutes investment advice nor a general recommendation on investments. It is not intended to be and should not be interpreted as investment advice or a general recommendation on investment. Any person who places trades, orders or makes other types of trades and investments etc. is responsible for their own investment decisions and does so at their own risk. It is recommended that any person taking investment decisions consults with an independent financial advisor. Stonehill Forex Limited training courses and blogs are for educational purposes only, not a financial advisory service, and does not give financial advice or make general recommendations on investment.