Welcome to the next indicator study. This research represents an investigative look into how and why some indicators work and some don’t work as well.
New Versus Old
As I’m sure you’ve discovered, finding quality Volume indicators takes a lot more effort. Most volume indicators provide the same information, but in different visual representations. The trick is finding a recently developed one which is easy to interpret, understand, and actually used to help you successfully trade. In this study, we’re going to examine the WAE, or Wattah Addar Explosion Indicator. The indicator was developed in 2007 by a trader (who now runs his own company) named Ahmad Waddah Attar. Pretty interesting guy. You can see what else he’s done. Check out his other indicators for your searching quest HERE.
Market Volume
There has always been a debate concerning Forex market volume. Some say that it’s impossible to track because the FOREX market itself is decentralized – meaning that all trades do not clear through one central location, such as Futures or Stocks. Others claim that the volume you see is what your broker has and is a close enough representation of what the entire market is currently experiencing. The bottom line is that the data you can get from your broker is sufficient for trading purposes.
Why Bother?
As we’re sure you’ve heard before; without volume, markets don’t have the “fuel” they need and tend to whip back and forth without direction. Sadly, many traders ignore market volume simply because they do not understand it.

Volume Indicator
A “volume indicator” falls into the category of indicators that serve as a final checkpoint after the baseline and confirmation indicator conditions have been met (see the blog on Hull Moving Average for a baseline indicator HERE or the non-lag MACD indicator blog for a confirmation indicator HERE) when setting up your algorithm.
Advantages
Trading volume can help an investor identify momentum of a currency pair and confirm a trend. If trading volume increases, prices generally move in the same direction and can provide a heads-up if volume diminishes. Once volume begins to diminish and the fuel for the trend starts to dry up, a reversal or ranging market may be on the horizon. This particular volume indicator;
* Only has three components to interpret
* Visually straight forward
* Easy to understand and user-friendly
Very Attractive
Below is a screenshot of what the indicator looks like on the daily time frame. Note that we’ve changed the color of the candles to white to remove any emotional bias so that only the indicator is prominent.
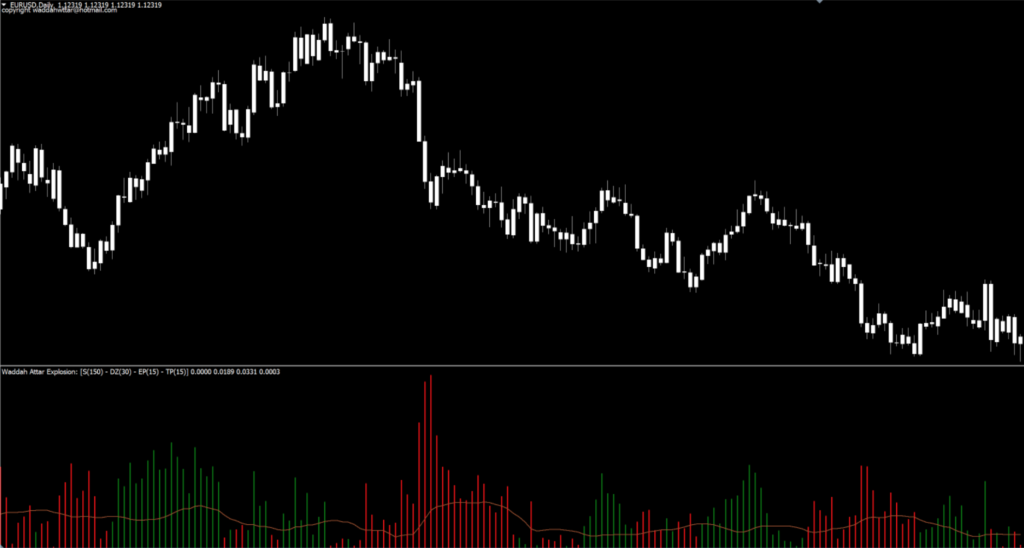
How it’s Used
There are three components to this indicator; green histograms, red histograms, and a yellow “explosion” line.
The red histogram indicates the current downtrend.
The green histogram indicators the current uptrend.
The yellow line’s direction shows the “explosion” price up or down (I’ll explain this detail further in a bit).
Long Signal:
The green histogram is higher than the yellow line.
Short Signal:
The red histogram bar is higher than the yellow line.
See the marked up chart below. Note that we’ve changed the color of the explosion line from yellow to white and the green histogram to “lime” for easier identification.
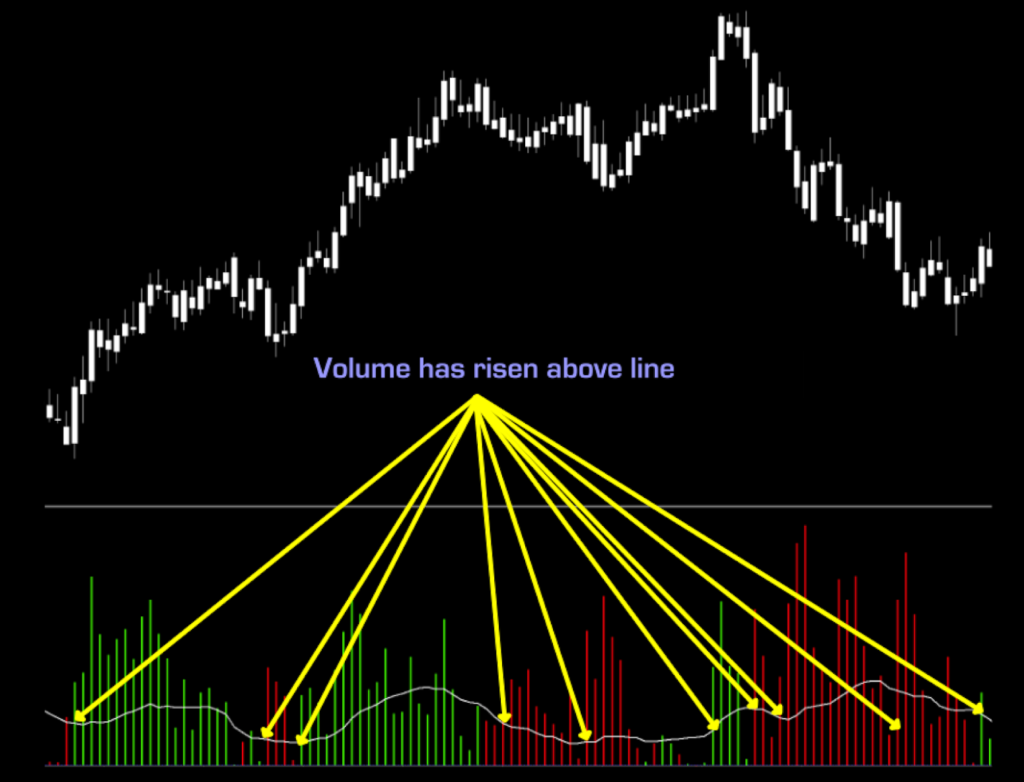
If you were to follow the simple rule of opening a position when the histogram crossed over the explosion line, you would have many more losing trades. To remedy that, we have a suggestion.
For better trading odds, consider the following; the angle of the explosion line. If the explosion line is ANGLED UP and the volume histogram is above it, it signifies that volume is “exploding”, or actively increasing. See the marked up chart below.
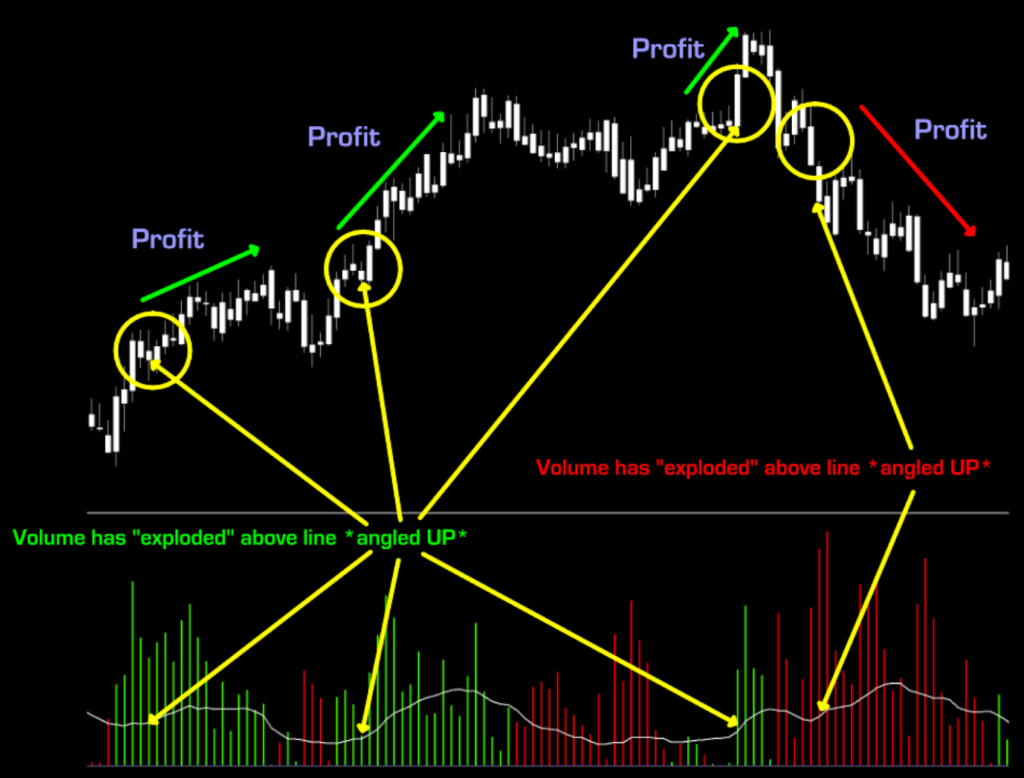
Caution: We’re only demonstrating the volume indicator by itself here. Never, ever trade with just a volume indicator.
Settings
Sensetive: (Yes, this is how it’s spelled) – Adjusts the sensitivity of the overall indicator. Generally speaking, the smaller the time frame and/or slower the market and conversely, the larger the timeframe and/or market volatility, the higher the number. The typically accepted range is 75-125.
DeadZonePip: This represents the height of the “dead zone” in pips, which is limited by the white dotted line. It serves to filter out signals which occur in this area. Most leave this setting on its default value.
ExplosionPower: Represents the level at which the indicator will generate an alert (signal).
TrendPower: Represents the level at which the indicator will alert us regarding the strength of the trend.
AlertWindow: Visually displays alerts, or not.
AlertCount: Specifies the number of alarms (or signals) for each entry/exit.
AlertLong: This enables the buy (long) entry alert.
AlertShort: This enables the short (sell) entry alert.
AlertExitLong: This enables the buy (long) exit alert.
AlertExitShort: This enables the short (sell) exit alert.
When used in conjunction with baseline and entry indicators, the confluence (when multiple things in agreement raise the level of confidence) of indicators increases your odds of a successful trade.
COMPREHENSIVE TESTING RESULTS ACROSS
CURRENCY PAIRS, BITCOIN, AND GOLD ARE IN
PROCESS AND WILL BE AVAILABLE WHEN THIS
INDICATOR IS HIGHLIGHTED ON THE NNFX CHANNEL
BY VP.
Resources
As we did with previous indicator studies, we’ve made the WAE indicator available for download on our site from the indicator library. We will keep adding better indicators with each study for your use, at no charge. When you’re ready to get it, click HERE.
More to Come
There’s a lot more to come. If you haven’t signed up on our contacts page or subscribed to the YouTube channel, please consider doing so to receive notifications as we continue to publish helpful, relevant, and informative Forex related material to support your quest to becoming a better trader.
And now, you are aware of a volume indicator that is more efficient.
Our only goal is to make you a better trader.
BTW – Any information communicated by Stonehill Forex Limited is solely for educational purposes. The information contained within the courses and on the website neither constitutes investment advice nor a general recommendation on investments. It is not intended to be and should not be interpreted as investment advice or a general recommendation on investment. Any person who places trades, orders or makes other types of trades and investments etc. is responsible for their own investment decisions and does so at their own risk. It is recommended that any person taking investment decisions consults with an independent financial advisor. Stonehill Forex Limited training courses and blogs are for educational purposes only, not a financial advisory service, and does not give financial advice or make general recommendations on investment.