Welcome to the next Stonehill Forex Indicator Study. This research represents an investigative look into how and why some indicators work and some don’t work as well.
Increased Efficiency
We introduce indicators not included with the MT4 platform to find more efficient indicators which may yield superior results than older indicators better suited for different markets.
Our Next Indicator Choice is…
The Absolute Strength Histogram is our next confirmation indicator choice. This indicator is characterized by providing an indication of who has control of the market (bulls or bears) and the strength of the trend. It has been classified as a momentum indicator, signaling not only the direction of a potential trend, but indicates the strength of the trend as well.
Similar to other trend identifying indicators, the Absolute Strength Histogram is a derivative of two moving averages (fast and slow) employing RSI and Stochastic data as well. There are a few variations available, some without a histogram and additional data controls.
After a considerable amount of search queries, we could not find who actually developed this indicator. The closest thing to a developer we could find were “business gurus” without specifying a particular date. If anybody does know who developed this indicator, shoot us an email, and we’ll make the necessary edits in this blog (and give the contributor props) for his/her efforts.
Confirmation Indicator
A “confirmation indicator” falls into the category of indicators that serve as an initial checkpoint after the baseline indicator. It is also a “below chart” indicator, which helps keep your price chart free of distractions. These concepts are explained in great detail in the Stonehill Forex Advanced Course (HERE).
Advantages
Easy to determine “long” or “short” signal
Strength and momentum of trend are indicated
Indicator variables can be adjusted to fine tune signals and smooth moving average lines
A Sight to Behold
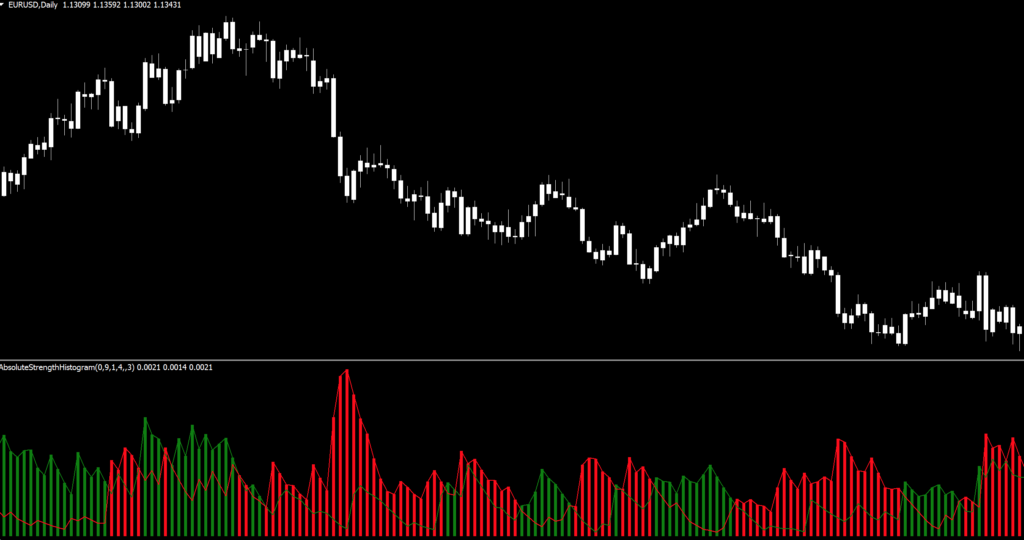
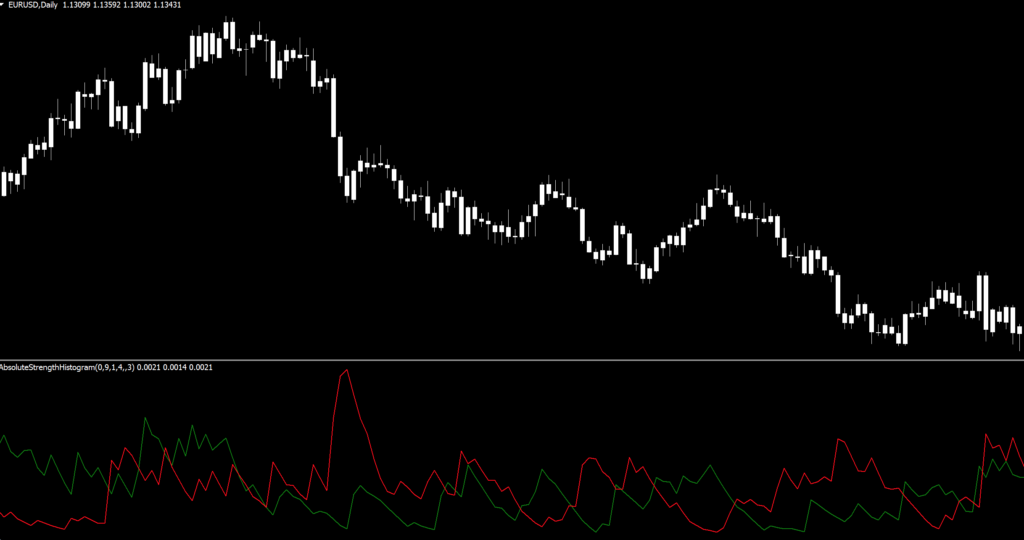
Below is a screenshot of what the indicator looks like on the daily time frame. Note that we’ve changed the color of the candles to white to remove any emotional bias and that only the indicator is prominent.
How We Use It
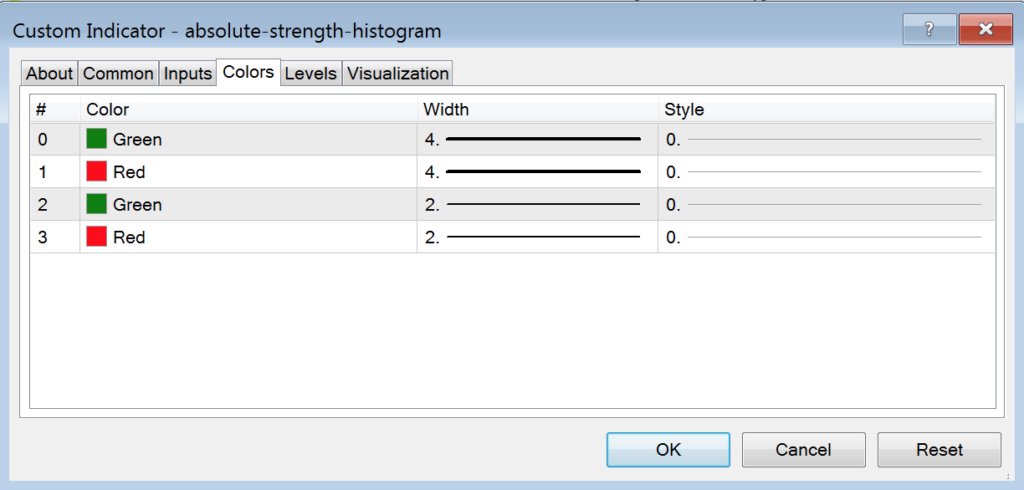
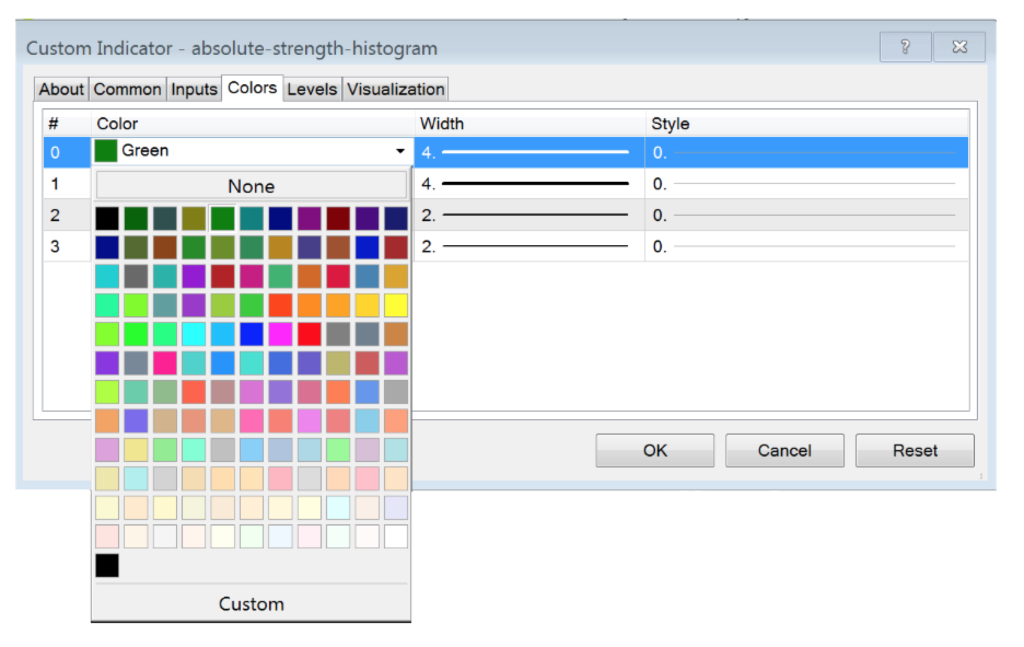
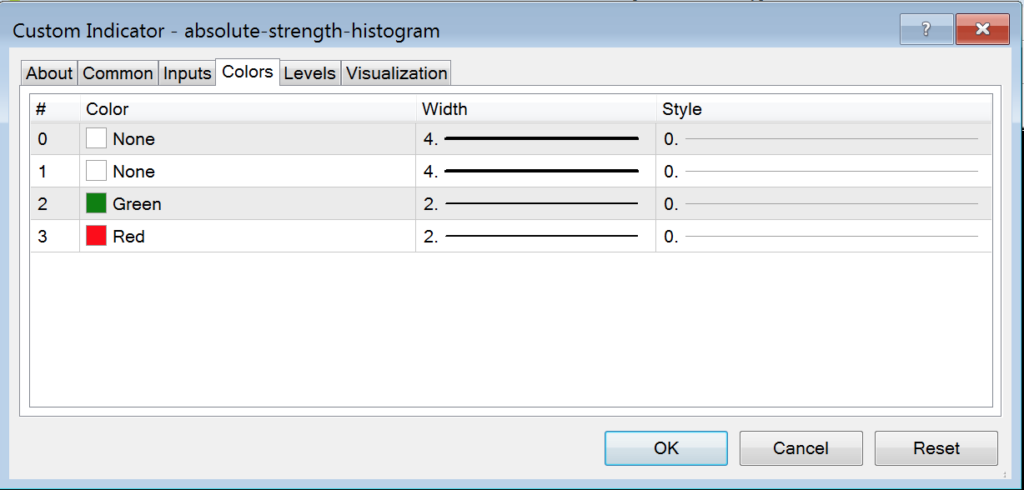
While the title of the indicator has the word “histogram” in it, we don’t actually use the histogram. We found that it can be somewhat distracting to what is important…the moving average line crossover. That beings said, we’re going to remove the histogram by changing those colors from red/green to “none” in the properties window, as noted in the screenshot below.
Once we’ve done that, the chart looks a bit cleaner…like this.
The signal occurs when one line crosses over another, depending on the color. Let’s review the highlighted marks on the picture below to understand what they mean.
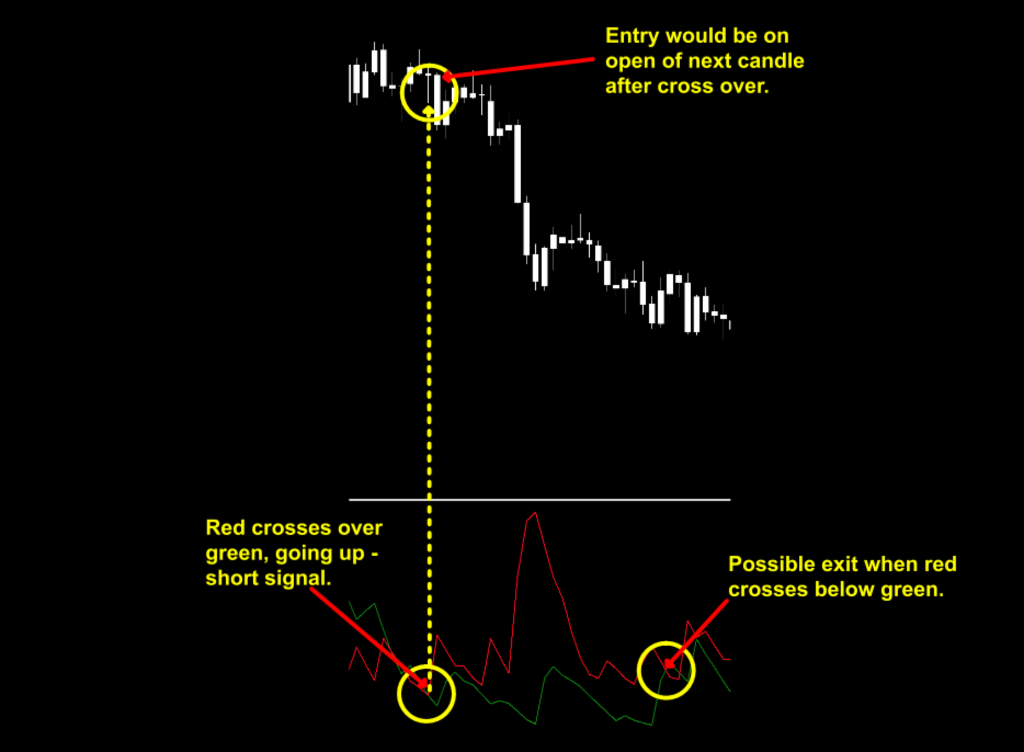
Signals
Long = Green moving average crosses above red.
Short = Red moving average crosses above green.
Settings
The settings include; mode, length, smooth, signal, price, modeMA, and mode_Histo. The default settings are; 0,9,1,4,0,3,3. These are the settings and default values of the version we have available for download on the resource page. Some versions have slightly different default values. Before we take a closer look, I’ll explain what each parameter represents.
Mode: Either 0 or 1. 0 uses the RSI method and 1 uses the Stochastic method of calculating data for the moving averages lines. Default value is 0 – RSI method.
Length: The number of bars looking back to create the moving average lines.
Smooth: This controls the degree of line smoothing (removes jagged appearance). The default value is “1” which ensures that the calculations are stable and accurately calculated. By increasing the smoothing control, increases the degree of lag the indicator will print on the chart.
Signal: This determines the duration of the signal (controls the sensitivity of data acceptance/rejection). The default value is “4” and changing it one way or another will determine how large price fluctuations are factored into the overall calculations of the indicator. Too much of a change will also cause the indicator to lag on larger market changes.
Price: Determines which data set from price is used for the indicator’s calculations. The default value is “‘0”, or the close price. “1” are open prices, “2” are highs, “3” are lows, “4” are median, “5” are typical, and “6” are weighted.
ModeMA: This controls which kind of moving average data is used. The default value is “3”, or weighted. “1” is simple and “2” is exponential.
Mode_Histo: This controls the appearance of the histogram. The default value is “3”. The values can be changed between 0 and 3; however, as we are not using the histogram, we won’t address this setting.
COMPREHENSIVE TESTING RESULTS ACROSS
CURRENCY PAIRS, BITCOIN, AND GOLD ARE IN
PROCESS AND WILL BE AVAILABLE WHEN THIS
INDICATOR IS HIGHLIGHTED ON THE NNFX CHANNEL
BY VP.
Resources
As we did with past indicator studies, we’ve made the Absolute Strength Histogram Indicator available for download on our site from the indicator library. We will keep adding better indicators with each study for your use, at no charge. When you’re ready to get it, click (HERE).
For more detail about this indicator, check out the various threads in the Forex community on the MLQ5 Marketplace website; ASH
More to Come
There’s a lot more to come. We are excited to provide more trading tips in the near future. Sign up on our contacts page or subscribe to our YouTube channel. Receive early notifications as we continue to publish helpful, relevant, and informative Forex related material to support your quest to become a better trader.
And, now you are aware of another indicator that many traders don’t know or use.
Our only goal is to make you a better trader.
BTW – Any information communicated by Stonehill Forex Limited is solely for educational purposes. The information contained within the courses and on the website neither constitutes investment advice nor a general recommendation on investments. It is not intended to be and should not be interpreted as investment advice or a general recommendation on investment. Any person who places trades, orders or makes other types of trades and investments etc. is responsible for their own investment decisions and does so at their own risk. It is recommended that any person taking investment decisions consults with an independent financial advisor. Stonehill Forex Limited training courses and blogs are for educational purposes only, not a financial advisory service, and does not give financial advice or make general recommendations on investment.